Research Article
Urban Sprawl in the Mediterranean Urban Regions in
Europe and the Crisis Effect on the Urban Land Development:
Madrid as Study Case
Jaime Díaz-Pacheco and Juan Carlos García-Palomares
Departamento de Geograf´ıa Humana, Universidad Complutense de Madrid, C/ Profesor Aranguren, s/n, 28040 Madrid, Spain
Correspondence should be addressed to Jaime D´ıaz-Pacheco; jdiazpac@ucm.es
Received 14 May 2014; Revised 1October 2014; Accepted 15 October 2014; Published 26 November 2014 Academic Editor: David Wong
Copyright © 2014 J. D´ıaz-Pacheco and J. C. Garc´ıa-Palomares. This is an open access article distributed under the Creative Commons Attribution License, which permits unrestricted use, distribution, and reproduction in any medium, provided the original work is properly cited.
Th middle of 2007 saw the beginning of a worldwide fin ncial crisis that led to a sharp reduction in investment based on construction and urban development. Thi new situation is generating a new process, characterised by a slowdown that has almost reached a standstill when compared with the frenzied development of previous decades. In order to analyse these processes, this study examines urban land use changes and the urban growth rate and spatial dynamics of the metropolitan region of Madrid. The analysis has been carried out on a large scale between two periods (2000–2006 and 2006–2009) using a regional land use geodatabase. Th results show the changes in the urban land use dynamics that took place over these two periods that could characterise the cities of Mediterranean Europe, where contrarily to the general pattern in Europe built-up areas are combining scattered built-up areas with new aggregated compact developments.
1. Introduction
Intensification of urbanization across all regions of the globe,
together with the greater ease of cartographic land use data handling through GIS and remote sensing techniques, have led to a proliferation of these kinds of studies in recent years. Analysis of urban expansion in cities in the developing world
has become more and more frequent [1–5]. Likewise research
on the rapid growth of Asian cities is becoming increasingly
abundant (see [6,7] or [8]). In Europe, the studies which deal
with urban sprawl approaches are prevalent. In many cases, especially in Mediterranean regions, this kind of approach is habitually faced from a dualistic perspective, that is, transition from compact to more dispersed growth models,
associated with phases of sprawl (see, e.g., [9–17]).
Nevertheless, urban expansion is characterized by a high
degree of complexity [18]. It does not occur in all regions
at the same degree, at the same pace, or in the same way. Rather, it must be approached and understood taking into account specifi geographical and historical contexts in which
particular urban forms shape cities [19]. For this reason some
authors note that difficulties that may arise when attempting
to study urban growth based on concepts and, above all, indicators, from North American paradigms. Jiang et al. [8] observe that sprawl indices applicable elsewhere may not be directly applied to the Chinese context. In Mediterranean
cities, Catal´an et al. [19] have warned that urban trends do not
necessarily follow the North-American model and outcomes
may differ with respect to the situation found on the other
side of the Atlantic.The polarization that this implies would
seem to need a critical reconsideration of the problem. In particular, to investigate whether some kind of hybrid process
of urban change can be identified in European and, more
specific lly, Mediterranean, cities.
Th impact of the severe economic crisis that began in
2007 should also be considered, as its effects have been
particularly drastically felt in Mediterranean countries. Th crisis has not braked the metropolitan expansion, but it has aff cted the model of the city itself. In Spanish cities, whose model of growth has been heavily dependent on construction sector, the crisis has evidently put a stop to urban growth. In addition, however, as Florida [20] has emphasized, the
crisis has presented an opportunity to revisit recent
devel-opments off ring more sustainable urban develdevel-opments.That
is, between other things, more compact urban developments with suitable densities of population which endow a fair space for inhabitants, not wasting the land, a high diversity of land uses and urban designs which permits high ratios of sustainable mobility, less based on car commuting and oriented to the public transport.
This work aims on one hand, to assess the urban land use
patterns, trends, and the evolution of Madrid during thefirst
decade of the XXI century, as an European Mediterranean metropolitan region in the context of the urban sprawl, over all linked to the residential developments. In that sense this study shows parallelisms with other similar urban develop-ment models that have already been pointed out for other
European urban regions like Barcelona or Athens [19, 21],
which sustain the existence of a kind of a hybrid urban model
(between thehyper-sprawled citiesandcompact cities). On the
other hand, the present work attempts to evince the change experienced on the urban growth trends for the mentioned European urban regions in relation with the recent crisis that is hitting Europe (since 2007).
This study analyzes the evolution of the metropolitan
area of Madrid and its land use dynamic over the last
decade (2000–2009). The work deals with a period and
a metropolitan region of great interest. The accelerated
construction dynamic known as the “tsunami urbanizador
espa˜nol” (Spanish urbanization tsunami) of the 1990s [22]
was accentuated by the implementation of a metropolitan model at every stage more dispersed and of lower density
between 2000–2006. This model was characterized by an
accelerated urban land dynamic where the low interest rates of the loans encouraged the projects related with the land
market. The urban growth model was not only linked to
the economic model, but the Spain economy was strongly supported by the urban and infrastructures developments. During the period 1995–2008 were built in Spain more than 6 million of dwellings at the same time that the land increased three times is price, and the property loans were multiplied by ten. Th credit fl wed from all the corners of the planet which caused a strong indebtedness in all the sectors but especially into the domestic economies [23].
After 2006, the situation is quitedifferent.The property
crash has resulted in the paralysis of the majority of new residential developments, now mostly confin d to small-scale
urban transformations in the inner-city areas.The debt crisis
and the public defic t have shut down investment in new infrastructure and services and direct changes associated with both of these have disappeared accordingly. At the same
time, the difficult situation in which private investors and
businessesfind themselves puts a brake on the emergence of
new activity on the city’s outskirts, precisely those areas that were so dynamic in the preceding decade.
Th growth of the European cities during the preceding decade could insignific nt since a global perspective and taking into account the extraordinary urbanization rates in China, India, Brazil, and the traditional mega-cities of North-America and Japan. Nonetheless, detailed studies of the urban
land expansion and its structure into the European
con-text and more specifically on a Mediterranean urbanization
framework can help to understand the urban transformation during the preceding decade.
Th work presented here was undertaken using land use maps for the Madrid region for the years 2000, 2006, and
2009.This cartographic dataset, denominated “Madrid
Land-Use” (MLU), is a large scale (1: 10,000) land use database
showing a high level of detail and was developed by the
research team through photographic interpretation.The
well-known Corine Land Cover (CLC) database, which covers most European Union countries and some adjacent states, for example, Turkey, available from the European Environment Agency (EEA), off rs land use and land cover information at a maximum scale of 1: 100,000 and at present covers the periods 1990, 2000, and 2006.
Moreover, CLC is one of the most frequently used sources
for analysis of land use in Europe (see, e.g., [15,16,24–27]).
It also has the advantage of being developed in coordination between participating countries, something that lends it great value in making comparisons between European regions with respect to land use and land cover change. Nevertheless, when more precise knowledge of land use change is required from the point of view of urban land occupation at a regional scale,
databases such as MLU aim tofill this vacuum by providing
urban land use information only obtainable at scales of detail in excess of 1: 10,000 through exhaustive analysis based on photointerpretation.
Thi paper is divided into six sections. Following this
introduction, in Section 2there is a brief literature review
about the urban sprawl; then, the city of Madrid is presented
as the study area in Section 3. In Section 4, the data and
methodology used in the analysis are introduced, together with discussion of the contribution of this work in the light
of previous research. InSection 5, the results are presented;
changes in land use, dynamics of dispersal, and fragmenta-tion, and changes in net population densities that have come
about as a result. Finally, in Section 6, a discussion of the
results is given and the principal conclusions are presented.
2. A Brief Literature Review of the Urban
Sprawl in the European Context
Urban sprawl has long been key topic in geography and other disciplines [28]. Urban sprawl is characterized by single family dwellings, lending uniformity to the urban landscape, reducing metropolitan density, and leading to fragmentation
of urban spaces [29–31].This kind of growth is not only a
major driver of environmental change [32,33] but also reaps
high economic and social costs [34,35]. Th most abundant
work in this area being above all that dedicated to recognizing the emergence of urban sprawl through various methods along with comparison of the phenomenon between cities
(e.g., [11,36–41]).
Sprawl is a term hard to pin down and not easy to measure, but currently there is certain scientifi agreement
and a recognition of its negativeeffects on sustainability, from
the urban planning agencies. Gillhan [38] was not far to make
0 5,000 10,000 15,000 20,000 25,000 ES S pa in FR F ra nce DE G er m an y IT I ta ly TR Tu rk ey NL N et herla nds PT Po rt ugal IE I rela nd PL Po la nd SE S w eden HU H un ga ry AL Alb ania CZ Cze ch Rep ub lic FI Finla nd DK D en m ark CY Cy pr us NO N or w ay HR Cr oa tia RO Ro ma nia AT A us tr ia IS I cela nd BA B
osnia & H
erzeg ovina EE Est onia BG B ulga ria RS Serb ia BE Be lg iu m LI Li ec ht en stein SK S lov ak ia
MK FYR o
f M ace do nia KV K os ov o SI S lo venia LU L ux em bo ur g LT L ith ua nia LV L atvia He ct ar es
LCF3 sprawl of economic sites and infrastructures LCF2 urban residential sprawl
Figur e 1: Urban sprawl in Europe (2000–2006). Source: [42].
shows itself startlingly clear from the jet plane window at thirty thousand feet: “huge expressways snake out over the land, generating a wide, loosely formed network across the world below” [38, page 13]. Sometimes, these kinds of appreciations are more understandable than a set of measures on densities, geometric shapes, diversity of land uses, spatial statistics, or landscape metrics. Nonetheless, numbers are extremely necessary following the planning management principle that “we cannot manage what we do not measure.” Urban sprawl needs, as many other human phenomena, from both approaches to be explained, the qualitative and the quantitative, in order to cover all the characteristics to be identifi d.
Urban sprawl seems to be a common feature of the metropolitan suburban areas in the last twenty years in
the European Union. The EU cities, following distantly
the North American metropolis like Los Angeles or the urbanized Northeastern Megalopolis of the United States [43] are timidly reproducing the extended, discontinuous, low-density, and fragmented spaces in the periphery of the
city centre. The immediate consequences of this type of
urban forms are those related with the transport, where the fl w networks, more complex and disperse, make longer the travel distances and the trip times, producing an excess on commuting [44].
Th sprawl is characterized by an extended low-density urban land use pattern, mostly residential, and covering a vast number of hectares, in order to supply the demand of these housing developments associated to the new commer-cial forms of the city, the malls. Th residential develop-ments spread into a competition by the land taking with the agriculture activity and natural areas and produce the irreversible transformation of the cropland, pastures, and forests. Nonetheless, the extensive land taken is not the only socioeconomic and environment impact that has been pointed out for the urban sprawl. A lack of scale economies,
that make more complicated the public services distribution;
all those derivate effects from the overload of the private cars
transit, like the increase of the energy consumption or the air pollution; and the shocks in the ecosystems are caused by the scattered urban development [45].
Although the sprawl phenomenon is relatively new in the so-called “Mediterranean European compact cities,” nowa-days it becomes unavoidable to describe their urban
land-scape [46].The Joint Research Centre brought out a report
in 2006 very concerned about the urban sprawl in Europe through analysis made over the MOLAND database at local scale and CORINE Land Cover database at European level.
In this report the sprawl is described as “the physical pattern
of low-density expansion of large urban areas[. . .]Development
is patchy, scattered and strung out, with a tendency for
discontinuity[. . .]full of empty spaces that indicate the
inef-fi iencies in development and highlight the consequences of
uncontrolled growth” [10]. In the same direction, the
UN-HABITAT on its “State of the World’s Cities 2012-2013” report has pointed out the advantages of the compact urban devel-opment, contrary to the unsustainable urban sprawl which produces higher infrastructure costs, worst access to services and facilities, and a major social segregation [47, page 94].
For the period 2000–2006, CLC indicates that the urban sprawl keeps being extremely important in Europe and espe-cially remarkable in Spain where this phenomenon was more
intense for economic sites and infrastructures (Figure 1).
In this work, as it will be explained in the methodology section, we deal with the urban sprawl over all in terms of residential net densities and measuring the size of the new urban patches and the distance between them.
3. Study Area
The study area corresponding to the Madrid Autonomous
Tabl e 1: Evolution of the population in the Madrid Autonomous Region between 2000 and 2009.
Rings Number of municipalities Population 2000–2006Changes 2006–2009Changes 2000–2009Changes
2000 2006 2009 % annual % annual % annual
1(Madrid Municipality) 1 2,882,860 3,128,600 3,255,944 1.4 1.3 1.4
2 (suburban area) 27 1,806,396 2,136,315 2,273,355 3.0 2.0 2.9
3 37 243,436 379,613 447,037 9.3 5.0 9.3
4 37 141,735 196,425 221,206 6.4 3.7 6.2
5 36 101,339 128,577 146,612 4.5 4.1 5.0
6 41 29,642 38,653 42,778 5.1 3.2 4.9
Total 179 5,207,408 6,010,189 6,388,941 2.6 2.0 2.5
Source: Municipal Census Data. Madrid.
0 25 50
(Km)
UTM-ETRS1989
1. Europe.
2. Spain.
1 4
2 5
3 6
3. Madrid-rings
Figur e 2: Location of the Madrid region, showing rings and municipalities.
municipalities (Figure 2). In 2009, the total population was 6,390,000 million inhabitants, half of whom lived in the
central city (Madrid municipality) (Table 1). In the last 10
years, the Madrid region has developed in an extraordinarily
dynamic way. The principal growth in absolute terms has
occurred in the first ring of suburban municipalities and
in the core city itself, indicating the demographic recovery of these areas, which saw population decline in the 1990s. However, in relative terms, demographic growth seemed to be proportionately greater in the more distant rings of the outer city. Thi dispersion of population was accompanied by a process of employment decentralization.
The expansion of urban land use in the Madrid
metropolitan area during the 1990s was spectacular in the European context. According to CLC, urban land increased by more than 30,000 ha, an annual growth rate of 4.77%, when the population grew scarcely 0.8% a year. Furthermore, in these years the surface area under construction grew by
200% [25, 26]. In Spain, only some coastal cities have had
greater rates of urban land growth than Madrid [48]. Th European Environment Agency signalled the Madrid region
as one of the European Union’s urban growth hotspots [10].
This dynamic of land use growth was related to a
legisla-tive framework which facilitated the entry of vast quantities of land onto the market. Municipal administrations, by way of land planning instruments, discovered a licit method of fin ncing and economic reactivation that made possible the
sale of great quantities of land [49, 50]. Th existence of
investment capital and in many cases, the gamble taken by the construction sector in terms of a marked focus toward real estate, translated, in the Spanish case, into unprecedented urban expansion.
The growth of built-up areas has been characterized by
the growth of residential land, above all by the more dispersed
and lower density urban development patterns. The CLC
database shows that, between 1990 and 2000, the compact residential areas category grew 13%, while the dispersed urban areas category (open urban structures and detached urban areas with or without gardens) grew 42.5%. Aside from the residential spaces, land related to economic activities also grew strongly. Industrial land grew 107% and became each time more strongly characterized by location on the city’s fringes and strongly related to the development of the road network (see [26]). Moreover, between 1990 and 2000, new urban development’s showed little diversity of uses, a characteristic of more compact developments.
For the period 2000–2006, CLC indicates that the urban sprawl keeps being extremely important in Europe and espe-cially remarkable in Spain where this phenomenon was more
intense for economic sites and infrastructures (Figure 1).
Madrid region is a good example of the above pointed out urban sprawl dynamic in Europe and at the beginning of the present century the intensity of changes in this metropolitan area has provoked a real economic, sociodemographic and morphological metamorphosis in a short space of time. Nevertheless, its recent evolution shows changes to this dynamic, and the outbreak of the economic crisis in EU and more accentuated in the European Southern region, where according to the IMF, their GDP per capita will be
lower in 2017 than it was in 2007 [51]. It presupposes a
new wave of change, but this time of different nature. By
processes through analysis of land use change in the Madrid region can also help to explain similar urbanization processes that have taken place throughout Mediterranean cities.
4. Data and Methodology
In Europe the majority of the analysis of land use dynamics is carried out using Corine Land Cover (CLC) cartography. Th advantage of CLC is the possibility it off rs for comparison of land use dynamics across the various European regions that have participated in the project (see, i.e., [52–54]). In the Madrid region, CLC has been employed to explain land
use evolution [25,26], the explanatory factors behind such
evolution, and the ways to obtain predictive models for exploring the future land use evolution [27].
Nevertheless, CLC presents problems relating to its appli-cation in analysis of urban dynamics, fundamentally due to the scale at which the work was carried out. Catal´a et al. [55] have detected errors using cross-tabulation analysis between 1990 and 2000, localizing and analyzing “unusual” changes. Thi study concludes that 68% of these unusual changes correspond to errors in category assignment for land use/land cover mapped. On the other hand, Feranec et al. [56] have identifi d underestimations in the analysis of land use change 1990–2000 due to the amalgamation of the residual parts of polygons smaller than 25 ha with neighbouring polygons.
In order to overcome the problems with CLC, this work uses the MLU mapping, which relates to urban land use in the
Madrid region in 2000, 2006, and 2009. MLU differentiates
7 urban land classes on the level 2 of disaggregation, which is used at the present work: 2 residential classes (multi-household and single-(multi-household), industrial, offi and retail, facilities, urban green, and infrastructures. Data capture was carried out at a high level of detail, the basic scale of reference
for the digitization work being 1: 10:000, with 100 m2as the
minimum mapped unit. Th technical procedure did not
include any kind of automatic or computer-aided classifi
ca-tion, being carried out in its entirety by photointerpretation of high resolution (0.5 m) aerial orthophotos, with the support of topographic map information for the Community of Madrid (scale 1: 1000) as well as cadastral maps (1: 5000) [57]. By comparing CLC and MLU mapping using confusion matrices D´ıaz-Pacheco and Guti´errez [58] have found that the spatial coincidence of urban land use between each data base is around 80%.
Geographical Information Software (GIS) was used to
analyze the land use changes. Land use gains and losses were analyzed, both at a general level and according to rings representing distances from the core city (every 10 km).
With the aim of analysing the impact of the new low density development types, net population densities were calculated using the total population at municipal level and the surface area of urban residential land use, both single and multihousehold. Additionally, in order to measure the degree of fragmentation amongst land uses, landscape metrics were
applied, for example, the number of patches of different uses,
their average size, or the distances between the new urban
land use patches those already existing (see [59,60] or [24]).
Urban land use2000
New urban land use2006 New urban land useMadrid municipality2009 N
0 10 20 30
(km)
Figur e 3: Evolution of urban land, 2000–2009. Source: Madrid Land-Use (MLU).
Finally, maps were calculated showing kernel densities
for change areas. These maps allow the reasoning behind the
location of the most dynamic areas to be identified and the
new central focus points in the periurban areas to be located [8].
5. Results
5.1.A Slowdown of the Urban Expansion? Between 2000 and
2009, urban land use grew 19.4%, at an annual rate of 2.2%
(Figure 3, Table 2). Thi increase has occurred at a time of
population growth. In fact, the population has grown at a
faster pace than the urban land use (SeeTable 1). Th annual
growth rate for urban land uses from 2000 to 2006 was 2.4%, with a clear deceleration from 2006 onwards (a rate of 1.4% annually).
The e data break with the tendency for the consumption of artifici l land per person to grow observed in the preceding
decades. For the first time in many years, the available built
up area per inhabitant declined, from 171.2 m2/inhabitant in
2000, to 169.8 in 2006 and 166.6 in 2009 (this increase in urban land, at a time of demographic stagnation, meant a notable increase in the built-up area available to each person,
which in only five years (1996 to 2001) went from 153to 179 m2
per inhabitant [61]).
0 1 2 3 4 5 6 7 8 9 10
1 2 3 4 5 6 Total
Rings
Population Urban land
(%)
0 1 2 3 4 5 6 7 8 9 10
1 2 3 4 5 6 Total
Rings
Population Urban land
(%)
2000–2006 2006–2009
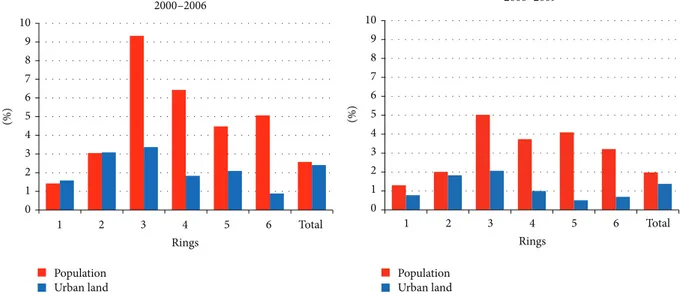
Figure 4: Annual growth for population and urban land use between 2000–06 and 2006–09. Source: National Institute of Statistics and Madrid Land-Use.
R multihousehold
R single- household Industrial
Services-facilities
Green-sports
Infrastructures
Land uses
N
0 5 10
(km)
2000 2006 2009
Table 2: Evolution of land use in the decade from 2000 (Hectares).
Land Uses Change per year (%)
2000 2006 2009 2000–2006 2006–2009 2000–2009
Residential multihousehold 12,890 14,543 15,551 2.1 2.3 2.3
Residential single-household 31,286 34,444 35,673 1.7 1.2 1.6
Facilities and services 8,556 9,583 10,055 2.0 1.6 1.9
Offi and retail 1,054 1,636 1,974 9.2 6.9 9.7
Green and sport areas 10,196 12,251 12,835 3.4 1.6 2.9
Industrial 10,867 12,695 13,344 2.8 1.7 2.5
Infrastructures 14,313 16,898 17,002 3.0 0.2 2.1
Total urban 89,165 102,052 106,436 2.4 1.4 2.2
Nonurban 713,387 700,500 696,116 −0.3 −0.2 −0.3
Total Madrid region 802,552 802,552 802,552
Source: Madrid Land-Use (MLU).
of Madrid’s periurban metropolitan landscape. The
single-household dwellings category is the most extensive of all of the urban land uses (34% of the total in 2009, against 14% residential multihousehold dwellings), but at the same time they house a much smaller population [62]. But between 2000 and 2009, the rate of growth of single-household residential areas is much less than is the case for multihousehold dwellings. Indeed, the residential multihousehold is the only class that has increased its rate of growth in the last three years, while single-household dwellings rate has decreased (Table 2). Thi tendency represents a break with the preceding decade and the sprawl model. Nevertheless, many of the new multihousehold developments are also associated with low-rise buildings, with a small number of homes and open plan
housing estates [49,62].
Th expansion of artifici l land results also from the strong growth of other not residential activities (Table 2). Th land uses that grow the most between 2000 and 2009 are those related to service activities and infrastructures, particularly in the six years of economic growth. Service activities grow 9.7% annually, green and sports areas at 2.9% annually, and infrastructures at 2.1%.However, both green and sports areas and infrastructures have seen notable reduction in the rate of growth in the last 3 years.
If we compare the expansion of the urban area with the
population, signific nt differences can be noted (Figure 4).
The rate of population growth is greater than that of the
urban area and aff cts the spaces that are furthest away from the city centre. Th highest growth rates, both in terms of population and urban area, occur in the third ring. But while the values for percentage population growth are greater in
the outermost rings (fourth, fifth, and sixth), in terms of
urban area, growth is greater in the second ring, and even in Madrid municipality itself (the core city), the values are not
greatly different from those for the most distant rings. The
growth of urban land shows a less marked expansion than the population dynamic, a situation that becomes even more pronounced for the latest years.
By land use types, the greater part of the multihousehold residential spaces is located in the city of Madrid, along with facilities and services, tertiary uses and the infras-tructures themselves. On the other hand, the surface area
0 50 100 150 200 250 300 350
Ring 1 Ring 2 Ring 3 Ring 4 Ring 5 Ring 6 Total
N
et
po
pu
latio
n
den
sity
(in
ha
bi
ta
nt
s/he
ct
ar
e)
[2000] [2006] [2009]
Figure 6: Net population density by rings (inhabitants per hectare). Source: National Institute of Statistics and Madrid Land-Use.
taken up by single-household dwellings extends strongly
in the metropolitan fringe, with a much shallower fall-off
towards the outside of the city. Industrial land is also strongly represented in the second and third rings (Figure 5).
5.2. An Increase in Net Population Density. Th net
pop-ulation density in the metropolitan area of Madrid grew from 118 inhabitants/hectare in 2000 to 125 in/ha in 2009, an
increase of 5.8%.The net densities are very high in the city
of Madrid (320 in/ha) and in the fi st ring (140 in/ha), but decline strongly in the outermost rings (Figure 6). During these years a tendency towards greater densific tion in the
outermost rings can be shown.The highest rates of
popula-tion growth of the residential areas lead to a growth of net density throughout all of the metropolitan rings, but brings stronger growth in the outermost and most dynamic rings. By contrast, the net population density remains constant on the central spaces and in the fi st ring. Between 2006 and 2009 the growth in population density and its expansion to the outermost rings has become less intense.
Th changes in the population density distribution affect
the configur tion of the metropolitan model of Madrid itself. Besides of the core-periphery gradient, Madrid has
Table 3: Urban patches: total number and average sizes.
Year Total Size (Ha)
Mean Standard deviation
2000 3,827 19.6 89.5
2006 4,091 20.8 95.2
2009 4,120 21.7 98.7
Source: Madrid Land-Use (MLU).
Table 4: Changes in number and average size of urban patches.
2000–2006 2006–2009 2000–2009
Total % annual Total % annual Total % annual
Total 264 1.15 29 0.24 293 0.85
Mean size 1.26 1.07 0.89 1.43 2.15 1.22
Standard
deviation 5.66 1.05 3.55 1.24 9.21 1.14
Source: Madrid Land-Use (MLU).
metropolitan municipalities of the south and east, with densities above 250 in/ha and areas of lower density and single-household dwellings in the north and, above all, in the west of the city [62]. Th evolution of the net population density shows declining density in the densely populated municipalities of the south and east. Conversely, in the north and to an even greater extent in the west, population density
has notably increased, in particular in the first 6 years of
greater dynamism (Figure 7). A general negative correlation can therefore be identifi d between net density in the year 2000 and the change in net density between the two periods (Figure 8).
5.3.The Fragmentation of Land Uses. In addition to low
den-sities, growth dynamics associated with sprawl can be charac-terized by a higher discontinuity and a greater fragmentation of the urban developments. In Madrid, the number of urban
land use patches had an annual increase of 0.85%. The average
size and standard deviation of the patches also increased.The
average size passed from 19.6 ha in 2000 to 21.7ha in 2009, an increase of 1.2%in average size. Th majority of the new urban patches appear between 2000 and 2006. On the other hand, the average size of the patches increased more strongly
in the second period (Tables3and4).
Thi tendency shows a transition from more disposed development to a return towards development of a more compact and contiguous type.
Th distance between the new urban land patches and those already in existence also decreased (Table 5). Th average distance between new and existing patches 2000– 2009 is 410 metres. Nonetheless, the distance between exist-ing patches and those created between 2000 and 2006 is considerably greater (almost 25%) than for those created between 2006 and 2009.
5.4.The Logic behind the Distribution of Land Use Changes.
To identify the logic behind the location of the new devel-opments in the decade 2000–2009, density maps of the new
developments were calculated (Figure 9). Th maps show how the changes tend to be concentrated in particular areas, fundamentally at the intersections of high-capacity roads, reinforcing the polycentric model that had been developing in the previous decades.
In the case of the residential areas, the multihouse-hold dwellings tend to be concentrated in the environs
of the orbital transport corridors of the first and second
metropolitan rings, most strongly in the north and west of the metropolitan area (Figure 9). Th intensity of these changes is greater between 2000 and 2006 than in the period of the cri-sis, but the location of the developments initiated in the sec-ond period reinforces these tendencies (Figure 9). Th single-household residential areas are located further from the core city (Figure 9). Th location of the new developments related
with economic activities exhibits two verydifferent patterns.
On the one hand, the new developments associated with
services tend to configure a clearly polycentric model, with
locations strongly related to the high capacity road network and a very marked north-west tendency (Figure 9). Con-versely, industrial activities show strong dispersion and frag-mentation, with numerous locations in outermost rings and less dependent on the high capacity road network (Figure 9).
Th preceding maps show howdifferent land uses present,
in some cases, similar spatial distributions. Thi tendency is clearer in the new developments of the north and west of the
metropolitan area. The tendency shows another behaviour
from the land use changes of previous decades, in the sense
that while the 1980s and 1990s saw the configuration of
a model with scarcely any mixture of uses, the present metropolitan subcentres tend to comprise spaces with a much
greater mixture of uses (seeFigure 10).
6. Discussion and Conclusions
Th metropolitan area of Madrid experienced a phase of
intense urban expansion at the end of the last century.The
urban land surface area grew at a rate in excess of 4% per year and the spaces at the furthest remove from the core city showed the highest rates of growth [26]. Madrid should be considered as one of the leading exponents of sprawl in the Mediterranean and one of the hotspots in Europe to this respect (see report [10]). However, between 2006 and 2009, a change to this tendency can be noted. Despite demographic recovery, in particular in the innermost
rings, the expansion of urban land reduced sharply. This
tendency is very noticeable from 2006 onwards, a period that included the beginning of a serious economic recession in Europe and especially in Mediterranean countries. Th majority of the research which is undertaken by investigating the transition from compact towards dispersed urban form
(see, e.g., [3,16,21,24,63]).The concept of sprawl is derived
from the description of the patterns of expansion of North American metropolitan areas over the last 50 years. From North America, the concept has been applied to analyze the urban growth in all regions of the world, to such a point that it has become another umbrella surrounded by a controversy
10 20 0
(km)
10 20 0
(km)
Net density change (%)
< −6
−5.99–0 0.01–10
10.01–20
20.01–40
Net density change (%)
< −6
−5.99–0 0.01–10
10.01–20
20.01–40
2000–2006 2006–2009
>40 >40
Figur e 7: Net density change. % annual growth rate between 2000–2006 (left) and 2006–2009 (right). Source: Madrid Land-Use (MLU).
10 30 50 70 90
0 0.5 1 1.5 2 2.5 3
LOG10 [population density (2000)]
−50
−30 −10
y = −33,085x + 76,487
R2= 0,48∗∗
10 30 50 70 90
0 0.5 1 1.5 2 2.5 3
LOG10 [Population density (2006)]
−50
−30 −10
y = −10,632x + 25,396
R2= 0,21∗∗
N
et den
sity c
ha
ng
e
2000
–
2006
(in%)
N
et den
sity c
ha
ng
e
2000
–
2006
(in%)
Figur e 8: Relationship between net population density and evolution of population density by periods (municipalities).∗∗Correlation is
signific nt at the 0.01level. Source: INE and MLU.
Table 5: Distances between new and existing urban land patches.
Number of new patches Annual increment Distance from former patches Mean Standard deviation
2000–2006 512 86 429.8 714.4
2006–2009 165 55 326.7 340.3
2000–2009 623 69 410.8 674.24
0 20 (km)
N
High
Low
Services High
Low
Industrial Multihousehold
High
Low
High
Low
Single-household
2000
–
2006
2006
–
2009
Figur e 9: Density of in/km2in the creation of new urban land use (urban activity). Source: Madrid Land-Use (MLU).
2 2
1
1 3
3 4
4
Land uses
Urban land2000
R multi-household R single- household
Industrial Office etail Facilities
Sport Services Urban green Infrastructures
N
0 2.5 5
(km)
urban sprawl is a type of urban growth characterized by a low-density, dispersed spatial pattern with both environmental
and social impacts [29–31,41]. It is clear that the structure of
European cities generally has become less compact, and this is also the case in Mediterranean. However, urban trends do not necessarily follow the North-American model and outcomes
may differ with respect to the situation found at the other
shore of the Atlantic [11,19].
Already prior to the crisis, Madrid presented an evolution very diff rent to the previous decades. Growth of urban land
is lower, even despite the demographic recovery.This
evolu-tion breaks with the strong growth in consumpevolu-tion of land which characterized the evolution of Madrid in the 1990s; in fact, the urban surface area per inhabitant has reduced in the last decade. As a result, net population densities have increased. In Madrid, a “hybrid model” has become consol-idated, and that means an intermediate between sprawl and the compact city, something that Catal´an et al. [19] already
identifi d in Barcelona.This hybrid model is characterized
by high-rise dwellings which are of course multihousehold, but, in contrast to the characteristic dwellings of Madrid’s core city or the compact metropolitan municipalities, have
fewerfloors and extensive open spaces and green areas. In
contrast to the North-American or North European suburbs, the expansion of the residential spaces results not so much from the deployment of two or two and a half storey dwellings (single-household terraced), as from those of four to six storeys (blocks of moderate height). Although the urban landscape thus becomes more horizontally distributed and less compact and corresponds to a lower intensity in new urban developments, the numerical prevalence of the
so-calledvivienda colectiva (multihousehold dwelling) [61,
62]. The e kinds of new spaces tend to homogenize the distribution of population density. In the western outskirts, a traditionally single-household area, density has increased. At the same time, in contrast, in the traditionally compact areas of the southern metropolitan area, densities have declined.
Furthermore, in this paper we have analyzed the urban expansion of Madrid by means of landscape metrics using land use cartography and GIS, an approach that is much used for analysis of changes in land use patterns and sprawl
models [24,59,64,65]. Th results show how the expansion
of Madrid between 2000 and 2009 can be diff rentiated from sprawl not only on the basis of the increase in densities, but also on because of the lesser fragmentation and spatial
dispersion. The number of new urban land use patches
reduces and the patch size grows. It is signific nt that while in the residential single-household spaces, existing patches increase in size, the new patches are fundamentally associated with the new multihousehold developments. Between the uses related to economic activities, only in industrial uses is the tendency to dispersion maintained, while amongst the tertiary areas, the sports and green areas a polycentric model is consolidated. In the metropolitan subcentres, there appears moreover a combination of land uses, breaking with another of the typical characteristics of sprawl. In synthesis, in the metropolitan area of Madrid, the present processes of expansion do not involve the random and chaotic dispersion of residential spaces or other periurban activities; rather, they
are linked to the improvement and densific tion of the trans-port networks. On the other hand, the dynamics of proximity
are far from losing their relevance. The new subcentres in
suburban contexts attract activity and population.
In this way, a polycentric growth model has intensifie , again in accordance with expansion tendencies detected in
other Mediterranean metropolitan areas [19,21]. In Madrid, a
model with elements of polycentrism has become established, corresponding to the consolidation of urban subcentres articulated through nodes of high accessibility, with its
own dynamic and the capacity toinfluence the functional
structure of the city [66].
Th strong urban expansion of the 1990s in most Mediter-ranean areas was in part supported by the impotence of plan-ning control, in many cases as a consequence of the existence of a strong administrative fragmentation (municipalities) and the lack of a common policy for the metropolitan area as
a whole [21, 67], elements that are key to understanding
the evolution of Madrid. However, in the last decade, as in other Mediterranean areas, a series of actions have aimed to reorient planning and introduce measures to control dispersion. Undoubtedly, these actions have been able to contain urban growth, reducing the pace of urban land expansion in the early years of the new millennium, a period
of strong economic growth.The appearance of the crisis could
be seen as an opportunity to turn the clock back on Madrid’s recent evolution and dispense with a model of expansion that has generated serious problems of sustainability and merits correction through policies aimed to rebalance and redirect
the dynamics underway [61, 68]. A detailed knowledge of
land use change is fundamental for such a task.
Conflict of Interests
The authors declare that there is no conflict of interests
regarding the publication of this paper.
Acknowledgments
Thi paper was developed by researchers from the Com-plutense University of Madrid with fin ncial support from the Ministerio de Ciencia e Innovaci´on (Project TRA2008-06682 and Project TRA2010-19788).
References
[1] E. L´opez, G. Bocco, M. Mendoza, and E. Duhau, “Predicting land-cover and land-use change in the urban fringe. A case in Morelia city, Mexico,”Landscape and Urban Planning, vol. 55, no. 4, pp. 271–285, 2001.
[2] K. Sutton and W. Fahmi, “Cairo's urban growth and strategic master plan in the light of Egypt's 1996 population census results,”Cities, vol. 18, no. 3, pp. 135–149, 2001.
[3] H. Alphan, “Land-use change and urbanization of Adana, Turkey,”Land Degradation & Development, vol. 14, no. 6, pp. 575–586, 2003.
countries: an application case study in Lagos, Nigeria,” Environ-ment and Planning B: Planning and Design, vol. 31, no. 1, pp. 65– 84, 2004.
[5] A. G. Aguilar, “Peri-urbanization, illegal settlements and envi-ronmental impact in Mexico City,”Cities, vol. 25, no. 3, pp. 133– 145, 2008.
[6] G. C. S. Lin, “The growth and structural change of Chinese cities: a contextual and geographic analysis,”Cities, vol. 19, no. 5, pp. 299–316,2002.
[7] D. F. Frederic and Y. Huang, “Uneven land reform and urban sprawl in China: the case of Beijing,”Progress in Planning, vol. 61, no. 3, pp. 211–236, 2004.
[8] F. Jiang, S. Liu, H. Yuan, and Q. Zhang, “Measuring urban sprawl in Beijing with geo-spatial indices,”Journal of Geograph-ical Sciences, vol. 17, no. 4, pp. 469–478, 2007.
[9] F. Dieleman and M. Wegener, “Compact city and urban sprawl,” Built Environment, vol. 30, no. 4, pp. 308–323, 2004.
[10] EEA, “Urban Sprawl in Europe. Th ignore challenge,” Report 10/2006, Joint Research Centre, European Environment Agency, Copenhagen, Denmark, 2006.
[11] M. Kasanko, J. I. Barredo, C. Lavalle et al., “Are European cities becoming dispersed? A comparative analysis of 15 European urban areas,”Landscape and Urban Planning, vol. 77, no. 1-2, pp. 111–130, 2006.
[12] J. Solon, “Spatial context of urbanization: Landscape pattern and changes between 1950 and 1990 in the Warsaw metropolitan area, Poland,”Landscape and Urban Planning, vol. 93, no. 3-4, pp. 250–261, 2009.
[13] L. Salvati and A. Sabbi, “Exploring long-term land cover changes in an urban region of southern Europe,”International Journal of Sustainable Development and World Ecology, vol. 18, no. 4, pp. 273–282, 2011.
[14] L. Poelmans and A. van Rompaey, “Detecting and modelling spatial patterns of urban sprawl in highly fragmented areas: a case study in the Flanders-Brussels region,”Landscape and Urban Planning, vol. 93, no. 1, pp. 10–19, 2009.
[15] L. Salvati, M. Munafo, V. G. Morelli, and A. Sabbi, “Low-density settlements and land use changes in a Mediterranean urban region,”Landscape and Urban Planning, vol. 105, no. 1-2, pp. 43– 52, 2012.
[16] L. Salvati, A. Sateriano, and S. Bajocco, “To grow or to sprawl? Land cover relationships in a Mediterranean City region and implications for land use management,”Cities, vol. 30, no. 1, pp. 113–121,2013.
[17] F. Molin´ı and M. Salgado, “Sprawl in Spain and Madrid: a low starting point growing fast,”European Planning Studies, vol. 20, no. 6, pp. 1075–1092, 2012.
[18] H. Couclelis, “Of mice and men: what rodent populations can teach us about complex spatial dynamics,”Environment and Planning A, vol. 20, no. 1, pp. 99–109, 1988.
[19] B. Catal´an, D. Saur´ı, and P. Serra, “Urban sprawl in the Mediter-ranean?. Patterns of growth and change in the Barcelona Metropolitan Region 1993–2000,”Landscape and Urban Plan-ning, vol. 85, no. 3-4, pp. 174–184, 2008.
[20] R. Florida,Th Great Reset, HaperCollins, New York, NY, USA, 2011.
[21] I. Chorianopoulos, T. Pagonis, S. Koukoulas, and S. Drymoniti, “Planning, competitiveness and sprawl in the Mediterranean city: the case of Athens,”Cities, vol. 27, no. 4, pp. 249–259, 2010. [22] R. Fern´andez, El Tsunami Urbanizador Espa˜nol y Mundial,
Virus Editorial, Barcelona, Spain, 2006.
[23] Observatorio Metropolitano de Madrid, Paisajes Devastados Despu´es del Ciclo Inmobiliario: Impactos Regionales y Urbanos de la Crisis, Trafic ntes de Sue˜nos, 2013.
[24] F. Aguilera, L. M. Valenzuela, and A. Botequilha-Leit˜ao, “Land-scape metrics in the analysis of urban land use patterns: a case study in a Spanish metropolitan area,”Landscape and Urban Planning, vol. 99, no. 3-4, pp. 226–238, 2011.
[25] R. Hewitt and F. Escobar, “The territorial dynamics of fast-growing regions: unsustainable land use change and future policy challenges in Madrid, Spain,”Applied Geography, vol. 31, no. 2, pp. 650–667, 2011.
[26] W. Plata-Rocha, M. G´omez-Delgado, and J. Bosque-Sendra, “Cambios de usos del suelo y expansi´on urbana en la Comu-nidad de Madrid (1990–2000) (Land use change and urban expansion in the Comunidad de Madrid, Spain (1990–2000)),” Scripta Nova, vol. 13, no. 293, 2009.
[27] W. Plata-Rocha, M. G¨omez-Delgado, and J. Bosque-Sendra, “Simulating urban growth scenarios using GIS and multicriteria analysis techniques: a case study of the Madrid region, Spain,” Environment and Planning B: Planning and Design, vol. 38, no. 6, pp. 1012–1031, 2011.
[28] X. J. Yu and C. N. Ng, “Spatial and temporal dynamics of urban sprawl along two urban-rural transects: a case study of Guangzhou, China,”Landscape and Urban Planning, vol. 79, no. 1,pp. 96–109, 2007.
[29] R. Ewing, “Is Los Angeles-style sprawl desirable?”Journal of the American Planning Association, vol. 63, no. 1, pp. 107–126, 1997. [30] G. Galster, R. Hanson, M. R. Ratcliffe, H. Wolman, S. Coleman, and J. Freihage, “Wrestling sprawl to the ground: defini g and measuring an elusive concept,”Housing Policy Debate, vol. 12, no. 4, pp. 681–717, 2001.
[31] G. R. Hess, S. S. Daley, and B. K. Derrison, “Just what is sprawl, anyway?”Carolina Planning, vol. 26, no. 1, pp. 11–26, 2001. [32] B. L. Turner II, W. C. Clark, R. W. Kates, J. F. Richards, J. T.
Mathews, and W. B. Meyer, “The earth as transformed by human action,” inGlobal and Regional Changes in the Biosphere over the Past 300 Years, B. L. Turner II, Ed., Cambridge University Press, Cambridge, UK, 1990.
[33] W. P. Anderson, P. S. Kanaroglou, and E. J. Miller, “Urban form, energy and the environment: a review of issues, evidence and policy,”Urban Studies, vol. 33, no. 1, pp. 7–35, 1996.
[34] J. E. Frank,Th Cost of Alternative Development Patterns: A Review of the Literature, Urban Land Institute, Washington, DC, USA, 1989.
[35] European Comission, ESDP: European Spatial Development Perspective, European Union, Luxembourg City, Luxembourg, 1999.
[36] A. Downs, “Some realities about sprawl and urban decline,” Housing Policy Debate, vol. 10, no. 4, pp. 955–974, 1999. [37] R. Ewing, R. Pendall, and D. Chen,Measuring Sprawl and Its
Impact, Smart Growth America, Washington, DC, USA, 2002. [38] O. Gillhan,Th Limitless City: A Primer on the Urban Sprawl
Debate, Island Press, Offi for Offici Publications of the European Communities, Luxembourg, 2002.
[39] J. E. Hasse and R. G. Lathrop, “Land resource impact indicators of urban sprawl,”Applied Geography, vol. 23, no. 2-3, pp. 159– 175, 2003.
[40] R. Lopez and H. P. Hynes, “Sprawl in the 1990s: measurement, distribution, and trends,”Urban Affairs Review, vol. 38, no. 3,
[41] R. Bruegmann, Sprawl: A Compact History, University of Chicago Press, Chicago, Ill, USA, 2005.
[42] EEA,The European Environment—State and Outlook 2010:
Syn-thesis, European Environment Agency, Copenhagen, Denmark, 2010.
[43] J. Gottmann,Megalopolis: Th Urbanized Northeastern Seaboard of the United States, MIT Press, Cambridge, Mass, USA, 1964. [44] J. C. Garc´ıa-Palomares, “Urban sprawl and travel to work: the
case of the metropolitan area of Madrid,”Journal of Transport Geography, vol. 18, no. 2, pp. 197–213, 2010.
[45] A. Frenkel and M. Ashkenazi, “Measuring urban sprawl: how can we deal with it?”Environment and Planning B: Planning and Design, vol. 35, no. 1, pp. 56–79, 2008.
[46] F. Munoz, “Lock living: urban sprawl in Mediterranean cities,” Cities, vol. 20, no. 6, pp. 381–385, 2003.
[47] UN-Habitat,State of the World’s Cities 2012/2013: Prosperity of Cities, Routledge, New York, NY, USA, 2013.
[48] Ministerio of Works,Atlas Estad´ıstico de las ´Areas Urbanas de Espa˜na, 2006, Secretaria General T´ecnica, Centro de Publica-ciones del Ministerio de Vivienda, 2007.
[49] R. L´opez de Lucio, “La regi´on urbana de Madrid: territorio y transformaci´on en la estructura espacial,” in AAVV. La Explosi´on de la ciudad. Transformaciones Territoriales en las Regiones Urbanas de la Europa Meridional, Ministerio de la Vivienda, Madrid, Spain, 2007.
[50] J. D´ıaz-Pacheco and R. Hewitt, “El territorio como bien de consumo: las grandes superficies comerciales en el contexto metropolitano y su implicaci´on para el desarrollo urbano sostenible,” inCiudad, Territorio y Paisaje, pp. 234–249, 2010. [51] P. Guerrieri,The Rise of Unemployment in the Eurozone:The
Worst of the Crisis is Not Over, vol. 51,The G-20 and Central Banks in the New World of Unconventional Monetary Policy, 2013.
[52] N. X. Thi h, G. Arlt, B. Heber, J. Hennersdorf, and I. Lehmann, “Evaluation of urban land-use structures with a view to sustain-able development,”Environmental Impact Assessment Review, vol. 22, no. 5, pp. 475–492, 2002.
[53] M. Gu´erois and D. Pumain, “Built-up encroachment and the urbanfield: a comparison of forty European cities,”Environment and Planning A, vol. 40, no. 9, pp. 2186–2203, 2008.
[54] R. Fuller and K. Gaston, “The scaling of green space coverage in European cities,”Biology Letters, vol. 5, pp. 352–355, 2009. [55] R. Catal´a, J. Bosque, and W. Plata, “An´alisis de posibles errores
en la base de datos CORINE land cover (1990–2000) en la comunidad de Madrid. (Error analysis in the geodatabase CORINE land cover (1990–2000) in Madrid Community),” Estudios Geogr´afi os, vol. 69, no. 264, pp. 81–104, 2008. [56] J. Feranec, G. Hazeu, S. Christensen, and G. Jaffrain, “Corine
land cover change detection in Europe (case studies of the Netherlands and Slovakia),”Land Use Policy, vol. 24, no. 1, pp. 234–247, 2007.
[57] J. D´ıaz-Pacheco and J. C. Garc´ıa-Palomares, “A highly detailed land-use vector map for Madrid region based on photo-interpretation,”Journal of Maps, vol. 10, no. 3, pp. 424–433, 2014. [58] J. D´ıaz-Pacheco and J. Guti´errez, “Exploring the limitations of CORINE Land Cover for monitoring urban land-use dynamics in metropolitan areas,”Journal of Land Use Science, vol. 9, no. 3, pp. 243–259, 2013.
[59] A. Botequilha Leit˜ao and J. Ahern, “Applying landscape ecolog-ical concepts and metrics in sustainable landscape planning,” Landscape and Urban Planning, vol. 59, no. 2, pp. 65–93, 2002.
[60] A. Botequilha-Leit˜ao, J. Miller, J. Ahern, and K. Mcgarigal, Measuring Landscapes. A Planner’s Handbook, Island Press, Washington, DC, USA, 2006.
[61] R. L. de Lucio, “Morfolog´ıa y caracter´ısticas de las nuevas periferias. Nueve paisajes residenciales en la regi´on urbana de Madrid (Urban morphology and characteristics of the new peripheries. Nine residential landscapes in the urban region of Madrid),”Urban, vol. 9, pp. 56–80, 2004.
[62] J. Guti´errez and J. C. Garc´ıa-Palomares, “New spatial patterns of mobility within the metropolitan area of Madrid: towards more complex and dispersed flow networks,”Journal of Transport Geography, vol. 15, no. 1, pp. 18–30, 2007.
[63] F. Terzi and F. Bolen, “Urban sprawl measurement of Istanbul,” European Planning Studies, vol. 17, no. 10, pp. 1559–1570, 2009. [64] K. C. Seto and M. Fragkias, “Quantifying spatiotemporal
patterns of urban land-use change in four cities of China with time series landscape metrics,”Landscape Ecology, vol. 20, no. 7, pp. 871–888, 2005.
[65] J. N. DiBari, “Evaluation of five landscape-level metrics for measuring theeffects of urbanization on landscape structure: the case of Tucson, Arizona, USA,” Landscape and Urban Planning, vol. 79, no. 3-4, pp. 308–313, 2007.
[66] M. T. Gallo, R. Garrido, and M. Vivar, “Cambios territoriales en la Comunidad de Madrid: policentrismo y dispersi´on,”EURE, vol. 36, no. 107, pp. 49–65, 2010.
[67] R. Hewitt and V. Hernandez-Jimenez, “Devolved regions, frag-mented landscapes: the struggle for sustainability in Madrid,” Sustainability, vol. 2, no. 5, pp. 1252–1281, 2010.
Submit your manuscripts at
http://www.hindawi.com
Hindawi Publishing Corporation
http://www.hindawi.com Volume 2014
Education
Research International
Hindawi Publishing Corporation
http://www.hindawi.com Volume 2014 Biomedical EducationJournal of
Hindawi Publishing Corporation
http://www.hindawi.com Volume 2014
Hindawi Publishing Corporation
http://www.hindawi.com Volume 2014
Psychiatry
Journal
Archaeology
Journal ofHindawi Publishing Corporation
http://www.hindawi.com Volume 2014
Hindawi Publishing Corporation
http://www.hindawi.com Volume 2014
Anthropology
Journal ofHindawi Publishing Corporation
http://www.hindawi.com Volume 2014
Research and Treatment
Schizophrenia
Hindawi Publishing Corporation
http://www.hindawi.com Volume 2014
Urban Studies
Research
Population ResearchInternational Journal ofHindawi Publishing Corporation
http://www.hindawi.com Volume 2014
Criminology
Journal ofHindawi Publishing Corporation
http://www.hindawi.com Volume 2014
Aging Research
Journal ofHindawi Publishing Corporation
http://www.hindawi.com Volume 2014
Hindawi Publishing Corporation
http://www.hindawi.com Volume 2014
Nursing
Research and Practice
Current Gerontology & Geriatrics Research
Hindawi Publishing Corporation
http://www.hindawi.com Volume2014
Sleep Disorders
Hindawi Publishing Corporation
http://www.hindawi.com Volume 2014
Addiction
Journal of Hindawi Publishing Corporationhttp://www.hindawi.com Volume 2014
Depression Research and Treatment
Hindawi Publishing Corporation
http://www.hindawi.com Volume 2014
Hindawi Publishing Corporation
http://www.hindawi.com Volume 2014
Geography
Journal
Hindawi Publishing Corporation
http://www.hindawi.com Volume 2014
Research and Treatment
Autism
Hindawi Publishing Corporation
http://www.hindawi.com Volume 2014
Economics
![Figur e 1: Urban sprawl in Europe (2000–2006). Source: [ 42 ]. shows itself startlingly clear from the jet plane window](https://thumb-us.123doks.com/thumbv2/123dok_es/6795915.832775/3.900.100.821.106.400/figur-urban-sprawl-europe-source-shows-startlingly-window.webp)