Proceedings 2019, 7, 15; doi:10.3390/ECWS-3-05829 www.mdpi.com/journal/proceedings
Proceedings
Identification of Flood-Rich and Flood-Poor Periods
by Using Annual Maximum Series of Floods
in Spain
†Luis Mediero
Universidad Politécnica de Madrid, Department of Civil Engineering: Hydraulics, Energy and Environment, ETSI Caminos, Canales y Puertos, Profesor Aranguren, 3, 28040 Madrid, Spain; [email protected]; Tel.: +34-910674376
† Presented at the 3rd International Electronic Conference on Water Sciences, 15–30 November 2018; Available online: https://ecws-3.sciforum.net.
Published: 15 November 2018
Abstract: Currently, there is general concern about the non-stationary behaviour of flood series. Consequently, several studies have been conducted to identify large-scale patterns of change in such flood series. In Spain, a general decreasing trend was found in the period 1959–2009. However, a multi-temporal trend analysis, with varying starting and ending years, showed that trend signs depended on the period considered. Flood oscillations could influence the results, especially when flood-rich and flood-poor periods are located at the beginning or end of the series. In Spain, a flood- rich period in 1950–1970 seemed to lead to the generalised decreasing trend, as it was located at the beginning of the flood series. Nevertheless, the multi-temporal test can only find potential flood- rich and flood-poor periods qualitatively. A methodology has been developed to identify statistically significant flood-rich and flood-poor periods. The expected variability of floods under the stationarity assumption is compared with the variability of floods in observed flood series. The methodology is applied to the longest streamflow series available in Spain. Seven gauging stations located in near-natural catchments, with continuous observations in the period 1942–2014, are selected. Both annual maximum and peak-over-threshold series are considered. Flood-rich and flood-poor periods in terms of flood magnitudes and the annual count of exceedances over a given threshold are identified. A flood-rich period in the beginning of the series and a flood-poor period at its end are identified in most of the selected sites. Accordingly, a flood-rich period placed at the beginning of the series, followed by a flood-poor period, influence the generalised decreasing trend in the flood series previously found in Spain.
Keywords: non-stationarity; trends in flood series; flood-rich and flood-poor periods; peak over threshold; Spain
PACS: J0101
1. Introduction
[3]. A multi- temporal test, with varying starting and ending years, showed that trend signs depended on the period considered. Series with beginning years in the period 1950–1970 usually led to significant decreasing trends.
This study aims to conduct a sounded statistical analysis to identify potential oscillations in flood series in Spain that cannot be identified by the traditional Mann–Kendall (MK) test. Temporal oscillations may drive consecutive flood-poor and -rich periods. Accordingly, the longest available flood series in near-natural catchments in Spain were selected. A methodology was developed based on the comparison between the expected variability of floods under the stationarity assumption with the variability of floods in observed flood series. Statistically significant flood-poor and -rich periods were identified.
At most of the sites, a flood-rich period was identified from the beginning of the series to 1980 and a flood-poor period at the end of the series, usually finishing in 2014.
2. Methodology
The methodology proposed in this study to identify flood-poor and -rich periods in flood series analyses the temporal oscillations in annual maximum series (AMS) of floods. AMS are usually characterised by an extremal distribution function. In Spain, a regional study concluded that the distribution function that best characterises AMS in the selected gauging stations is the generalised extreme value (GEV) distribution with the L-moments method [6]:
(1)
where x is the flood magnitude, u is the location parameter, αis the scale parameter and k is the shape parameter.
Assuming a stationary behaviour in the arrival of floods in the AMS, flood occurrences should be driven by a random process. Therefore, successive flood magnitudes in AMS should be independent. Flood-poor and -rich periods would be identified when such a stationary hypothesis is not met for a significance level α, through the following steps in each gauging station:
1. A GEV distribution function is fitted to flood magnitudes in AMS.
2. N random series of n years are generated from the GEV distribution function fitted in Step 1.
3. The mean value for each N series of n years generated in Step 2 is calculated.
4. Upper and lower thresholds are obtained from the series of N mean values obtained in Step 3,
for the confidence intervals (α/2) and (1 – α/2).
If the mean value of flood magnitudes in n consecutive years in the observed AMS was larger
than the upper threshold obtained in Step 4, a significant flood-rich period of n years was identified,
meaning that the stationary hypothesis was rejected and that the result could not be explained by
climate variability. If the mean value of flood magnitudes in n consecutive years in the observed
AMS was smaller than the lower threshold obtained in Step 4, a significant flood-poor period of n years
was identified.
In this study, N equals 100,000, n equals 10, 20 and 30 years and αequals 10%, in order to identify
flood-poor and -rich periods of n years for a significance level of 10%, with 5% in each tail. However,
only the results for 20 years are shown.
3. Case Study
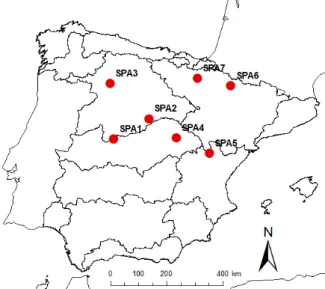
A previous study selected a set of 60 gauging stations in near-natural catchments with long flood series in Spain [3]. From such sites, the seven gauging stations with observations in the longest period 1942–2014 were selected for this study (Figure 1). No continuous longest series are available in Spain, with the reason being that, despite observations beginning in 1912, there is a gap in the period 1936–1942, due to no data being recorded either during the Spanish Civil War or for a three-year period after it ended.
Figure 1. Location of the seven gauging stations with observations in the period 1942–2014.
4. Results
The methodology was applied to the AMS of floods recorded at the seven gauging stations with observations in the period 1942–2014. A set of 100,000 synthetic series of annual maximum floods with 10, 20 and 30 years were generated. Upper and lower thresholds were obtained for a significance level of 10% (5% in each tail of the distribution). Significant flood-rich periods were identified when the
moving average in n years exceeded the upper threshold. Significant flood-poor periods were
identified when the moving average in n years was below the lower threshold. The results for the
moving average in 20 years are shown in Figure 2 and Table 1.
In six of the seven gauging stations, a significant flood-rich period was identified at the beginning of the series, in a period ending around 1980. Such a period ended a little earlier, in 1974, in the case of SPA1. In the case of SPA3, the flood-rich period was delayed, beginning in 1959 and ending in 1986.
In five of the seven gauging stations, a significant flood-poor period was identified at the end of the series. However, the beginning and ending years varied from one site to another. In four of them, the flood-poor period ended around 2014 and began between 1974 and 1991. In the case of SPA1, the flood-poor period occurred a little earlier, in 1966–1999. A flood-poor period was identified at the beginning of the series in SPA6.
Summarising, in six of the seven gauging stations, a significant flood-rich period was identified from the beginning of the series to around 1980. In addition, at five of the seven sites, a significant flood-poor period was identified at the end of the series with a varying beginning year, but most likely finishing at the ending year of the series.
Table 1. Significant flood-rich and -poor periods identified in the observed flood series.
Gauging Station Flood-Rich Periods Flood-Poor Periods SPA1 1942–1974 1966–1999 SPA2 1946–1980 1991–2014
SPA3 - -
SPA4 1945–1980 1986–2014 SPA5 1942–1981 1974–2014 SPA6 1959–1986 1942–1964 SPA7 1944–1980 1980–2007
5. Conclusions
A methodology to identify statistically significant flood-poor and -rich periods was presented. The methodology was based on the comparison between the expected variability of flood magnitudes, under an assumption of stationarity, and the actual variability of flood magnitudes in observed flood series.
Seven gauging stations, with the longest recorded flood series in the period 1942–2014, in Spain were selected. In six of the seven gauging sites, periods that did not meet the hypothesis of stationarity were found. A period with unexpected large and consecutive floods, or a flood-rich period, from the beginning of the series to around 1980 was identified at six of the seven sites. A period with unusual small consecutive floods under the hypothesis of stationarity, or flood-poor period, was identified at the end of the series in four of the seven gauging stations.
This finding could explain the generalised significant decreasing trend identified by the MK test at most of gauging stations located in Spain in [3]. A flood-rich period at the beginning of the flood series, followed by a flood-poor period at the end of the series, influence such trends. Consequently, the decreasing trend may not point to decreasing flood magnitudes in the future, though it seems to have been caused by a natural temporal oscillation in flood magnitudes, with consecutive flood-rich and -poor periods.
Funding: This research was funded by the project CGL2014-52570-R ‘Impact of climate change on the bivariate flood frequency curve’ of the Spanish Ministry of Economy and Competitiveness.
Conflicts of Interest: The author declares no conflict of interest.
Acknowledgements: The authors thank the Spanish Centre for Hydrographic Studies of CEDEX for providing
the streamflow data used in this research.
Abbreviations
The following abbreviations are used in this manuscript:
AMS Annual maximum series GEV Generalised extreme value MK Mann–Kendall
References
1. Merz, B.; Kundzewicz, Z.W.; Delgado, J.; Hundecha, Y.; Kreibich, H. Detection and attribution of changes in flood hazard and risk. In Changes in Flood Risk in Europe; Kundzewicz, Z.W., Ed.; CRC Press and IAHS Press: Wallingford, UK, 2012; pp. 435–458.
2. Mediero, L.; Kjeldsen, T.R.; Macdonald, N.; Kohnova, S.; Merz, B.; Vorogushyn, S.; Wilson, D.; Alburquerque, T.; Blöschl, G.; Bogdanowicz, E.; et al. Identification of coherent flood regions across Europe using the longest streamflow records. J. Hydrol.2015, 528, 341–360, doi:10.1016/j.jhydrol.2015.06.016. 3. Mediero, L.; Santillán, D.; Garrote, L.; Granados, A. Detection and attribution of trends in magnitude,
frequency and timing of floods in Spain. J. Hydrol.2014, 517, 1072–1088, doi:10.1016/j.jhydrol.2014.06.040. 4. Hall, J.; Arheimer, B.; Borga, M.; Brázdil, R.; Claps, P.; Kiss, A.; Kjeldsen, T.R.; Kriauciuniene, J.;
Kundzewicz, Z.W.; Lang; M., Llasat; M.C.; Macdonald, N.; et al. Understanding flood regime changes in Europe: a state-of-the-art assessment. Hydrol. Earth Syst. Sci.2014, 18, 2735–2772, doi:10.5194/hess-18-2735-2014.
5. Kundzewicz, Z.W.; Graczyk, D.; Maurer, T.; Pinskwar, I.; Radziejewski, M.; Svensson, C.; Szwed, M. Trend detection in river flow series: 1. Annual maximum flow. Hydrolog. Sci. J. 2005, 50, 797–810, doi:10.1623/hysj.2005.50.5.797.
6. Jiménez-Álvarez, A.; García Montañés, C.; Mediero Orduña, L. Análisis y selección de modelos estadísticos para el ajuste de la ley de frecuencia de caudales máximos anuales en España. Ingeniería Civil2014, 174, 5–31.