1
The effect of temperature during culture enrichment on
methanotrophic polyhydroxyalkanoate production
1
Rebeca Pérez1,2, Sara Cantera1, Sergio Bordel1,2, Pedro A. García-Encina1,2, Raúl 2
Muñoz1,2* 3
4
1-Department of Chemical Engineering and Environmental Technology, School of 5
Industrial Engineerings, Valladolid University, Prado de la Magdalena,5, Valladolid, Spain, 6
Tel. +34 983186424, Fax: 983423013. 7
2- Institute of sustainable processes, Valladolid University, Spain 8
Author for correspondence: mutora@iq.uva.es 9
2 Abstract
11
Climate change and plastic pollution are likely the most relevant environmental problems 12
of the 21st Century. Thus, one of the most promising solutions to remedy both 13
environmental problems simultaneously is the bioconversion of greenhouse gases, such as 14
methane (CH4), into bioplastics (PHAs). However, the optimization of this bioconversion 15
platform is still required to turn CH4 biotransformation into a effective and cost-16
competitive process. In this context, the research presented here aimed at elucidating the 17
best temperature culture conditions to enhance both PHA accumulation and methane 18
degradation. Six different enrichments were carried out at 25, 30 and 37ºC using different 19
inocula and methane as the only energy and carbon source. CH4 biodegradation rates, 20
specific growth rates, PHA accumulations and the community structure were characterized. 21
Higher temperatures (30 and 37ºC) increased the PHAs accumulation up to 30% regardless 22
of the inoculum. Moreover, Methylocystis became the dominant genus (~ 30% of the total 23
population) regardless of the temperature and inoculum used. This research demonstrated 24
for the first time the fundamental role of temperature in increasing both the accumulation of 25
PHAs and methane abatement during the enrichment of PHA cell-factories from methane, 26
thus enhancing the cost-effectiveness of the process. 27
Keywords: 28
Bioplastics, Greenhouse Gas Abatement, Methanotrophs, PHA, methane. 29
3 1. Introduction
31
Nowadays, the two most important environmental issues that our society is facing are 32
Climate Change and Plastic Pollution. In this sense, novel industrial strategies are 33
necessary to abate toxic greenhouse gasses (GHG) and to substitute current used plastic 34
materials without compromising present economic and industrial development. 35
Methane (CH4) is currently the second most important GHG (Desai and Harvey, 2010) and 36
its atmospheric concentration continues to rise at a yearly rate of 0.2 to 1% mainly due to 37
anthropogenic activities (agriculture, livestock, waste management and energy production) 38
which has caused growing interest, from a political and a scientific point of view, in 39
greenhouse gas abatement ((EPA), 2017). On the other hand, the massive usage of plastic 40
products and poor management of waste disposal has resulted in microplastic 41
contamination of bodies of water, which injures wildlife through entanglement or ingestion 42
of plastics and through the toxic and carcinogenic effect of some polymers. Additionally, it 43
has been demonstrated that plastics can make their way up the food chain, causing similar 44
health threats to humans. This situation has encouraged an intensive research to find and 45
produce biodegradable and non-toxic plastics or biopolymers, such as 46
polyhydroxyalkanoates (PHAs) which could definitively substitute and end the use of 47
pollutant plastics (Löhr et al., 2017; Pieja et al., 2017; Sigler, 2014). 48
The PHAs are synthesized under nutrient-limited and carbon-excess conditions by different
49
microorganisms (Pieja et al., 2017). The most common feedstock used for production of
50
PHAs are glucose and fructose, but those carbon sources have a high price, due the market
51
price of PHAs is higher (4-20 € KgPHA-1) (Koller et al., 2017). PHAs are currently
52
industrially produced by nearly thirty corporations (Cantera et al., 2019). An innovative 53
4
valorization of CH4 combined to the concomitant replacement of common plastics is the co-55
production of polyhydroxyalkanoates (PHAs) combined with the treatment of methane 56
emissions (Cal et al., 2016; Pieja et al., 2017; Strong et al., 2016). Indeed, several studies 57
have demonstrated that methanotrophs are a potential source of bioplastics, achieving PHA 58
contents ranging from 20 to 60 % (wt) using methane as feedstock (Cantera et al., 2019; 59
Pieja et al., 2017). Methanotrophs are divided into two different groups according to the
60
pathway for carbon assimilation a) type I (-proteobacteria) use the ribulose
61
monophosphate (RuMP) pathway or b) type II (- proteobacteria) use of the serine
62
pathway. Most of the studies reporting PHAs production using methanotrophic bacteria
63
have been conducted with α-proteobacterial methanotrophs, since PHAs synthesis supposed
64
to be linked with the serine cycle. Thus, acetyl-CoA molecules produced in the serine cycle
65
are transformed into PHAs via reactions catalyzed by the enzymes β-ketothiolase
66
(phaA),acetoacetyl-CoA reductase (phaB), and PHAs synthase (phaC) (Cantera et al.,
67
2019). Overall, type II methanotrophic bacteria such as Methylocystis, Methylosinus and
68
Methylocella have been considered the main methanotrophic PHA producing genera under 69
nutrient-limited conditions (i.e N-, P- or Mg-limitation) (García-Pérez et al., 2018; Helm et
70
al., 2008; Myung et al., 2017; Rostkowski et al., 2013; Sundstrom and Criddle, 2015;
71
Wendlandt et al., 2001; Zhang et al., 2017).
72
However, the cost-effective implementation of current biotechnologies for the 73
biotransformation of CH4 into bioplastics is still limited by the limited understanding of 74
those factors that determine the selective enrichment of high-performance PHA producing 75
methanotrophs.In this sense, different operational parameters such as pH, CH4/O2 ratio, or
76
the concentration of sodium, copper or citrate have been reported as key strategies for the
5
enrichment of type II methanotrophs with the ability to synthetize PHA (Pieja et al., 2011;
78
Scheutz et al., 2009; Semrau et al., 2013). However, there is still a need for studies 79
assessing the effect of environmental factors during culture enrichment of PHA producing 80
methanotrophs. The use of an optimal temperature and the inoculum source have been 81
reported as key strategies for the enrichment of microorganisms with the ability to 82
synthetize PHAs using waste water and sugars as carbon sources (De Grazia et al., 2017). 83
Thus, those inocula that favor the enrichment of type II methanotrophs, as well as the set 84
temperature during enrichment could enhance this innovative biotechnology based on the 85
transformation of methane into bioplastics. In this sense, Sphagnum mosses, which occur 86
mainly in peat bogs, conifer forests and moist tundra areas, are described as the bryophytes 87
with the highest richness of type II methanotrophs (Kip et al., 2011; Stępniewska and 88
Kuźniar, 2014). Indeed, the extremophile environments that Sphagnum mosses inhabit, 89
combined with the inherent presence of type II methanotrophs in their outer cortex, 90
suggests their potential as a novel source of effective PHA-accumulating microorganisms 91
(Kadouri et al., 2003; Ruiz et al., 2001; Zhao et al., 2007). Similarly, the stress caused on 92
the metabolism of type II methanotrophs by an exposure to high temperatures might 93
mediate an increase in PHA synthesis. 94
The study presented here aimed at systematically elucidating the influence of temperature 95
(25ºC, 30ºC, 37ºC and 45ºC) during culture enrichment on the PHA synthetizing capacity, 96
kinetics and stoichiometric characteristics, and population structure of microbial 97
communities enriched using Sphagnum peat moss and a mixture of Sphagnum and 98
activated sludge as inoculum. 99
2. Materials and Methods 100
2.1. Mineral salt medium and inoculum
6
The MSM (a modified NMS medium Whittenbury et al., (1970)) was composed of (g L−1): 102
2.25 NaNO3, 0.1 MgSO4·7H2O, 0.02 CaCl2·2H2O, 0.68 KH2PO4, 6.14 Na2HPO4·12H2O, 103
1.3 × 10⁻³ FeSO4·7H2O, 3.5 × 10 −3
MnCl2·4H2O, 1.5 × 10 −3
ZnSO4·7H2O, 0.04 × 10 −3 104
Na2MoO4·2H2O, 0.04 × 10⁻³ CuSO4·5H2O, 0.32 × 10⁻³ CoCl2, and 0.2 × 10⁻³ H3BO3. 105
Moreover, vitamins (biotin, nicotinamid, p.aminobenzoic acid and panthotenic acid) were
106
added to stimulate those methanotrophs that have problems to grow. All chemicals needed 107
for MSM preparation were purchased from PANREAC (Barcelona, Spain), while CH4 (≥ 108
99.5%) and O2 (≥ 99.0%) were obtained from Abelló Linde S.A. (Barcelona, Spain). Poly 109
[(R)-3-hydroxybutyric acid-co-(R)-3-hydroxyvaleric acid] (molar ratio 88/12, ≥ 99.99%)
110
was purchased from Sigma-Aldrich® (St. Louis, MO, USA).
111
Fresh activated sludge from a denitrification-nitrification wastewater treatment plant 112
(Valladolid, Spain) (López et al., 2018b) and Sphagnum peat moss from Plantas
113
Carnívoras, (Madrid, Spain) were used as inocula for the enrichment of microorganisms 114
able to degrade CH4 and accumulate PHA. The Sphagnum peat moss was diluted 10 times 115
in MSM prior inoculation. 116
117
2.2. Culture enrichment at different temperatures
118
A preliminary enrichment was performed batch-wise for 19 days at 25ºC in 1250 mL gas-119
tight bottles initially containing 190 mL of MSM and 20 ml of diluted Sphagnum inoculum 120
(from now on referred as S) or 190 mL of MSM and 20 ml of diluted Sphagnum + activated 121
sludge (50%/50%) (from now on referred as M). The initial mass of inoculum in each pre-122
enrichment was 50g/L. The bottles were closed with butyl septa and plastic caps, and the 123
headspace was flushed with pure O2 for 15 min in order to eliminate the previous air 124
7
and the bottles were incubated in an orbital shaker MaxQ 4000 fromThermo Scientific, at 126
200 rpm. Aliquots of 10 ml of the final enrichments S and M at 25ºC were transferred to 127
1250 mL gas-tight bottles prepared in duplicate as above described. Five enrichment cycles 128
at 25, 30, 37 and 45ºC (each cycle involving a total CH4 consumption and a complete 129
headspace renewal) were carried out under orbital shaking at 200 rpm in duplicate. The
130
temperature range of these experiments was chosen according to the optimum growth
131
temperature of methanotrophic bacteria that are in general mesophile (Hanson and Hanson,
132
1996). No replacement of the MSM was conducted along the cycles, which entailed that the 133
fifth cycle occurred under nitrogen limiting conditions. This procedure was designed to 134
carry out an enrichment process under high biomass concentrations and low CH4 aqueous 135
concentrations (30 times lower than in the headspace according to the Henry´s law constant
136
for CH4 of 30 at 25ºC (Sander, 2014)) in order to favor the growth of methanotrophs with 137
low apparent Km values. In addition, a second enrichment in fresh MSM inoculated with 20 138
ml of the final cultivation broth resulting from the 5th-cycle enrichment was conducted in 139
duplicate at the different temperatures tested. The concentrations of CH4, O2 and CO2 in the 140
headspace and of TSS in the cultivation broth were periodically monitored in all 141
enrichment experiments. 142
143
2.3. Influence of the temperature on CH4 biodegradation kinetics
144
The kinetics study was performed in duplicate, batch-wise in gas-tight bottles (1250 mL) 145
initially containing 200 mL of MSM and 7.3 mg of fresh biomass (obtained in the late 146
exponential growth phase from a further culture inoculated with the final culture resulting 147
from the second enrichments conducted in section 2.2). The serum bottles were 148
8
15 min. CH4 was added to the headspace with gas tight syringes up to a final concentration 150
of 194 ± 7 g m-3. The serum bottles were then incubated in an orbital shaker at 25ºC, 30ºC 151
or 37ºC and 200 rpm until methane degradation. CH4, O2 and CO2 concentrations were 152
periodically determined using a GC-TCD. In the case of the cell biomass it was measured 153
as TSS drawing 3 ml from the cultivation broth. The specific growth rate (µ) was calculated 154
from the slope of the logarithm of the biomass concentration vs. time. The specific CH4 155
biodegradation rates were estimated from the ratio of the specific growth rates and the 156
observed biomass yields in each experiment. The concentration of total nitrogen (TN) in the 157
cultivation broth was also recorded. Neither significant CH4 biodegradation nor biomass 158
growth was recorded at 45ºC. 159
160
2.4. Influence of the temperature on PHAs accumulation under N-limiting conditions 161
The study was performed in duplicate batch-wise in 1250 mL gas-tight bottles initially 162
containing 200 mL of N-free MSM and fresh biomass from the kinetics test (previously 163
centrifuged and resuspended in N-free MSM). The bottles were closed with butyl septa and 164
plastic caps, flushed with O2 for 15 min and CH4 was then supplied at an initial headspace 165
concentration of 177 ± 7 g m-3. The bottles were incubated in an orbital shaker) at 25ºC, 166
30ºC or 37ºC and 200 rpm until complete CH4 depletion. In addition, fresh biomass 167
enriched at 25 ºC was cultivated under nitrogen starvation conditions at 25, 30 and 37ºC, 168
respectively, to elucidate the role of temperature during the accumulation phase. In this test 169
series, the headspace concentrations of CH4, O2 and CO2, biomass concentration (measured 170
as TSS) in the cultivation broth and the PHB content of the biomass were periodically 171
monitored. 172
9
2.5. Analytical procedures
174
CH4, O2 and CO2 gas concentrations were determined using a Bruker 430 GC-TCD (Palo 175
Alto, USA) endowed with a Molsieve 5A column (15 m × 0.53 µm × 15 µm) and a CP-176
PoraBOND Q column (25 m × 0.53 µm × 10 µm). The oven, injector and detector 177
temperatures were 45 °C, 150 °C and 200 °C, respectively. Helium was the gas carrier at a 178
flow rate of 13.7 mL min−1. Cell growth was measured as Total Suspended Solids (TSS) 179
according to Standards Methods (American Public Health Association (APHA) et al., 180
2005). TN concentration was determined following sample filtration (0.45 µm) in a TOC-181
VCSH attached to a TNM-1 module (Shimadzu, Japan). The bacterial PHB content was 182
measured using a GC–MS (GC System 7820A MSD 5977E, Agilent Technologies, Santa 183
Clara, USA) equipped with a DB-wax column (30 m × 250 µm × 0.25 µm) according to 184
(Frutos et al., 2017). 185
186
2.6-DNA extraction, Illumina library preparation and 16S rRNA gene sequencing 187
Amplicon sequencing was developed targeting the 16S V3 and V4 regions (464bp, 188
Escherichia coli based coordinates) with the bacterial primers S-D-Bact-0341-b-S-17 and 189
S-D-Bact-0785-a- A-21, forward and reverse, respectively according to (Klindworth et al., 190
2013). Universal primers were used instead of specific primers for methanotrophic bacteria
191
with the aim of having a broad view of the bacterial population that could be implied in
192
PHA production. Illumina adapter overhang nucleotide sequences were added to the gene-193
specific sequences according to (López et al., 2018b). Library construction was carried out 194
using the Nextera XT DNA Sample Preparation Kit (Illumina, San Diego, CA). Libraries 195
10
San Diego, CA) was used as performance control. Samples containing indexed amplicons 197
were loaded onto the MiSeq reagent cartridge for automated cluster generation paired-end 198
sequencing with a 2x300pb paired-end run (MiSeq Reagent kit v3 (MS-102-3001)) 199
according to manufacturer’s instructions (Illumina). The amplicon sequencing analysis was 200
carried by the Foundation for the Promotion of Health and Biomedical Research of 201
Valencia Region (FISABIO, Spain). 202
203
2.7-16S rDNA-based taxonomic analysis
204
Only reads with quality value scores ≥20 in more than 99% of the sequence after 205
demultiplexing and without ambiguous base calls were further analyzed. Quality analyses, 206
paired-end reads junction and chimera search were carried out using the prinseq-lite 207
program (Schmieder and Edwards, 2011), the FLASH program (Magoc and Salzberg, 208
2011) and the USEARCH program (Edgar, 2010). Taxonomic assignments were then 209
conducted using the RDP- Classifier from the Ribosomal Database Project (Cole et al., 210
2009; Wang et al., 2007). Simpson and Shannon indices were determined using the Vegan 211
library version 2.3e1 (Oksanen et al., 2015). The Krona tool was used to represent relative 212
abundances and confidences within the complex hierarchies of metagenomics 213
classifications (Ondov et al., 2011). Nucleotide sequence dataset obtained in this study has 214
been submitted to NCBI Sequence Read Archive with the bioproject accession 215
PRJNA521405 (https://trace.ncbi.nlm.nih.gov/Traces/study/?acc=PRJNA521405&go=go).
216
11 2.8-Statistical Analyses
218
All analyses were performed using biomass obtained from two biological replicas for each 219
condition. The specific growth rates, biomass yields, specific CH4 biodegradation rates, 220
PHAs contents and PHAs produced per unit of CH4 consumed, were compared pairwise 221
using a single cued t-test assuming equal variance. The differences were considered 222
statistically significant for p-values below 0.05. The symbols “*”, “**” and “***” were 223
used to indicate values below 0.05, 0.01 and 0.001, respectively, in the figures. In the 224
particular cases where two conditions were not significantly different from each other, their 225
values were grouped and a t-test was performed compared to a third condition. Vegan 226
(Oksanen et al., 2015) and stats packages in R (Sasaki et al., 2005) were used for the 227
statistical analyses of the metagenomics data. 228
229
3. Theoretical Framework 230
3.1. Stoichiometry of PHA production
231
PHA production using methane as the sole carbon and energy source requires a biomass 232
formation step under nitrogen excess conditions followed by a PHA accumulation step 233
under nitrogen limiting conditions. This two-stage process can be implemented in two 234
separate units (Figure S1). The CH4 and nitrogen required to produce a unit of PHA 235
(disregarding CH4 maintenance consumption, which is small compared to its consumption 236
associated biomass and PHA formation) will depend on the biomass yield on CH4 (YX/CH4), 237
the potential PHA content accumulated per unit of biomass (FPHA=mPHA/X; X being the 238
initial biomass without PHA accumulation), the PHA yield on CH4 (YPHA/CH4) and the 239
fraction of nitrogen contained in the biomass before PHA accumulation (FN). Thus, the 240
production of one unit of PHA requires the previous formation of an amount of biomass X
12
equal to 1/FPHA, which itself requires a CH4 supply equal to X/YX/CH4 in the first unit (under 242
nitrogen excess). On the other hand, the amount of CH4 to be supplied to the second unit 243
(under nitrogen limiting conditions) could be estimated as 1/YPHA/CH4. Therefore, the total 244
methane supplies necessary to obtain a mass unit of PHA (mCH4) can be calculated as 245
1/(FPHAYX/CH4) +1/YPHA/CH4. Likewise, the nitrogen required per unit of PHA mNis equal to 246
FN/(FPHA). 247
3.2. Biodegradation kinetics and gas-liquid CH4 transfer 248
Both the biomass formation and PHA accumulation units require the transfer of CH4 (and 249
oxygen) from the gas emission to the methanotrophic cultivation broth. Under steady state 250
operation, the rate of CH4 and O2 mass transfer per unit of reactor volume will be equal to 251
the volumetric rate of microbial consumption of these substrates. The rate of CH4 mass 252
transport per volume of reactor (RCH4) can be described by the following equation (Bordel 253
et al., 2008) (Eq. [1]): 254
𝑅𝐶𝐻4=𝑄𝑔
𝑉 𝛽𝐶𝐻4(𝐶𝑔𝑖𝑛− 𝐻𝐶𝐻4𝐶𝐿) [1]
255
Where Cgin and HCH4 stand for the inlet concentration and Henry’s law constant of CH4, V
256
the bioreactor volume, Qg the gas flow rate and CL the CH4 aqueous concentration in the 257
cultivation broth. The parameter βCH4 ranges between 0 and 1, and depends mainly on the 258
gas-liquid interface area in the reactor as well as the transport properties of the system 259
(Bordel et al., 2008) (Eq. [2]). 260
𝛽𝐶𝐻4 = 1 − 𝑒𝑥𝑝 (−𝑘𝐿𝑎𝑉
𝐻𝐶𝐻4𝑄𝑔) [2]
261
Where kLa represents the volumetric mass transfer coefficient of CH4 in the bioreactor. The 262
value of the parameter βCH4 is equal to the maximum fraction of CH4 transferrable from the 263
13
the biological parameters of the microbial community present in the cultivation broth. 265
Therefore, it is desirable to operate with βCH4 values close to 1. However, low βCH4 values 266
are typically recorded for gas substrates with a low aqueous solubility such as CH4 (e.g the 267
dimensionless Henry constant HCH4 is equal to 33.5 at 30 oC (Duan et al., 1992)), which 268
would ultimately limit the performance of PHA production based on CH4. In this context, 269
several high mass transfer performance bioreactors such as two-phase partitioning, Taylor 270
flow or internal gas recycling bioreactors have been engineered to overcome these 271
limitations (Bordel et al., 2010; García-Pérez et al., 2018; Hernández et al., 2011). 272
However, the kinetic parameters of the methanotrophic community influence the CH4 mass 273
transport rate since microbial kinetics ultimately determine the steady state liquid 274
concentration (CL). The specific biomass growth rate of methanotrophs () can be 275
accurately described using the Monod´s equation (Eq. [3]): 276
𝜇 = 𝜇𝑚𝑎𝑥 𝐶𝐿
𝐶𝐿+𝐾 [3]
277
Where µmax stands for the maximum specific growth rate and K the Monod half-saturation 278
constant. The specific biomass growth rate in the biomass formation unit under steady state 279
is equal to the dilution rate D (= volumetric liquid flow rate supplied to the reactor divided 280
by the reactor volume). Hence, the CH4 aqueous concentration, CL, can be determined as a 281
function of the dilution rate (Eq. [4]). 282
𝐶𝐿=𝜇𝑚𝑎𝑥𝐷𝐾−𝐷 [4]
283
The Monod constant K is equal to the concentration at which the cell growth rate is equal to 284
half its maximum value (µmax). The value of K in methanotrophic cultures typically ranges 285
between 2 and 12 µM. On the other hand, the maximum specific growth rate sets a 286
14
order of magnitude lower than this critical dilution rate in order to cope with increases in 288
the necessary liquid flow to be processed and to avoid biomass wash-out. Based on 289
equation [1], the fraction (FCH4) of CH4 in the gas emission transferred to the cultivation 290
broth can be estimated as follows (Eq. [5]): 291
𝐹𝐶𝐻4= 𝛽𝐶𝐻4𝐶𝑔𝑖𝑛−𝐻𝐶𝐻4𝐶𝐿
𝐶𝑔𝑖𝑛 [5]
292
In this context, while the parameter βCH4 depends only on the gas-liquid mass transfer 293
capacity of the bioreactor, CL is governed by the liquid dilution rate and the kinetics 294
parameters of the microbial community. Therefore, the fraction FCH4 can be regarded as the 295
product of a transport limited term and a biologically limited fraction. This biologically 296
limited term is close to 1 for the typical kinetics and operating parameters prevailing in CH4 297
abatement bioreactors, which entails that the impact of the maximum specific biomass 298
growth rate on the overall process performance is small. 299
300
4. Results 301
4.1. Influence of the enrichment temperature on the specific growth rates
302
A decrease in the specific growth rate of the microbial communities was observed when 303
increasing the selected temperature in the enrichments derived from Sphagnum alone at a
304
significant level of p ≤ 0.05 (Figure 1). Thus, average specific growth rates of 0.05±0.001 305
h-1, 0.04±0.004 h-1 and 0.02±0.004 h-1 were observed at 25, 30 and 37ºC, respectively, in S 306
enrichments. However, the specific growth rates of the microbial communities enriched 307
from the mixed inoculum (M) increased from 0.02±0.002 h-1 at 25oC to 0.033±0.0009 h-1 at 308
15
30oC differed strongly (0.022 and 0.042 h-1), resulting in no statistical differences with the 310
M enrichments at 25 and 37ºC. 311
< Figure 1>
312
4.2. Influence of the enrichment temperature on the specific CH4 degradation rate 313
No significant difference was observed between the specific CH4 biodegradation rates of 314
the biomass enriched from Sphagnum at 25 and 30 oC (65.3 ±5.1, 79.5 ±7.9 mg-CH4 h-1 g-315
biomass-1, respectively; error intervals are standard errors with 2 samples) (Figure 2). 316
However, a significantly lower specific CH4 biodegradation rate was observed at 37oC 317
(49.7 ±3.7 mg-CH4 h-1 g-biomass-1), which correlated with the lower µ recorded at this 318
temperature. On the other hand, the biomass enriched from the mixed inoculum (M) 319
exhibited lower specific CH4 biodegradation rates at 25 and 30oC (48.2 ±2.5 and 51.7 ±1.9 320
mg-CH4 h-1 g-biomass-1, respectively) than at 37oC (78.9 ±5.6 mg CH4 h-1 g biomass-1). The 321
differences obtained between the specific CH4 biodegradation rates of S and M confirmed 322
that the experiments were conducted under non-mass transfer limiting conditions. 323
<Figure 2>
324
325
4.3. Influence of the enrichment temperature on PHAs content
326
The content of biopolymers accumulated by the microorganisms of both inocula increased 327
with temperature. Polyhydroxybutyrate was the dominant PHA in all the samples analysed. 328
The biomass enriched at 30 and 37oC was able to accumulate over 30% of PHA inside the
329
cells (35.1 ± 0.4% and 33.1± 1.3% in S at 30ºC and 37ºC, respectively, and 28.4 ± 1.1% 330
and 34.1± 1.3% in M at 30ºC and 37ºC, respectively) under nitrogen limiting conditions, 331
16
respectively, at 25ºC (Figure 3). The mass of PHA per unit of CH4 consumed was also 333
obtained from experiments conducted under N limiting conditions. Interestingly, no 334
significant difference was observed among the 6 microbial communities enriched, with 335
average values of 0.22 ± 0.05 g-PHA (g-CH4)-1. In this context, this value has been 336
previously reported to be 0.57 g-PHA (g-CH4)-1 for pure cultures of Methylocystis hirsuta , 337
which is a high-performance PHA accumulating methanotrophic strain (López et al., 338
2018a). Similarly, Chidambarampadmavathy et al. (2017) , using a consortium enriched
339
from landfill soil and dominated by Methylosarcina sp., obtained maximal PHB contents of
340
25 mg g biomass-1 at 40% of CH4 in air. Zhang et al., 2018 reported accumulations of
341
~45% of PHB in a mixed culture enriched from sewage sludge under N limitation and with
342
Cu, whereas the absence of Cu diminished PHB synthesis (12%–18%).”
343
344
<Figure 3>
345
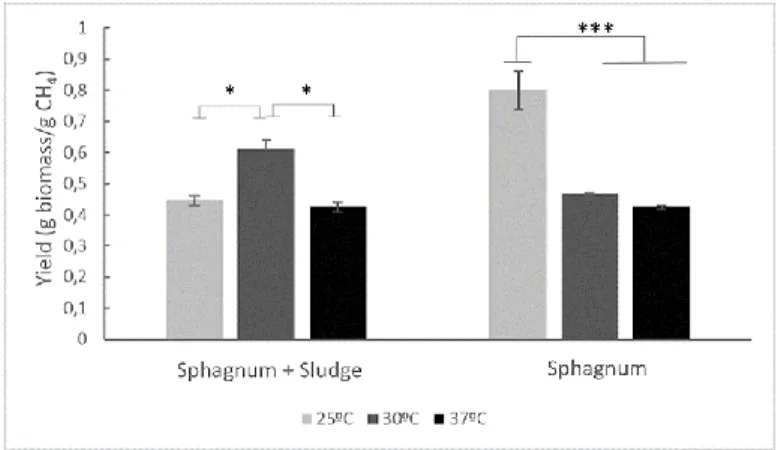
4.4 Influence of the enrichment temperature on biomass yield
346
The biomass enriched from Sphagnum at 25oC showed a yield on CH4 almost twice as high 347
as the biomass enriched from this inoculum source at the two other temperatures (Figure 4). 348
This higher yield was also correlated to the higher specific growth rate observed at this 349
temperature. As discussed later, this higher yield might be somehow related to the higher 350
population diversity observed in this sample. The biomass derived from the mixed 351
inoculum at 25ºC did not show yields higher than that enriched at 30 and 37ºC. In contrast, 352
the higher yield on CH4 was recorded in the biomass enriched at 30ºC. 353
<Figure 4>
354
17
4.5. Selection of optimal enrichment conditions for PHA accumulation
356
From an industrial perspective, this study aimed at elucidating the optimal enrichment 357
temperature and inoculum source that potentially result in the most effective usage of raw 358
materials (in this case CH4 and N). Table 1 depicts the CH4 and nitrogen required to 359
produce a unit of PHA as a function of the enrichment temperature and inoculum source. 360
The most cost-effective biomass for optimal PHA production would be the enrichment 361
from Sphagnum at 30oC. This biomass required the lowest CH4 input (10.5±1.4 g CH4 g 362
PHA-1; equal to that required by the biomass obtained at 30oC from the mixed inoculum) 363
and also the lowest nitrogen input (0.2 g N g PHA-1). 364
<Table 1>
365
366
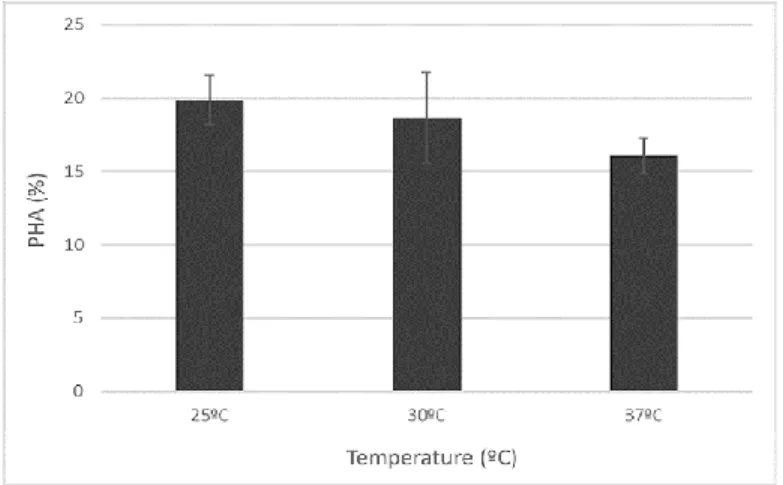
4.6. Influence of the temperature during the accumulation phase on PHA content
367
The results herein obtained showed that, independently of the inoculum source, the biomass 368
enriched at 30 and 37oC led to the highest PHA yields. In the previous experiments in 369
literature, biomass enrichment and PHA synthesis (under nitrogen limitation) were carried 370
out at a constant temperature (García-Pérez et al., 2018; López et al., 2018a, 2018b; Myung
371
et al., 2017; Zhang et al., 2017). In order to elucidate whether these higher PHA yields were 372
the result of the temperature during the enrichment or accumulation phase, the biomass 373
enriched at 25oC was supplied with CH4 under nitrogen starvation conditions at 25, 30 and 374
37oC. No increase in the PHA content of the biomass enriched at 25ºC was observed at the 375
two highest temperatures. Indeed, a slight decrease (no statistically significant) was found 376
at 30 and 37ºC (Figure 5). 377
<Figure 5> 378
18
4.7. Influence of the enrichment temperature on the structure of the microbial communities
380
The enrichment process (pre-enrichment + 5 growth stages till complete N depletion + 2 381
growth stages + 1 PHA accumulation stage) resulted in the dominance of the genus 382
Methylocystis (with percentages close to 30%, Figure S2) in the enriched communities 383
regardless of the inoculum source and temperatures. Members of this genus, which was 384
almost absent in the initial inocula, are capable of synthetizing PHA under nitrogen 385
deprivation conditions (López et al., 2018a). The biomass enriched from Sphagnum
386
contained a low number of other methanotrophs and methylotrophs (~1% of 387
Methylobacterium at 30 and 37oC, and 2% of Methylophylus at 25oC). On the other hand, 388
the biomass enriched from the mixed Sphagnum and activated sludge inoculum contained 389
significant amounts of methylotrophs such as Methylophilus (17% of the community 390
enriched at 25oC), Methylobacterium (5% of the community enriched at 30oC) and 391
methanotrophs such as Methyloparacocus (9% of the community enriched at 30oC). These 392
methanotrophs and methylotrophs different from the genus Methylocystis were less 393
abundant in the community enriched at 37oC (1% of Methylobacterium). The results here 394
obtained revealed that temperature was a strong selective pressure for the enrichment of 395
PHA accumulating bacteria regardless of the inoculum. 396
None of the characteristics of the microbial communities enriched (specific growth rate, 397
PHA accumulation etc.) seemed to be explained by changes in the overall microbial 398
composition. For example, the enrichments conducted at 30 and 37ºC, which resulted in 399
higher PHA accumulations, did not contain a higher percentage of Methylocystis than those 400
conducted at 25ºC. 401
19
5.1. Effect of the enrichment conditions on the microbial community profile
403
This study aimed at assessing both the feasibility of enriching PHA accumulating 404
methanotrophic consortia from Sphagnum mosses-based inocula (based on their high 405
inherent abundance in type II methanotrophs) and the influence of the temperature on the 406
characteristics of the communities enriched. The prolonged exposure of the inocula to 407
methane as the only carbon and energy source (following the described enrichment 408
protocol) allowed to enrich microbial consortia where the genus Methylocystis was the most 409
abundant (which represented approx. 30% of the total microbial population) regardless of 410
the enrichment temperature. Methylocystis are known to accumulate PHA, however no 411
selective pressure aiming to favour PHA accumulating organisms (such as alternate cycles 412
of nitrogen starvation) was specifically imposed during the enrichment process. The 413
specific growth rates of the consortia enriched were up to two folds higher than those 414
previously reported for pure cultures of Methylocystis hirsuta (López et al., 2018a) (0.021 415
h-1), likely due to the symbiotic effects with other microbial populations. In this context, the 416
purer a culture is, the higher are the restrictions to grow under environmental stress factors, 417
while a higher population richness and diversity promotes higher resilience and therefore, 418
better bio-product recovery (Cabrol et al., 2012). Moreover, adaptive laboratory evolution 419
could be also carried out to gain insights into the adaptive changes that experience 420
microbial populations during long-term selection: better PHA productivity and higher 421
methane degradation rates (Dragosits and Mattanovich, 2013). 422
423
5.2. Specific growth rate and microbial CH4 bioconversion 424
In addition, the theoretical framework developed in section 3 reveals that a microbial 425
20
study) treating a gas emissions with typical CH4 inlet concentration of 6% (equivalent to an 427
equilibrium concentration of 0.0024 M in the aqueous phase) will eventually support a CH4 428
removal of 99.2% in the bioreactor (under no mass transfer limitations), while a biomass 429
with a maximum specific growth rate of 0.05 h-1 (the maximum recorded in this study) will 430
support a potential CH4 removal of 99.7%. These estimations clearly show that the 431
maximum specific growth rate of the microbial community enriched does not represent a 432
key parameter in suspended-growth CH4 bioconversion processes operated under 433
continuous mode. The scenario would be different if the process was performed batch-wise, 434
where higher maximum specific growth rates would result in shorter production times. 435
The biomass yields on methane here recorded were of the same order as those of pure 436
cultures of Methylocystis, with the exception of the consortium enriched from the inoculum 437
S at 25ºC, which showed a biomass yield almost twice as large as that of a pure 438
Methylocystis hirsuta cultures. It can be hypothesized that this unusually high yield 439
(YX/CH4 =0.8) was supported by the high microbial diversity of this particular enrichment 440
(H = 2.84). A weak correlation between the biomass yield and the microbial diversity was 441
also observed (R=0.764 and a p-value=0.109), which has been previously described in 442
literature (Louis et al., 2016). 443
444
5.3 Effect of temperature on the enrichment conditions and on PHA accumulation
445
Since temperature has been determined as an important factor that modifies PHA
446
accumulation in other heterotrophic bacteria (Myshkina et al., 2008), this study aimed to
447
assess the optimal temperature conditions to increase the production of PHA using type II
448
21
significantly higher amounts of PHA under nitrogen starvation (30% of the total microbial 450
biomass) than those enriched at 25ºC. These values were low in comparison to the PHA
451
contents of 40-47% (wt) reported by Zhang et al. 2018. This result was probably due to the
452
high copper concentration used for enrichment by Zhang et al. 2018 which increased PHA
453
accumulation by a factor of 2.5. Concentrations of copper characteristic of urban waste
454
water treatment plants were used in this study to avoid the effect of additional variables on
455
the results obtained not related to temperature (Zhang et., 2018). Nevertheless, the fact that 456
only 30% of the DNA of the enriched consortia corresponded to bacteria of the genus 457
Methylocystis (the only described PHA accumulating organism identified in these 458
consortia) suggested that the strains of this genus in these specific enrichments could 459
eventually contain up to 70% of PHA. In this regard, under nutrient-limited conditions 460
Methylocystis, Methylosinus and Methylocella, which are considered the main 461
methanotrophic PHA producers to date, are able to achieve PHA accumulations ranging 462
from 20 to 50% (wt) (García-Pérez et al., 2018; Pieja et al., 2012; Zhang et al., 2017) 463
values that are lower than the ones suggest by previous research. 464
The fact that the results obtained for the PHA content of the microbial communities 465
enriched at different temperatures were just due to the temperature prevailing during the 466
accumulation phase was discarded by performing PHA accumulation experiments at 25, 30 467
and 37ºC with biomass enriched from Sphagnum at 25ºC. No enhancement in PHA 468
accumulation was observed at 30 and 37ºC, which confirmed that culture enrichment at 469
higher temperatures plays a key role on the selection of more efficient PHA accumulators. 470
However, the mechanisms underlying the superior accumulation of PHA in communities 471
enriched at higher temperatures remains unknown. In this context, it has been speculated 472
22
triggers PHA accumulation. However, only trace levels of PHA were observed at 30 or 474
37ºC in cultures grown under nitrogen sufficient conditions and there was not a direct 475
influence of temperature on PHA accumulation under nitrogen limiting conditions during 476
the accumulation phase. At this point it can be speculated that some molecular mechanisms 477
involved in heat shock resistance might also enable methanotrophs to accumulate higher 478
PHA contents. Finally, it should be highlighted that lower temperatures increase CH4 mass 479
transfer from the gas to the microbial community as a result of a decrease in the Henry’s 480
law constant, which directly impact on the gas-liquid concentration gradient and could 481
influence the specific growth rates and PHA content of the biomass. However, the 482
theoretically enhanced CH4 mass transfer at lower temperatures did not increase the PHA 483
content of the microbial communities enriched. 484
485
6. Conclusions 486
This study confirmed the key role that the enrichment temperature plays on microbial PHA 487
production from CH4, culture enrichment at high temperatures (30 and 37ºC) resulted in a 488
superior PHA accumulation compared to the biomass enriched at 25ºC. This finding 489
suggests that temperature has an important in PHA accumulation and could enhance the 490
implementation of PHA cell factories. 491
492
7. Acknowledgements 493
This research was funded by the Spanish Ministry of Economy and Competitiveness, the 494
European FEDER program and the European Commission (CTM2015-73228-JIN, H2020-495
23
the regional government of Castilla y León is also gratefully acknowledged (UIC71). 497
Declarations of interest: none. 498
499
8. References 500
(EPA), E.P.A., 2017. Green Enterprise - Environmental Protection Agency (EPA. Environ. 501
Prot. Agency. 502
American Public Health Association (APHA), American Water Works Association, Water 503
Environment Federation, 2005. Standard Methods for the Examination of Water and 504
Wastewater 21st Edition, Standard Methods. 505
Bordel, S., Hernandez, M., Villaverde, S., Muñoz, R., 2010. Modelling gas–liquid VOCs 506
transport in two-liquid phase partitioning bioreactors. Int. J. Heat Mass Transf. 53, 507
1139–1145. https://doi.org/10.1016/j.ijheatmasstransfer.2009.10.042 508
Bordel, S., Muñoz, R., Díaz, L.F., Villaverde, S., 2008. Mechanistic model for evaluating 509
the performance of suspended growth bioreactors for the off-gas treatment of VOCs. 510
Biochem. Eng. J. 38, 395–405. https://doi.org/10.1016/j.bej.2007.08.004 511
Cabrol, L., Malhautier, L., Poly, F., Roux, X. Le, Lepeuple, A.-S., Fanlo, J.-L., 2012. 512
Resistance and resilience of removal efficiency and bacterial community structure of 513
gas biofilters exposed to repeated shock loads. Bioresour. Technol. 123, 548–557. 514
https://doi.org/10.1016/j.biortech.2012.07.033 515
Cal, A.J., Sikkema, W.D., Ponce, M.I., Franqui-Villanueva, D., Riiff, T.J., Orts, W.J., 516
Pieja, A.J., Lee, C.C., 2016. Methanotrophic production of polyhydroxybutyrate-co-517
hydroxyvalerate with high hydroxyvalerate content. Int. J. Biol. Macromol. 87, 302– 518
307. https://doi.org/10.1016/j.ijbiomac.2016.02.056 519
Cantera, S., Bordel, S., Lebrero, R., Gancedo, J., García-Encina, P.A., Muñoz, R., 2019. 520
Bio-conversion of methane into high profit margin compounds: an innovative, 521
environmentally friendly and cost-effective platform for methane abatement. World J. 522
Microbiol. Biotechnol. 35, 16. https://doi.org/10.1007/s11274-018-2587-4 523
Chidambarampadmavathy, K., Karthikeyan, O.P., Huerlimann, R., Maes, G.E., Heimann, 524
K., 2017. Response of mixed methanotrophic consortia to different methane to oxygen 525
24
Cole, J.R., Wang, Q., Cardenas, E., Fish, J., Chai, B., Farris, R.J., Kulam-Syed-Mohideen, 527
A.S., McGarrell, D.M., Marsh, T., Garrity, G.M., Tiedje, J.M., 2009. The Ribosomal 528
Database Project: improved alignments and new tools for rRNA analysis. Nucleic 529
Acids Res. 37, D141–D145. https://doi.org/10.1093/nar/gkn879 530
De Grazia, G., Quadri, L., Majone, M., Morgan-Sagastume, F., Werker, A., 2017. Influence 531
of temperature on mixed microbial culture polyhydroxyalkanoate production while 532
treating a starch industry wastewater. J. Environ. Chem. Eng. 5, 5067–5075. 533
https://doi.org/10.1016/j.jece.2017.09.041 534
Desai, M., Harvey, R.P., 2010. Executive summary. New Dir. Youth Dev. 2010, 5–11. 535
https://doi.org/10.1002/yd.370 536
Dragosits, M., Mattanovich, D., 2013. Adaptive laboratory evolution – principles and 537
applications for biotechnology. Microb. Cell Fact. 12, 64. 538
https://doi.org/10.1186/1475-2859-12-64 539
Duan, Z., Møller, N., Greenberg, J., Weare, J.H., 1992. The prediction of methane 540
solubility in natural waters to high ionic strength from 0 to 250°C and from 0 to 1600 541
bar. Geochim. Cosmochim. Acta 56, 1451–1460. https://doi.org/10.1016/0016-542
7037(92)90215-5 543
Edgar, R.C., 2010. Search and clustering orders of magnitude faster than BLAST. 544
Bioinformatics 26, 2460–2461. https://doi.org/10.1093/bioinformatics/btq461 545
Frutos, O.D., Cortes, I., Cantera, S., Arnaiz, E., Lebrero, R., Muñoz, R., 2017. Nitrous 546
Oxide Abatement Coupled with Biopolymer Production As a Model GHG Biorefinery 547
for Cost-Effective Climate Change Mitigation. Environ. Sci. Technol. 51, 6319–6325. 548
https://doi.org/10.1021/acs.est.7b00643 549
García-Pérez, T., López, J.C., Passos, F., Lebrero, R., Revah, S., Muñoz, R., 2018. 550
Simultaneous methane abatement and PHB production by Methylocystis hirsuta in a 551
novel gas-recycling bubble column bioreactor. Chem. Eng. J. 334, 691–697. 552
https://doi.org/10.1016/j.cej.2017.10.106 553
Hanson, R.S., Hanson, T.E., 1996. Methanotrophic bacteria. Microbiol. Rev. 60, 439–71. 554
Helm, J., Wendlandt, K.-D., Jechorek, M., Stottmeister, U., 2008. Potassium deficiency 555
results in accumulation of ultra-high molecular weight poly-β-hydroxybutyrate in a 556
25
https://doi.org/10.1111/j.1365-2672.2008.03831.x 558
Hernández, M., Quijano, G., Muñoz, R., Bordel, S., 2011. Modeling of VOC mass transfer 559
in two-liquid phase stirred tank, biotrickling filter and airlift reactors. Chem. Eng. J. 560
172, 961–969. https://doi.org/10.1016/j.cej.2011.07.008 561
Kadouri, D., Jurkevitch, E., Okon, Y., 2003. Involvement of the Reserve Material Poly -562
Hydroxybutyrate in Azospirillum brasilense Stress Endurance and Root Colonization. 563
Appl. Environ. Microbiol. 69, 3244–3250. https://doi.org/10.1128/AEM.69.6.3244-564
3250.2003 565
Kip, N., Dutilh, B.E., Pan, Y., Bodrossy, L., Neveling, K., Kwint, M.P., Jetten, M.S.M., Op 566
den Camp, H.J.M., 2011. Ultra-deep pyrosequencing of pmoA amplicons confirms the 567
prevalence of Methylomonas and Methylocystis in Sphagnum mosses from a Dutch 568
peat bog. Environ. Microbiol. Rep. 3, 667–673. https://doi.org/10.1111/j.1758-569
2229.2011.00260.x 570
Klindworth, A., Pruesse, E., Schweer, T., Peplies, J., Quast, C., Horn, M., Glöckner, F.O., 571
2013. Evaluation of general 16S ribosomal RNA gene PCR primers for classical and 572
next-generation sequencing-based diversity studies. Nucleic Acids Res. 41, e1–e1. 573
https://doi.org/10.1093/nar/gks808 574
Koller, M., Maršálek, L., de Sousa Dias, M.M., Braunegg, G., 2017. Producing microbial 575
polyhydroxyalkanoate (PHA) biopolyesters in a sustainable manner. N. Biotechnol. 576
37, 24–38. https://doi.org/10.1016/j.nbt.2016.05.001 577
Löhr, A., Savelli, H., Beunen, R., Kalz, M., Ragas, A., Van Belleghem, F., 2017. Solutions 578
for global marine litter pollution. Curr. Opin. Environ. Sustain. 28, 90–99. 579
https://doi.org/10.1016/j.cosust.2017.08.009 580
López, J.C., Arnáiz, E., Merchán, L., Lebrero, R., Muñoz, R., 2018a. Biogas-based 581
polyhydroxyalkanoates production by Methylocystis hirsuta: A step further in 582
anaerobic digestion biorefineries. Chem. Eng. J. 333, 529–536. 583
https://doi.org/10.1016/j.cej.2017.09.185 584
López, J.C., Merchán, L., Lebrero, R., Muñoz, R., 2018b. Feast-famine biofilter operation 585
for methane mitigation. J. Clean. Prod. 170, 108–118. 586
https://doi.org/10.1016/j.jclepro.2017.09.157 587
26
C., Leterme, P., Viaud, V., 2016. Microbial Diversity Indexes Can Explain Soil 589
Carbon Dynamics as a Function of Carbon Source. PLoS One 11, e0161251. 590
https://doi.org/10.1371/journal.pone.0161251 591
Magoc, T., Salzberg, S.L., 2011. FLASH: fast length adjustment of short reads to improve 592
genome assemblies. Bioinformatics 27, 2957–2963. 593
https://doi.org/10.1093/bioinformatics/btr507 594
Myshkina, V.L., Nikolaeva, D.A., Makhina, T.K., Bonartsev, A.P., Bonartseva, G.A., 2008. 595
Effect of growth conditions on the molecular weight of poly-3-hydroxybutyrate 596
produced by Azotobacter chroococcum 7B. Appl. Biochem. Microbiol. 44, 482–486. 597
https://doi.org/10.1134/S0003683808050050 598
Myung, J., Flanagan, J.C.A., Waymouth, R.M., Criddle, C.S., 2017. Expanding the range of 599
polyhydroxyalkanoates synthesized by methanotrophic bacteria through the utilization 600
of omega-hydroxyalkanoate co-substrates. AMB Express 7, 118. 601
https://doi.org/10.1186/s13568-017-0417-y 602
Oksanen, J., Blanchet, F.G., Kindt, R., Legendre, P., Minchin, P.R., O’Hara, R.B., 603
Simpson, G.L., Solymos, P., Stevens, M.H.H., Wagner, H., 2015. vegan: Community 604
Ecology Package. R package version 2.3-1. http://CRAN.R-605
project.org/package=vegan. 606
Ondov, B.D., Bergman, N.H., Phillippy, A.M., 2011. Interactive metagenomic visualization 607
in a Web browser. BMC Bioinformatics 12, 385. https://doi.org/10.1186/1471-2105-608
12-385 609
Pieja, A.J., Morse, M.C., Cal, A.J., 2017. Methane to bioproducts: the future of the 610
bioeconomy? Curr. Opin. Chem. Biol. 41, 123–131. 611
https://doi.org/10.1016/j.cbpa.2017.10.024 612
Pieja, A.J., Sundstrom, E.R., Criddle, C.S., 2012. Cyclic, alternating methane and nitrogen 613
limitation increases PHB production in a methanotrophic community. Bioresour. 614
Technol. 107, 385–392. https://doi.org/10.1016/j.biortech.2011.12.044 615
Pieja, A.J., Sundstrom, E.R., Criddle, C.S., 2011. Poly-3-Hydroxybutyrate Metabolism in 616
the Type II Methanotroph Methylocystis parvus OBBP. Appl. Environ. Microbiol. 77, 617
6012–6019. https://doi.org/10.1128/AEM.00509-11 618
27
PHB-producing Type II methanotrophs Methylosinus trichosporium OB3b and 620
Methylocystis parvus OBBP. Bioresour. Technol. 132, 71–77. 621
https://doi.org/10.1016/j.biortech.2012.12.129 622
Ruiz, J.A., Lopez, N.I., Fernandez, R.O., Mendez, B.S., 2001. Polyhydroxyalkanoate 623
Degradation Is Associated with Nucleotide Accumulation and Enhances Stress 624
Resistance and Survival of Pseudomonas oleovorans in Natural Water Microcosms. 625
Appl. Environ. Microbiol. 67, 225–230. https://doi.org/10.1128/AEM.67.1.225-626
230.2001 627
Sander, R., 2014. Compilation of Henry’s law constants, version 3.99. Atmos. Chem. Phys. 628
Discuss. 14, 29615–30521. https://doi.org/10.5194/acpd-14-29615-2014 629
Sasaki, T., Massaki, N., Kubo, T., 2005. Wolbachia variant that induces two distinct 630
reproductive phenotypes in different hosts. Heredity (Edinb). 95, 389–393. 631
https://doi.org/10.1038/sj.hdy.6800737 632
Scheutz, C., Kjeldsen, P., Bogner, J.E., De Visscher, A., Gebert, J., Hilger, H.A., Huber-633
Humer, M., Spokas, K., 2009. Microbial methane oxidation processes and 634
technologies for mitigation of landfill gas emissions. Waste Manag. Res. 27, 409–455. 635
https://doi.org/10.1177/0734242X09339325 636
Schmieder, R., Edwards, R., 2011. Quality control and preprocessing of metagenomic 637
datasets. Bioinformatics 27, 863–864. https://doi.org/10.1093/bioinformatics/btr026 638
Semrau, J.D., Jagadevan, S., DiSpirito, A.A., Khalifa, A., Scanlan, J., Bergman, B.H., 639
Freemeier, B.C., Baral, B.S., Bandow, N.L., Vorobev, A., Haft, D.H., Vuilleumier, S., 640
Murrell, J.C., 2013. Methanobactin and MmoD work in concert to act as the ‘copper-641
switch’ in methanotrophs. Environ. Microbiol. 15(11), 3077-3086. 642
https://doi.org/10.1111/1462-2920.12150 643
Sigler, M., 2014. The Effects of Plastic Pollution on Aquatic Wildlife: Current Situations 644
and Future Solutions. Water, Air, Soil Pollut. 225, 2184. 645
https://doi.org/10.1007/s11270-014-2184-6 646
Stępniewska, Z., Kuźniar, A., 2014. Cultivation and detection of endophytic aerobic 647
methanotrophs isolated from Sphagnum species as a perspective for environmental 648
biotechnology. AMB Express 4, 58. https://doi.org/10.1186/s13568-014-0058-3 649
28
biorefinery: Potential scenarios for generating multiple products from a single 651
fermentation. Bioresour. Technol. 215, 314–323. 652
https://doi.org/10.1016/j.biortech.2016.04.099 653
Sundstrom, E.R., Criddle, C.S., 2015. Optimization of Methanotrophic Growth and 654
Production of Poly(3-Hydroxybutyrate) in a High-Throughput Microbioreactor 655
System. Appl. Environ. Microbiol. 81, 4767–4773. 656
https://doi.org/10.1128/AEM.00025-15 657
Wang, Q., Garrity, G.M., Tiedje, J.M., Cole, J.R., 2007. Naive Bayesian Classifier for 658
Rapid Assignment of rRNA Sequences into the New Bacterial Taxonomy. Appl. 659
Environ. Microbiol. 73, 5261–5267. https://doi.org/10.1128/AEM.00062-07 660
Wendlandt, K.-D., Jechorek, M., Helm, J., Stottmeister, U., 2001. Producing poly-3-661
hydroxybutyrate with a high molecular mass from methane. J. Biotechnol. 86, 127– 662
133. https://doi.org/10.1016/S0168-1656(00)00408-9 663
Whittenbury, R., Phillips, K.C., Wilkinson, J.F., 1970. Enrichment, Isolation and Some 664
Properties of Methane-utilizing Bacteria. J. Gen. Microbiol. 61, 205–218. 665
https://doi.org/10.1099/00221287-61-2-205 666
Zhang, T., Wang, X., Zhou, J., Zhang, Y., 2018. Enrichments of methanotrophic– 667
heterotrophic cultures with high poly-β-hydroxybutyrate (PHB) accumulation 668
capacities. J. Environ. Sci. 65, 133–143. https://doi.org/10.1016/j.jes.2017.03.016 669
Zhang, T., Zhou, J., Wang, X., Zhang, Y., 2017. Coupled effects of methane 670
monooxygenase and nitrogen source on growth and poly-β-hydroxybutyrate (PHB) 671
production of Methylosinus trichosporium OB3b. J. Environ. Sci. 52, 49–57. 672
https://doi.org/10.1016/j.jes.2016.03.001 673
Zhao, Y.H., Li, H.M., Qin, L.F., Wang, H.H., Chen, G.-Q., 2007. Disruption of the 674
polyhydroxyalkanoate synthase gene in Aeromonas hydrophila reduces its survival 675
ability under stress conditions. FEMS Microbiol. Lett. 276, 34–41. 676
https://doi.org/10.1111/j.1574-6968.2007.00904.x 677
29 682
683 684 685
686 687 688 689 690 691 692 693 694 695 696 697 698 699
Table 1. Methane and nitrogen requirements and biomass production per gram of PHA produced.
Sphagnum Sphagnum + Activated
sludge
25 oC 30 oC 37 ºC 25 oC 30 oC 37 ºC Biomass per gram of PHA (g) 6.3±0.6 2.8±0.04 3±0.05 4.7±0.2 3.5±0.2 2.9±0.1 CH4 growth phase (g) 4.5±1 4.5±1 4.5±1 4.5±1 4.5±1 4.5±1 CH4 accumulation phase (g) 7.9±2.4 6±0.4 7±1.3 10.5±2 5.8±1 6.8±1.4 Total CH4 per gram of PHA (g) 12.5±3.4 10.5±1.4 11.6±2.3 15±3 10.3±2 11.4±2.4 Nitrogen per gram of PHA (g) 0.5±0.1 0.2±0.0 0.2±0.0 0.3±0.0 0.3±0.0 0.2±0.0 700
701
30 703
704
705
706
707
708
709 710 711 712 713
714
715
716
717
Figure 1. Influence of the enrichment temperature on the specific growth rates for the 718
communities enriched from Sphagnum and Sphagnum + activated sludge. For the mixed 719
Sphagnum and activated sludge inoculum, error bars show standard errors (n=2), and the 720
31
growth rate at 25 oC (p-value 0.008, n=2). For Sphagnum inoculum, the opposite trend was 722
observed, with decreasing specific growth rates at higher temperatures (p-values of 0.02 723
between 25 and 30 oC and 0.03 between 30 and 37 oC, n=2). 724
725
726
727
728
729
Figure 2. Influence of the enrichment temperature on the specific CH4 biodegradation rate 730
for the communities enriched from Sphagnum and Sphagnum + activated sludge. Error bars 731
are standard errors (n=2). In both cases, no significant difference is observed between the 732
enrichment at 25 and 30 oC. The biomass enriched at 37 oC showed a significant increase 733
(p-value 0.017; t-test for samples of different sizes n=2, m=4) for the mixture of Sphagnum
734
and activated sludge and a significant decrease (p-value 0.018; t-test for samples of 735
different sizes n=2, m=4) for Sphagnum alone. 736
737
738
32 740
741
742
743
744
745
746
747
Figure 3. Influence of the enrichment temperature on the PHA content of the biomass 748
enriched from Sphagnum and Sphagnum + activated sludge. Error bars represent standard 749
errors (n=2). The same trend was observed for the mixture of Sphagnum and activated 750
sludge and Sphagnum alone. Significantly higher PHA contents were observed at 30 and 37 751
o
C compared to 25 oC (p-values of 0.00015 for Sphagnum and 0.005 for the mixture; t-test 752
for samples of different sizes n=2, m=4). The differences between 30 and 37 oC were not 753
statistically significant. 754
755
756
33 758
759
760
761
762
763
764
765
Figure 4. Influence of the enrichment temperature on the biomass yield on CH4 from 766
Sphagnum and Sphagnum + activated sludge. Error bars represent standard errors (n=2). 767
For the mixture of Sphagnum and activated sludge, the biomass enriched at 30 oC showed a 768
significantly higher yield (p-value 0.012; t-test for samples of different sizes n=2, m=4) 769
compared to the biomass enriched at 25 and 37 ºC. For the Sphagnum alone a very 770
significant increased yield was observed for the biomass enriched at 25 oC (p-value 771
0.00097; t-test for samples of different sizes n=2, m=4). 772
773
774
34 776
777
778
779
780
781
782
783
Figure 5. Influence of the temperature during the accumulation phase on the PHB content 784
of the biomass enriched from Sphagnum at 25 ºC under nitrogen starvation at 25, 30 and 37 785