Economic polarisation and gobernality in México
29
0
0
Texto completo
(2)
(3) WELL-BEING AND SOCIAL POLICY VOL 4, NUM. 1, pp. 1-27. ECONOMIC POLARISATION AND GOVERNABILITY IN MEXICO Rodolfo De la Torre' United Nations Development Programme (UNDP) ro dolfo.delatorre@undp. org.mx. Abstract. T. he purpose of this essay is to appraise alternative hypothesis about the origins of recent social revolt in Mexico. It shows that it is not clear that a severe rise in poverty preceded the origins of violent conflict but social polarisation. Therefore, government attempts to deactivate the economic factors that led to social unrest did not necessarily upgrade povertyreduction policies. The complexity of issues involved do not warrant simple results but the picture that emerges from the data shows a weak but steady economic recovery before the zapatista uprising. Several relative deprivation and polarisation indexes are calculated to appraise frustration and redistribution of power theories of rebellion. There was no uniform trend from frustration indicators but when relative deprivation is combined with economic polarisation and the resources of those with less income, the probability of organised revolt significantly increases before the Chiapas rebellion. It seems that the main economic thrust of civil violence was income polarisation, even for the case of the Ejército Popular Revolucionario. The evolution poverty-reduction expenditure shows that after four years of targetedprograms and a social rebellion the poorest states continued to suffer severe under-spending errors. Key words: Polarization, poverty, conflict, public expenditure. Classification JEL: D61, D63, D74, 138.. Introduction he uprising of the Ejército Zapatista de Liberación Nacional (EZLN), focused attention on declining economic conditions as a key factor to understand the radicalisation of political tension into social revolt.' The economic crisis of December 1994 and the outbreak of the Ejército Popular Revolucionario (EPR) in 1996 seem to confirm the association between unfavourable. T. Director of the United Nations Development Program Human Report for Mexico. I thank Alicia Santana and Dora Ordofiez for their helpful assistance in the calculation of distribution indexes. ' Rus (1995, pp. 71,72) states: "... economic and political conditions are at the root of the rebellion,..., those conditions have deteriorated noticeably since the mid-I970s, most especially since the early 1980s." Dietz (1995, p. 33) adds• "The economic factors that trigger the uprising affect all the country..." Serrano (1997, p. 92) concludes: "...radicalisation was the outcome of the compounded effect of deteriorating socio-economic conditions, a distinctive process of politisation, and violent forms of repression".. 1.
(4) ECONOMIC POLARISATION AND GOVERNABILITY IN MEXICO. economic performance and the violent challenge to political authority. Civil violence, by changing the balance ofpower among economic groups, opens the opportunity of change in social policies? One particular form of this general idea considers the Mercase in poverty as the most important single variable behind social rebellion. Under this hypothesis, the 1994 economic crises and the stabilisation policies forced by it only worsen an already adverse tendency for poverty reduction set by market oriented policies. A natural conclusion would be then that if the challenged government wishes to suppress by non violent means some of the elements fuelling social rebellion it should raise the quality of life of at least the poorest population by improving the effectiveness of povertyreduction programs. It could be say that at last poverty has become an important enough governability issue that deserves serious attention. The purpose of this essay is to show that it is not clear that the decline in the standard of living, in particular a rise of poverty, preceded the origins of social revolt in Mexico. Although very high poverty indexes are undeniable at the time of the uprising, it is possible to show that poverty plays a secondary role in generating social conflict and that it decreased just before the zapatistas resorted to armed protest. It is a different phenomenon, social polarisation, the associated with the beginning of organised civil violence. Therefore, if the government attempts to deactivate the economic factors that led to social unrest this would not necessarily mean to upgrade povertyreduction policies.. 1. The Origins of Civil Violence in Chiapas3 There is no simple economic or political explanation of the January 1994 rebellion in Chiapas. Neither the socio-economic conditions and repression of the peasant and indigenous population nor the external influence of religious groups and political activists per se are enough to understand the complex interplay of factors underpinning the organised rebellion. Clearly, many of the underlying causes of the revolt were economic and political, but it is not obvious the weight of each factor. However, there are several elements that help to understand the economic characteristics of civil violence in Chiapas. First, the Chiapas uprising is not an isolated or merely local social movement. The dismantling of agrarian reform and the decreasing participation of the state in rural life damaged the stability of the national countryside.4 In this light, it is convenient to examine national and not only regional economic conditions to understand social upheaval.. Serrano (1997, pp.92, 93) adds: "...radicalisation, by significantly altering the correlation of forces among traditional actors in Chiapas, has opened a window of opportunity for social change in the region...the zapatista movement, by changing the balance of power among regional actors, may have undermined the power of the local elite and could, in the mid and long-term, help the process of social and political change in Chiapas..." . 3 This section is based on Serrano (1997). 4 As Serrano (1997, p. 75) states: "Indeed, the Chiapas uprising, while distinct in its methods and the content of demands, should also be seen within the context of mounting protest spreading among agricultural producers. In Chihuahua, Durango, Coahuila and Jalisco this protest reached violent proportions with roadblocks and massive assaults on public offices".. 2.
(5) WELL-BEING AND SOCIAL POLICY VOL 4, NUM, 1, pp. 1-27. Second, the acceleration of indigenous and peasant resettlements since the 1960s and the increased flow of migrants and refugees in the 1970s and the 1980s led to growing and conflicting property claims. The presidential decrees that tried to redistribute land or create natural reserves only generated additional pressures on an already fragile structure of property rights whilst local agrarian policies reinforced confrontation on overlapping property claims. Finally, the 1992 constitutional reform ofArticle 27 withdrew the right to claim land and allowed higher limits to land concentration5 upsetting admittedly uncertain and low expectations of resolving land petitions but nevertheless important for social stability. So, at the bottom of the conflict there were fights over the control of scarce productive assets. Third, to the constant unfavourable labour conditions and poverty in Chiapas, the late 1980s brought sharp decreases in coffee prices and subsidies whilst a deficiently targeted povertyreduction program, PRONASOL (Programa Nacional de Solidaridad) assigned a growing but still insufficient budget to improve social conditions. The changes in coffee prices, subsidies and the poverty-reduction policies were the results of a national policy oriented to let international. prices signal the allocation of resources whilst public spending compensated the poorest agents. This means that those market forces and public policies provoked an important income redistribution at the regional and national level that could be potential explanations of social revolt. Besides economic factors, other elements like population pressures, inter-ethnic conflicts and religious clashes play an important part in explaining civil violence in Chiapas. However, two non-economic factors that are at the base of social rebellion are politization and organisation. Since the 1960s the Catholic Church, Maoist activist, indigenous groups defending property rights, credit unions, civil rights activists, ejido and peasant organisations and external political groups increased in indigenous communities an awareness ofproperty, labour and civil rights and formed the basic for coherent social movements. Although it remains unclear the actual date of creation of the EZLN, it is possible to say that the organisational foundations for civil violence were present well before the 1994 uprising, possibly since the mid 1980s. The 1982 incursions of the Guatemalan army in Mexico and the Central American crisis brought additional elements to the mounting social protests in Chiapas: militarisation and indiscriminate political repression. The army presence and the appointment of governors with little regard to human rights record blocked the prospecta ofpacific economic reform or political change in the region by the early 1990s.6 In January 1994 the EZLN uprising took place.. 2. Violent Revoking of Authority In essence, the 1994 zapatista movement violently revoked the government authority on a specific region of Chiapas. However, if we consider that the EZLN is not just a local movement but the. s. Even among ejidatarios, land concentration was extremely high. In 1992, nation-wide, 5% of ejidatarios owned 38.1% of all ejidatarios land and Chiapas was the fifth most important contributor to this kind of land concentration in the country. See Vélez and De la Torre (1993). 6 As Serrano (1997, p. 91) points: " In an important sense, the interplay between peasant protest and grassroots repression bolstered the radicalisation of the movement, tilting the balance in favour of armed resistance".. 3.
(6) ECONOMIC POLARISATION AND GOVERNABILITY IN MEXICO. expression of a wider protest, its challenge meant the revoking of local and federal governments' authority in the national context.' Authority is the legitimate exercise of power, it is a structure of rights to control the actions of others and the force to do so.' According to this, the EZLN did not strictly represent a serious treat to government power, since its military force was rather small.9 However, it was an important challenge to legitimacy. The withdrawal of rights to control threatened to spread beyond Chiapas and undermine the consensus on which national authority rests. The wide sympathy and receptivity towards the zapatista movement pointed in that direction. But why is government legitimacy revoked by force? There are at least three possible explanations to this question: declining economic conditions, expectations' frustration and redistribution of power. '°. 3. Did Social Revolt Occur When Economic Conditions Were Declining? Common sense suggests that civil violence will be more likely when population living conditions are worsening. Authors like Marx considered that the deterioration of the people 's standard of living would raise the probability of social rebellion: the increasing impoverishment of the proletariat under capitalism would lead workers to become conscious of their interests and revolt. However, in Marx 's case and in other instances-like the French Revolution, the student riots in 1968, the overthrowing of the Sha in han, the post-stalinist dissidence in the soviet Union, the workers' movement in Poland in the 1980s, and the Sudafrican rebellion-this hypothesis has received little factual support. Sometimes an improvement in economic conditions precedes social uprisings. When poverty rises, the population seems to sunk in an increased passivity. But does the decline in economic conditions explain the zapatista uprising? Did living conditions worsen in Mexico just before the EZLN revolt? Although the Salinas administration had a disappointing growth record it managed to get real increases in GDP and private consumption per capita almost every year (See Figure 1)." In. That the zapatista revolt goes beyond local demands is confirmed by the introduction of problems like national democracy, NAFTA and constitutional reforms in the early stages of peace negotiations. But even without the zapatista's self proclaimed national character of their movement, massive demonstrations and meetings, like the Convención Nacional Democrática, held in August 1994, or the formation of the Frente Zapatista de Liberación Nacional in September 1997, confirm the wider impact of the rebellion. See Coleman (1990 p. 466, p.68): "Authority systems are structures of rights. Those rights have the social character that all rights have: They exist through a consensus of the relevant actors, that is, all those who are part of the system. In the case of an authority system, this consensus is what we meant by legitimacy of authority". Coleman identifies government authority as an involuntary transfer of rights from the individual to other agents because, in general, individuals are born in societies where a consensus on rights already exists. If rights to control actions are held by the person, this allocation of rights is self policing "...because it places rights of control in the hands of that actor with the facto control.... But that is not true for any other allocations.... In other words, authority that is not voluntarily vested by an actor in another must be backed by coercive power if it is to be enforced". 9 Only five out of more than 2395 municipios in Mexico were briefly occupied by zapatista forces. '° See Coleman ( 1990, pp. 470-502) " Figure 1 shows the evolution of GDP and private consumption per capita using the new 1993 base for calculation. This base uses new weights for sectorial output, it is not just a price adjustment. 7. 4.
(7) WELL-BEING AND SOCIAL POLICY VOL 4, NUM. 1, pp. 1-27. 1993 GDP per capita growth was a mere 0.1% and private consumption per capita fell 0.3%.12 Nevertheless, it is not believable that such small changes in GDP and consumption per capita drastically deteriorated living conditions and generated the rebellion. The 1984-1989 period, when GDP per capita fell 4.8%, was a much clearer time for civil violence. Figure 1 Real GDP and Private Composition Per Capita Grown Rates (%) 6 5 4 3 2 1. -1. 1989. 1990. 1991. 1992. 1.93. 1994. GDP per capita —E— Private consumption per capita Source: OECD (1997), CEPAL (1995).. Information at the household level, which computes disposable net income and non monetary consumption, and other development indicators shows an improvement in living conditions. Table 1 presents severas measures of the standard of before and in the year of the zapatista uprising. Table 1 Indicators of Living Standards* Indicators. 1984. National income per capita. 397.7. National consumption expenditure per capita. 1989. 1992. 1994. 485.7. 565.9. 603.3. 286.8. 436. 504.6. 522.7. Rural income per capita. 241.5. 258.6. 231.4. 244.8. Rural consumption expenditure per capita. 172.6. 236.1. 221.1. 216.5. '2 OECD (1997) with GDP base 1993 and a population growth rate of 1.8% according to CEPAL (1995). Quarterly data shows that GDP per capita fell 5.96% from the second to the third quarter, but grew 8.6% towards the end of the year. However, such sudden changes are explained by production stationality. 13 In August 2002 the Mexican govemment announced an official method for poverty measurement. In Table 1 extreme poverty is obtained with the lowest poverty line in the official method. The Human Development Index is the simple average of life expectancy, educational attainment and GDP per capita indicators, and in Table 1 the HDI is calculated using the same method each year.. 5.
(8) ECONOMIC POLARISATION AND GOVERNABILITY IN MEXICO. Table 1 (continued) 1984. Indicators. 1992. 1989. 1994. Poverty (individuals, official method). -. 52.6. 55.6. Extreme poverty (individuals,official method). -. 22.5. 21.1. 65. 72. -. 35.6. 36.8. 75.7b. -. 77.1c. Rural poverty (individuals, official method) Rural extreme poverty (individuals,official method) 74.8a. Human Development Index. Source: Cortés et al. (2002) and own calculations with information from ENIGH 1984-89, INEGI, UNDP (2003). * Income and expenditure in 1994 pesos. a-1980, b-1990, c-1995.. The picture that emerges from this data does no correspond to a spectacular economic catastrophe that would provoke civil violence. The information shows a weak but steady economic recovery in consumption and expenditure. Before the beginning of the revolt, even extreme poverty falls. From 1984 to 1994 real income per capita grew 51.7%, real consumption per capita expanded 82.2%, altough general poverty increases 3 points. It is important to notice that rural poverty, general or extreme, increases from 1992 to 1994. On the other hand, the Human Development Index (HDI), which measures the average achievements in a country in longevity, knowledge and standard of living, increases 1.8% from 1990 to 1995.. 4. Expectations' Frustration? An altemative explanation to armed rebellion corresponds to increasing frustration. In this view the focal point is the subjective perspective of those subordinate to authority that differs from the perspective taken by external observers. From the view point of those involved in a revolt, things are getting worse, although the external's observer view point would say they are improving. Aggression would be the outcome of getting short from an expected result, and the aggression in turn leads to revolt. There are several ways to define the kind of frustration involved in revoking authority. First, when there is an improvement in economic conditions, this creates rising expectations, so the persons expect to be better off. But the expectations rise faster than the improvement in life conditions. Thus there is a growing gap between people 's expectations and objective conditions. The individuals view reality from the perspective of increased frustration. Although frustration originates in a simple discrepancy between expected outcomes and results, it can be compounded by the fact that the authority could be behind the formation of the unfulfilled expectations. Under this perspective, the difference between government economic forecasts and actual performance would be an index ofthis kind of expectations' failure. A second form of frustration occurs when a short-term setback, like a recession or a sudden rise in prices, interrupts economic recovery. It is this setback that creates the gap between. 6.
(9) WELL-BEING AND SOCIAL POLICY VOL 4, NUM. 1, pp. 1-27. expectations and objective conditions. This view point looks for price or quantity shocks in a period of general economic development just before the revolt. Unemployment or real income indicators could detect this kind of setbacks. Another form of frustration involves relative deprivation. When there is a rapid improvement in economic conditions, some improve more rapidly than others. Those for whom conditions are not improving very fast see others doing much better than they are. It is from this perspective that the individuals perceive a widening gap, then frustration emerges and they revolt. To detect relative deprivation the evolution of a group economic conditions should be compared to the average or other's conditions. A final form of frustration arises when improved economic circumstances lead people to expect a parallel increase in political power, an increase that does not tum up. From this position, there is a divergence of different aspects of one's condition that creates a gap between actual and expected outcomes. Political repression amidst economic recovery is an indicator of this type of inconsistent expectations. A weakness of frustration theories of revolt is that frustration is a characteristic of the individual whilst a rebellion is a social phenomenon. Simple aggregation of frustrated individuals does not account for organised revolt. An armed response to government authority as the EZLN uprising is not the sum of spontaneous individual riots but the outcome of a highly organised and planned social movement. However, frustration could account for population's responsiveness to a revolt. Organised leadership creates the opportunity of a social uprising, but the probability of supporting or even participating in the revolt would depend on the level of expectation's frustration. Frustration is the precondition, at the level of individuals, of revolt or support for rebels. But was there growing frustration among the population just before the zapatista uprising? It could be said that the Salinas administration was an age of increased expectations. After a closely contested election Salinas lost no time in offering results that backed his market oriented promise of economic development. In 1990 the Brady Plan helped to reduce foreign debt and from 1989 to 1992 the fiscal deficit was tumed into a surplus; macroeconomic policies eliminated hyperinflation, the government widened the deregulation of domestic economic activity and foreign investment more than tripled from 1990 to 1991. Indeed, the prospect of economic stability and structural reform was bringing massive amounts of foreign capital strengthening the view that there will be fewer constraints to finance future economic development. Other reforms achieved mixed results. For instance, several tax reforms reduced the fiscal burden on middle income groups, as the 1993 reduction in the non food goods VAT, but they increased the tax base. Here people's future benefits of the fiscal reform became part of the rather abstract idea ofhealthy public finances. Other example is PRONASOL, which gradually increased social spending on the poor but with an erratic targeting. The limited resources of the program and its lack of explicit criteria for selecting aid recipiente caused persistent uncertainty among possible beneficiaries.". PRONASOL did not publish its objectives and policies as other government programs did. It did not disclose detailed information about the allocation of resources but until its last year of operations.. 7.
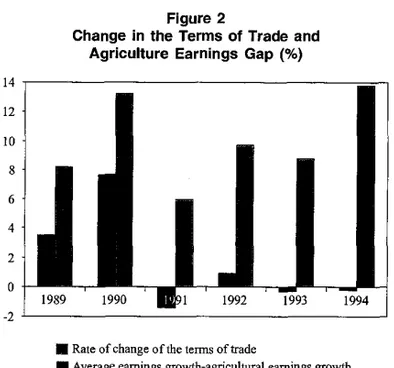
(10) ECONOMIC POLARISATION AND GOVERNABILITY IN MEXICO. A final group of reforms brought more expectations than results. That is the case of the agrarian reform and the North American Free Trade Agreement (NAFTA). The 1992 reform of Article 27 purported to inject a significant amount of new investment in the agricultural sector by protecting and widening property rights. But the reform did not yield a significant change in private investment. On the other hand, NAFTA negotiations introduced the idea of gradual and future improvements in labour intensive industries, but for a while private investment was hold waiting the ratification of the agreement by a new US administration. In Mexico, Salina's present image is severely tainted by his last year in office record: guerrilla uprising, political assassinations and his contribution to the December crisis. Corruption allegations did not improve his case. However, before the zapatista rebellion, the Salina's administration was very successful in rising expectations and in convincing nationals and foreigners to risk resources on them. It did seem that only a significant shock would prevent the Mexican economy from getting the necessary resources to attain continuous growth, but none was on In 1982 and 1985 a key factor determining sudden changes in economic variables was the fall in oil prices. In those years the Mexican economy received severe shocks in its terms of trade that worsen fiscal and debt imbalances. In the Salinas administration no such price changes were present and those sources of potential instability disappeared. However, a combination of a more open economy and adverse terms of trade generated price shocks, particularly in the agricultural sector, which was falling behind the rest of the economy (see Figure 2). Before the zapatista movement there clearly existed setbacks in the terms of trade, but they were minor compared to the 1986 terms of trade shock." It is hard to attribute social revolt to such changes. More important is the relative deprivation of those employed in agriculture, since constitutional changes to property rights and the negotiation of NAFTA intended to foster rural development and labour intensive production. Real earnings by occupied person in the agricultural sector were relatively lagging. In this light it makes sense to consider the Chiapas uprising as part of a wider rural discontent: expectations were consistently generated and frustrated. Other indicators show additional grounds for increased frustration (see Table 2). Government forecasts at the beginning of the Salinas administration considered a gradual increase in GDP growth. However, the gap between expected growth and actual growth was widening. In 1993 the National Development Plan failed by almost 6 points in forecasting actual growth. On the other hand, Table 2 shows one of the factors frequently associated with the Chiapas uprising: the drastic coffee prices fall from 1985 to 1992. Although from 1992 to 1993 there is a small recovery, this has an ambiguous meaning since it represents a relief for coffee producers but probably one that did not live to their expectations. Another factor associated with frustration was the downturn in employment. The end of a brief recovery from 1989 to 1991 led urban unemployment rates to 3.7% in 1993. National unemployment showed the same trend. Considering a 2.3% annual increase in the working age population and a growing participation rate in the labour marketr this meant an increasing amount of frustrated workers. It is symptomatic that well argued warnings of unsustainable current account deficits did not have a significant effect on foreign investment until it was to late. 16 That year oil prices fel) 24.3%. Participation rates rose by a strong 0.5 points per year between 1991 and 1995 according to OECD (1997) calculations. 8.
(11) WELL-BEING AND SOCIAL POLICY VOL 4, NUM. 1, pp. 1-27. Figure 2 Change in the Terms of Trade and Agriculture Earnings Gap (%) 14 12 10 8 6 4 2. -2 ■ Rate of change of the temas of trade Average eamings growth-agricultural earnings growth Source: OECD (1997).. Table 2 Frustration Indicators Indicators. 1984 1989 1992 1994. GDP growth gap. -0.6*. Coffee prices (dollars per pound). 0.2. 1.4561, 0.892d. National open unemployment. 3.5. 3.2. 0.633 0.699f. 4.4. 2.8. 3.8. 3.9. Income share of the poorest 20% (national). 4.83. 4.39. 4.28. 4.35. Income share of the poorest 20% (rural). 5.36. 5.38. 5.47. 6.13. Relative political power. 100a. 98.6c. 101.6. 102.8f. Relative human rights complains**. N/A. 100e. 217,00. 189f. Notes: N/A: Not Available. * Based on the 1982 estimate of economic growth. **1989=100. a-1983, b-1985, c-1987, d-1990, e-1991, f-1993. Source: Own calculations with information from PND (1989, 1997), CEPAL (1995), ENIGH, 1984,. 1989, INEGI, Foweraker (1996), OECD (1997) and Comisión Nacional de los Derechos Humanos (19921994).. 9.
(12) ECONOMIC POLARISATION AND GOVERNABILITY IN MEXICO. Relative deprivation in agriculture is a source of frustration, but it is important to remark that it did not mean the relative decline of the poorest 20% of the population. From 1992 to 1994 this group increased its real income 1.6 points aboye the national average. So, relative deprivation is not an evident phenomenon since it even decreased according to some measures. Another piece of information contradicting the hypothesis of increased frustration is the evolution of the index of political power relative to economic conditions. To construct this index, a GDP per capita index divides the recoded Humana index of political rights." From 1987 to 1993 there was a relative increase in political and civil rights. There was no stagnation of political power amidst economic recovery. On the contrary there was a mild progress in the protection of political rights when economic growth was very low. Another indicator ofrelative political power is the number of human rights violations complains per capita divided by the GDP per capita. The relative human rights complains index shows an actual decrease from 1992 to 1993 confirming no loss of civil rights with respect to economic performance before the zapatista uprising. There is no uniform trend in frustration indicators. There exists evidence of rising expectation and price and quantity setbacks, but it is hard to say that there was an imbalance between political power and economic conditions. On the other hand, relative deprivation increased but it was a sectorial phenomenon not reserved to the national or rural poor.. 5. Redistribution of Power A third explanation of social revolt considers organised rebellion as a rational action dependent on the expected net gains of engaging in civil violence. The expected net gains in turn depend on the costs ofparticipating in social rebellion, on a significant change in political and economic conditions when succesfully challenging government authority and on the perceived probability of such success. When net gains of revoking authority and the probability of successfully doing so are high, it is rational for an agent to engage in social revolt or at least to support it. The costs ofparticipating in a rebellion are the time and resources sacrificed to join organised violence. These opportunity costs are generally low for those in extreme poverty. However, a more important set of costs involves the sanctions enforced by authorities, or by supporters of the authorities during the conflict: arrest, confiscation of resources, torture or even dead may be the outcome of armed rebellion." This usually discourages individuals in extreme poverty, because they tend to be more tisk averse to potential losses that can endanger their survival." Another cost is the expected punishment by government authorities if the rebellion is unsuccessful. This cost is high for the leaders of the revolt but low for the rest of the participants. The Human index is calculated by scoring forty questions on political, civil and social rights. All Humana questions are drawn from the Universal Declaration of Human Rights. The recoded index include only civil and political rights as freedom from torture, freedom from serfdom, freedom from political censorship and freedom for multiparty elections. Maximum score is 100 for complete protection of rights (See Foweraker, 1996). GDP per capita index is calculated according to the 1980 base. The relative political power index is set at 100 for 1983. For 1993 the Humana index of 1992 is used assuming no change in political and civil rights. 19 These costs may be low in the initial stages of the revolt if public opinion curbs human rights violations or the use of force to confront the rebels. See Levy (1994, p.67). 18. 10.
(13) WELL-BEING AND SOCIAL POLICY VOL 4, NUM. 1, pp. 1-27. The benefits ofparticipating in organised civil violence are those associated with the change of the regime: increased economic resources, redistribution of existing income and wealth, political power or legal concessions are examples of this. These benefits are almost independent of the individual's participation. However, a second set of rewards is contingent on the individual's participation in the revolt and on its success, such as a position in the new structure of authority. These rewards are scarce and selective and do not explain wide participation. It is the set of reciprocal reinforcements of individuals acting together and sharing the same goals that promote wider collective action. Ideology provides the setting that allows closely associated individuals to generate rewards that are not conditional on the expected success of the revolt. This last kind of benefits involves lower costs and adds to the subjective rewards of working towards the realisation of the common vision. Some rebellions become revolutions with mass participation, but organised civil violence usually involves a small part of the population as activists. This set of individuals not only finds a net benefit in withdrawing from the government the rights to control their actions but in investing time and resources to build up and expandan organisation capable of bringing an alternative to the actual exercise of authority. This net benefit is bigger than the net gains of continuing to regard the actual power structure as legitimate. Authority is divested when the individual no longer expects that the government will provide a social order that generates and distributes beneficial rights and economic results superior to the probable outcome of the revolt. The estimated probability of generating an actual change depends on the perceived power of the rebel force against that of the government. This power in turn depends on the number of individuals and their investment in rebellion that find a net gain in challenging authority, so there can be a contagious effect if many persons join the revolt. On the other hand, the perception of government weakness to exercise its power increases the estimated probability of a successful revolt since not only the rebellion net gains look better than those of the vacillating authority but because the government's ability to punish decreases. Both factors increase the rebellion's relative net value for a given probability of success, which in turn increases the number of individuals participating and investing in the revolt and thus it raises its estimated probability. Under this explanation, an improvement in economic conditions might increase the revolt's perceived chances of success for it adds power and resources to those attacking the status quo. The effect of improved conditions may be as well to strengthen the belief in the potential success of those opposed to govemment authority among the population as a whole, unless the improved conditions greatly reduce dissatisfaction and thus undermine the evaluation that the regime is worse than one that might replace it. In this perspective, for the rebels it is unimportant to convine all the population of the convenience of an alternative regime, but to insure that they are regarded as powerful. Popular support will flow not on the grounds of ethic considerations but on the actual possibilities ofgaining the right to exercise legitimate power.2 I In a social rebellion what is important is people's beliefs about the relative power of the antagonists and about what will happen if. 21 Why the EPR did not win wide popular support as the zapatistas did? Both movements emerged in poor states and involved similar reivindications. One element that could explain this phenomenon is the relative weakness of the new rebels with respect to the EZLN. At the beginning of the social uprising, the zapatistas invaded four municipalities, declared war on the federal govemment and stablished a stronghold in the Lacandon jungle. EPR actions were intermittent and geographically disperse. They did not represent a credible treat to government authority and then were regarded as a non viable alternative to the exercise of legitimate power.. 11.
(14) ECONOMIC POLARISATION AND GOVERNABILITY IN MEXICO. supporting one side or another. The orientation of the general public is not, however, irrelevant since it will determine if the active protagonists are able to move freely in the conflict zones. But only passive support is necessary to achieve unimpeded actions, not the sharing of abstract goals. The redistribution of power theory can dispense the frustration explanation of revolts. If there is a credible treat to govemment authority, there will be grounds for support and involvement in organised civil violence, even when dissatisfaction is decreasing. A persistent frustration, if any, will be the sense that even in the presence of a strong challenge the regime remains in power. However, frustration and redistribution ofpower are better seen as complementary explanations of rebellion. This view sees rebellious actions as the product of dissatisfaction with the existing social order and the belief that revolt against that social order will be successful, but frustration by itself is not the cause of organised civil violence. So the question is now, are there grounds to believe that before the zapatista uprising the probable net gains of a revolt where increasing relative to the those provided by the government's status quo?. Ex post there is evidence that the EZLN rebellion had the adequate conditions to emerge. Decreasing poverty, additional resources for low income groups, a more active human rights defence and the pressure of national and international public opinion significantly decreased rebellion's costs in the first year of the zapatista uprising. The highly organised nature of the EZLN, with "professional soldiers", a peasant army, a Clandestine Indigenous Revolutionary Committee (Comité Clandestino Revolucionario Indígena) and a Communal Assembly" shows a lower opportunity cost in investing resources in the rebellion. On the other hand, a wide press coverage of the military manoeuvres in Chiapas prompted human rights concerns and public opinion pressures to stop an armed "solution" to the conflict. Two weeks atter the uprising, the federal government conceded an "unilateral truce" that formally reduced the sanctions for the rebel torees during the conflict. The government broke the truce in February 1995, so the costs of participating in the revolt did not disappear. However, in 1996 an amnesty law was issued granting concessions to those rebels willing to negotiate and to abandon armed conflict. This law practically reduced to zero the costs of an unsuccessful rebellion, if the rebels surrender. The benefits of revolting also seem clear, ex post. Atter six weeks of the zapatista uprising, the federal government was in the negotiating table of the Jornadas por la Paz y la Reconciliación with 32 offers to attend the 34 initial demands of the rebels." It established a special office to receive peasant and indigenous demands and in 1995 almost doubled Chiapas' share in povertyreduction expenditure. The government was ready to discuss legal changes on indigenous communities and agrarian reform at the national levet, and new electoral and justice laws at the local levet. The San Andres Larrainzar accords included the autonomy of the indigenous communities. In 1997, a mass demonstration in Mexico City proclaimed the creation of the Frente Zapatista de Liberación Nacional (FZLN), the political branch of the EZLN, with several supporters of the zapatistas, once in jail, appointed as leaders of the new organisation. The uprising obtained non repressive attention from the govemment, resources, legal concessions, political power and conditions to develop ideological ties among their supporters. See Dietz (1995) for a more detailed account of the organisative nature of EZLN. The resignation of the president was rejected and to the demand of effective and democra c nat onal elections the answer was that they were already in progress.. 22. 2'. 12.
(15) WELL-BEING AND SOCIAL POLICY VOL 4, NUM. 1, pp. 1-27. Finally, it is now obvious that the EZLN had the capabilities to mobilise men and resources in violent and pacific tasks. From the initial attacks to the FZLN creation, the zapatistas presented the image of a unified and powerful challenge to authority. Even when the military capabilities of the zapatistas were no match to the federal army, it was clear that the EZLN was able to attract press coverage and public attention to reduce the use of force. Again, now is evident that there were weaknesses in government policies to detect and dissolve the rebellion. National security coordination was impaired after the replacement of an experienced Interior Secretary, Fernando Gutierrez Barrios with a former Chiapas governor, Patrocinio Gonzalez in 1993. Even after the detection of several zapatista training camps by the army, months before the uprising, government intelligence had no coherent picture of the nature of the movement. The power of the zapatista movement and the govemment weaknesses resulted in a rebellion with probability one. Ex post, the characteristics of the revolt are consistent with the redistribution of power theory.24 But what about ex-ante indicators? It is very difficult to gather data about the costs and benefits of a prospective revolt. Not only there is little evidence on the actual expenses and expected returns of a social uprising in its formation stages but much of the information decisive to the individual's participation in a rebellion is subjective. Which is the altemative set of rewards that potential rebels perceive to the economic and politic status quo? How much relative power the individulals perceive in the revolting coalition? However, if the redistribution ofpower theory aspires to be more than an ex-post rationalisation of organised civil violence, it must provide at least some indirect evidence on the probability of a revolt.. 6. Rebel Ideology, Relative Deprivation and Polarisation Under reasonable assumptions, income distribution indicators, albeit not the traditional ones, can provide indirect information about the expected economic gains of a revolt and its probability of occurrence. The starting point is the idea that the probability of a revolt depends on the number of individuals that find a positive expected net gain in rebellion. The expected net gain is the altemative income multiplied by the probability of a successful revolt, minus the actual income weighted by the probability of failure. Rebel ideology contains, among other things, a proposal of an altemative income distribution that maximises the size of the coalition that finds a positive net gain in organised. " There is more evidence that conforms to the redistribution of power theory. Coleman (1990, pp. 500-502) indicates that rebels' optima! strategy involves early success in displaying power; severe punishment for acting in support of the other side; not engaging in indiscriminate terror; demonstration of authorities' weakness; seeking external support; an utopian ideology that challenges authority; incorporation of existing grievances of population into proposals, and; isolation of potential recruits from non supporters. The EZLN actions follow this partem: it began by the spectacular taking of five towns simultaneously; two days later it kidnaps the ex-governor Absalon Castellanos, judges him and declares him guilty of crimes against the people, but instead of an execution he is released; the authorities look unable to identify, locate and attack the zapatista forces and when they do national and international media and public opinion prevent military actions; the declarations of the Lacandon Jungle and several Marcos' letters provide severe critiques to the government, justify civil violence and demand widely supported social and economic changes, and; finally, when the movements is under attack, it withdraws to a zone with high degree of closure within groups of supporters.. 13.
(16) ECONOMIC POLARISATION AND GOVERNABILITY IN MEXICO. civil violence. On the other hand, government authorities could reply setting penalties or redistributive rewards that minimise the net gains of engaging in rebellion. The aboye set of conditions indicates that the rebel ideology will advance a progressive redistributive proposal to recruit potential members. Antagonic coalitions will form more quickly if the "middle" classes are small. The progressive distributive proposal will generate dissatisfaction with present income distribution among low income groups that will get rewards if they join the revolt and it succeeds. The comparison between the status quo and the expected gains of a revolt arouses relative deprivation feelings that fuel frustration and a predisposition to rebellion. On the other side, coalition formation is easier if there exists a cluster of low income potential rebels. If there is a wide middle income class a redistribution proposal will divide it, some will support the rebellion some will not, and some will be undecided, which will debilitate collective action. If income distribution is polarised, the middle class will play a minor role in stopping coalition formation. Roemer (1985) has developed a model of revolutionary activity on similar grounds that concludes that ifrevolt is highly probable then the optimal rebel strategy is to propose a progressive income distribution. Furthermore, if rebellion is highly probable then it is highly polarised: the undecided middle class disappears. There are additional reasons to consider relative deprivation and polarisation as indicators of potential revolt. The comparisons between haves and have nots generate discontent, envy or feelings of unfairness in the society. Envy is a powerful emotional force behind social upheaval and shared perceptions of unfair treatment facilitate the formation of connnon ideological beliefs that decrease the costs of collective action. Besides, the presence of groups with substantial intragroup homogeneity and inter-group heterogeneity reduces the costs of articulated rebellion and to the generation of tensions. A society split up into two well-defined and separated coalitions exhibas a high potential for social conflict." The implications of these arguments are that an index of dissatisfaction with the present income distribution and an indicator of the importance of the middle classes will be good proxies for the probability of revolt. An initial way to think of relative deprivation is considering dissatisfaction with present income distribution independently from any proposed option. Under this view, an individual is relatively deprived with respect to other individuals if she has less income than them. However, a person weights more comparisons with similar income individuals. Comparisons with extremely rich persons carry little weight." Total relative deprivation felt by an individual is the sum of all her income differences. The degree of relative deprivation in the society as a whole is the sum of the total relative deprivation of all persons. If there is an equal income distribution social relative deprivation is zero. If maximum inequality exists, meaning that one person has all income and the rest of the individuals nothing, total relative deprivation is very low, because deprived individuals only compare to one extremely distant. " Podder (1996, p.372) indicates that "Obviously, when relative deprivation is maximum in the society, discontent is also maximum and this is the stage at which the probability of a social conflict is the highest". Esteban and Ray (1993, p.5) add: "...the more polarised a society is, more probable is that interest differences lead to a open conflict." " The individuals tend to compare with a reference group with which they interact. Dissatisfaction is mainly elicited when the neighbour commands a greater quantity of resources not when someone socially or economically distant improves her position. On this point see Podder (1996, p. 358-359).. 14.
(17) WELL-BEING AND SOCIAL POLICY VOL 4, NUM. 1, pp. 1-27. person. For a given total income, maximum relative deprivation exists when half the population has no income and the other half divides equally total income among them. In this last case, we have the maximum number of comparisons between haves and have nots with not so distant incomes. On the other hand, polarisation means the presence of significantly sized population clusters, such that each cluster has members with similar characteristics, but different clusters have members with dissimilar characteristics. Society is an amalgamation of groups. High polarisation occurs when there is a high degree of homogeneity within each group, a high degree of heterogeneity across groups and a small number of significantly sized groups. Isolated individuals or groups of insignificant size carry little weight since the interest is on organised collective action and not spontaneous singular expressions of social exclusion. Under this perspective, individuals feel identified if they have similar incomes and if there is a large number of them in the same income class. On the other hand, a person feels alienated from others that are distant from her. Because alienation depends on income differences, low income individuals feel alienated from rich individuals and vice versa. The effective antagonism of an individual against others depends on her degree of identification an alienation with them. Total polarisation is the sum of all effective antagonisms. If there is an equal income distribution among individuals, all members of society belong to the same income class, so they identify with each other and no alienation or antagonisms exist. If maximum inequality occurs then polarisation is very low since one individual gets all income and the rest of society nothing, which means that most of the individuals identify with each other and only feel alienated regarding one person. Maximum polarisation exists when half of society is in a zero income class and the rest divides total income equally. In this case, the minimum number of groups achieves maximum identification among groups and maximum antagonism across groups. This last situation means the disappearance of a middle class into rich and poor income categories.' When there is an equal income distribution, relative deprivation, polarisation and inequality are at their lowest. Maximum inequality generates low relative deprivation and low polarisation. Maximum relative deprivation and maximum polarisation emerge with an intermediate degree of inequality, when society divides equally between haves and have nots. Clearly, relative deprivation and polarisation can move together and very differently than inequality. However relative deprivation and polarisation are different phenomena. Relative deprivation measures dissatisfaction with present income distribution whilst polarisation captures the relative importance of the middle class Recently, different sets of axioms and descriptive techniques provided several relative deprivation and polarisation measures: Podder relative deprivation index, Wolfson polarisation measure and the family of polarisation indicators by Esteban and Ray are examples of this. However, they are only an approximation of distribution dissatisfaction and to the formation of antagonic groups. On one hand, present relative deprivation must be confronted against the one that would exist with an alternative income distribution. On the other hand, the population clusters weighted by polarisation measures do not necessarily coincide with those with actual positive net gains of engaging in civil violence. Since altemative income distribution proposals and potential rebel coalitions are hard to detect, relative deprivation and polarisation measures are directly used. Figure 3 presents data on the evolution of inequality, relative deprivation, and polarisation as measured by the Gini, Podder and Wolfson indexes. In fact, as argued by Wolfson (1994, p.353) polarisation is a shorthand for the phenomenon of the disappearing middle class.. 27. 15.
(18) ECONOMIC POLARISATION AND GOVERNABILITY IN MEXICO. Figure 3 Inequality, Relative Deprivation and Polarization Indicators 60. 50. 40. 30. 20. 10 1984 ■ Gini. 1992. 1989. 1994. ■ Podder Relative Deprivation Index. E Wolfson Polarization Index Source: Own calculations with information from ENIGH, 1984,1989,1992,1994, INEGI.. The Gini coefficient is a standard measure of income inequality that ranges from zero (perfect equality) to one (maximum inequality). The Podder index measures relative deprivation using a logarithmic weighting of incomes, and ranges from zero (perfect equality) to one (maximum relative deprivation).28 The Wolfson index measures polarisation according to a Lorenz curve transformation and it ranges from zero (perfect equality) to one (maximum polarisation).29 The salient feature of this data is the very high polarisation index that increases 13.7% from 1984 to 1992." From 1992 to 1994 polarisation increased 6.14%. On the other hand, relative deprivation does not appear to be very high but it increased 12.4% from 1992 to 1994. Finally, alter an important increase from 1984 to 1989, inequality remain relatively stable from 1989 to 1994. From the Podder and Wolfson indexes it is possible to conclude that a combination of relative deprivation and polarisation preceded the zapatista uprising. In the key period 1992-1994 the indicators move sharply, although a more careful analysis is needed to appraise the joint importance of these factors.. " Relative deprivation is calculated as RD = Ei F, j (lnli-lnlj) for Ii >ij and then divided by the maximum level of relative deprivation M= [N/2]2 In[(2It/N)-1)], where Ii is the income of the ith individual, N is total population, and It is total income. 29 The Wolfson index is (2-4Lm-2G)/(Im) where Lm is the accumulated income share of the 50% of the population and Im is the median income divided by the average income. " Polarisation is higher than inequality and both range from zero to one, so they can be compared. Wolfson (1994, p. 357) has reported for Canada's labour income polarisation indexes that range from 33.8 to 41.7. 16.
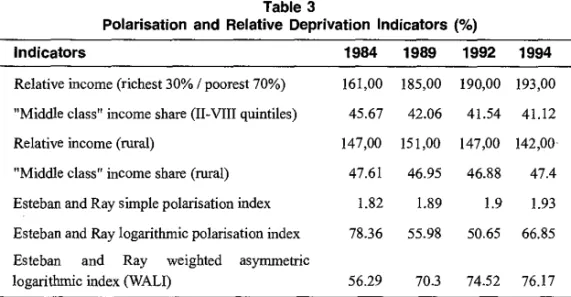
(19) WELL-BEING AND SOCIAL POLICY VOL 4, NUM. 1, pp. 1-27. Table 3 provides additional information on the deepening of relative deprivation and polarisation. From 1984 to 1994 the poorest 70% of the population obtained less than the average income whilst the richest 30% perceived more than that at the national and rural level. The relative income of this group approximates the degree of relative deprivation. This measure clearly shows an increased distance between less than average income population and its complement. On the other hand, the income share of the intermediate 60% of the population serves as an indicator of the decreasing relative importance of the "middle class". The trends are different for rural amas in the period 1992-1994. However, these indicators are still crude approximations to the notions of relative deprivation and polarisation. The Esteban and Ray family ofpolarisation indexesprovides a more precise measure of this phenomenom.31 The Esteban and Ray simple polarisation index uses the absolute income differences to measure antagonism and the population frequencies to incorporate intra-group identification. It is similar in its conception to the Wolfson index, and it ranges from zero (perfect equality) to one (maximum polarisation)." Although it seems very low, it is quite high when compared to previous calculations of this index." More important, the index increases 5.8% from 1984 to 1994. The Esteban and Ray polarisation indicators are very versatile, allowing to incorporate different ways to measure social antagonism. If instead of using income shares in the index we use. Table 3 Polarisation and Relative Deprivation Indicators (%) Indicators. 1984. 1989. 1992. Relative income (richest 30% / poorest 70%). 161,00. 185,00. 190,00 193,00. 45.67. 42.06. 147,00. 151,00. 47.61. 46.95. 46.88. 47.4. 1.82. 1.89. 1.9. 1.93. Esteban and Ray logarithmic polarisation index. 78.36. 55.98. 50.65. 66.85. Esteban and Ray weighted logarithmic index (WALI). 56.29. 70.3. 74.52. 76.17. "Middle class" income share (II-VIII quintiles) Relative income (rural) "Middle class" income share (rural) Esteban and Ray simple polarisation index. 41.54. 1994. 41.12. 147,00 142,00. asymmetric. Source: Own calculations with information from ENIGH 1984,1989,1992 and 1994, INEGI.. 3 ' The Esteban and Ray basic indexes are derived axiomatically so their properties and extensions can be more easily appraised.. '2 Simple polarisation is calculated as Ps = 2Ei F,j P2iPj 1X i — Xj where Pi is the population share of income class i and Xi is the income share of income class i. This equation is very similar to the one that defines the Gini coefficient, which is closely related to the Lorenz curve. " Esteban and Ray measure polarisation of world growth rates. For Gini coefficients similar to those for Mexico they obtain polarisation levels of 0.44.. 17.
(20) ECONOMIC POLARISATION AND GOVERNABILITY IN MEXICO. the natural logarithm of income, the indicator becomes one similar to the Podder relative deprivation index." This combined polarisation-relative deprivation coefficient increases 31.9% from 1992 to 1994. Finally, the poor could feel alienated from the rich, but not vice versa, and their sense of identification could depend on their economic power. If so, it is possible to obtain a weighted index that captures relative deprivation, the polarisation of the poor and the potential resources that invested in a conflict." This index is the main indicator ofpotential rebellion and steadily increases from 1984 to 1994 by 35.32%. There is a robust conclusion: although from 1984 to 1994 relative deprivation and polarisation indexes do not always change in the same direction, from 1992 to 1994 all point to a significant increase in potential social conflict. When a key concept of relative deprivation is not considered (the use of the logarithmic scale that means that individuals weight more comparisons with persons with similar income) polarisation is always increasing. But when relative deprivation is combined with social polarisation and the resources of those with less income the probability of organiséd revolt grows from 1984 to 1994. It seems that the main economic thrust of civil violence was income polarisation.. 7. Is Civil Violence a Local Phenomenon? So far, the zapatista rebellion has been considered the expression of a national phenomenon. But should not be considered just a local movement disguised with pretentious clothes? Perhaps under this light poverty is the explanation to civil violence and not other factors. Figure 4 presents the available information at state level" for several poverty, relative deprivation and polarisation indexes. The data clearly shows that from 1990 to 1995 polarisation increased in Chiapas whilst relative deprivation and extreme poverty decreased. This information is consistent with the redistribution of power theory and does not contradict the general results at the national level. Perhaps it is reasonable to think that local polarisation reinforced the national phenomenon and vice versa, but in any case it is difficult to argue that a fall in the living conditions of the extreme poor triggered the revolt.. u This index is Ps=(4/Ln21m)Ei Fj Pa iPj I LnIi-Lnlj where Ln2Im is the natural logarithm of twice the average income, Pi is the population share of income class i and Lnli is the natural logarithm of income of individual i. This equation is very similar to the one that defines the Podder relative deprivation index, except for the squared Pi and the fact that all comparisons between rich and poor are considered. u The index weights the comparisons between the poor and the rich using the natural logarithm of income of the poor individual. Zero weight is attached to the comparison of a rich agent with a poor person. The index becomes Ps = Ei 1j P2iPj (Ln Ii)1LnIi-Lnlj for li<lj. In this case no homogenisation of the index is done (the index do not range from zero to one) so richer deprived agents in a polarised society are more prone to rebel. 36 This information is not strictly comparable to the previous indexes since national census and household surveys do not use the same defmition of income. However, although the level of the indexes differ the broad changes in them are captured by the data. It should be remarked that since 1995 incorporates the effects of the 1994 December crisis the indexes overestimate the extent of poverty, relative deprivation and polarisation at the beginning of 1994, so a note of caution is due before any interpretation. The only clear cut result seems to be that extreme poverty did not mercase in Chiapas before the zapatista uprising.. 18.
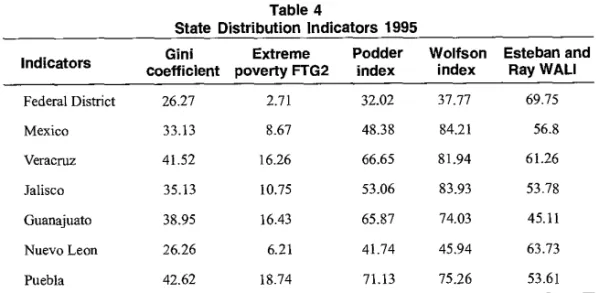
(21) WELL-BEING AND SOCIAL POLICY VOL 4, NUM. 1, pp. 1-27 Figure 4 Poverty, Relative Deprivation and Polarization Indicators in Chiapas 1990, 1995 Esteban and Ray (WALI) Wolfson polarization index Podder relative deprivation índex. FGT2 extreme poverty. o. 20. 40. 60. • 1990. ■1995. 80. 100. Source: Own calculations with census data 1990, 1995, INEGI.. If local and national polarisation reinforce each other, an interesting question emerges. Which states are prone to social conflict? Table 4 shows the states with the larger indexes of relative deprivation and polarisation to answer this question. It includes inequality and extreme poverty indexes to confirm that high poverty and inequality are not always associated with high relative deprivation and polarisation. The Esteban and Ray proposition that polarisation among small populations is smaller than among larger groups determined the ranking of states." The more populated states exhibit the largest probability of organised civil violence. It is interesting to notice that two of the poorest states, Oaxaca and Guerrero are not among those more prone to social conflict in 1995. However, in 1996 the EPR operated in those states." The explanation of a low Esteban and Ray WALI ofpotential revolt in Oaxaca and Guerrero is poverty. Those states have very high relative deprivation and polarisation indicators39 but with a single index that combines the available resources of the polarised and deprived groups, the probability of revolt falls. There is no information at state level for 1996 but it is possible that the Esteban and Ray indicator rose when the GDP regained positive growth rates at the beginning of 1996. If so, it seems that economic recovery, combined with very high relative deprivation and polarisation could also have triggered the EPR uprising.. So the WALI multiplied by population was used to determine the ranking. See Esteban and Ray (1994, p.848). EPR attacks were also reported in states of Mexico, Guanajuato, Veracruz, Tabasco and Chiapas. The EPR declared rebel forces were present in the Federal District and unidentified guerrilla activity was detected in Puebla. 39 For 1995 the Podder and Wolfson indexes are 78.10 and 83.22 for Oaxaca, and 87.37 and 71.16 for Guerrero. 37. 38. 19.
(22) ECONOMIC POLARISATION AND GOVERNABILITY IN MEXICO. Table 4 State Distribution Indicators 1995 Indicators. Extreme Gini coefficient poverty FTG2. Podder index. Wolfson index. Esteban and Ray WALI. Federal District. 26.27. 2.71. 32.02. 37.77. 69.75. Mexico. 33.13. 8.67. 48.38. 84.21. 56.8. Veracruz. 41.52. 16.26. 66.65. 81.94. 61.26. Jalisco. 35.13. 10.75. 53.06. 83.93. 53.78. Guanajuato. 38.95. 16.43. 65.87. 74.03. 45.11. Nuevo Leon. 26.26. 6.21. 41.74. 45.94. 63.73. Puebla. 42.62. 18.74. 71.13. 75.26. 53.61. Source: Own calculations with censes data 1995, INEGI.. 8. Causes and Consequences of Relative Deprivation and Economic Polarisation It is beyond the scope of this paper to explain the origins of relative deprivation and economic polarisation as measured by the indexes reported.4° However, there is a recurrent piece of evidence associated with a sharper economic division of society. After economic liberalisation in Mexico human capital differences are the single most important variable explaining poverty and inequality.41 Labour income plays a key role in understanding the evolution of inequality and poverty, but also for relative deprivation and polarisation. Different analysis point that the institutional and technological change of the Mexican economy in recent years has substituted capital for non skilled labour, thus decreasing the demand for low education and little experienced workers." The implication of this is that the agricultura! sector, with low education levels and a young and rapidly growing labour force will be lagging regarding the rest of the economy. There is a relative gap between average wage eamings and agricultura) wage eamings but the gap between skilled and non skilled labour is a general one. Figure 5 shows the relative stability of income eamers' composition by education levels, the decreasing income share oflow education eamers and the growing income share ofhigh education eamers.. " Unlike inequality and poverty indexes, relative deprivation and polarisation indicators are not yet amenable to decomposition analysis that will allow to explain the relative importance of different factors attached to the m. 61 Szekely (1998) decomposes various inequality and poverty indexes to examine the causes of these phenomena and concludes that, from 1984 to 1992, 73.3% of the increase in economic inequality is explained by the differences in education levels and 52.0 of the changes in poverty arise because of occupational characteristics related to human capital. See Epelbaum and Cragg (1997). Dietz (1995, p.78) identifies the substitution of thechnology for unskilled labor in Chiapas since the mid-1970s.. 20.
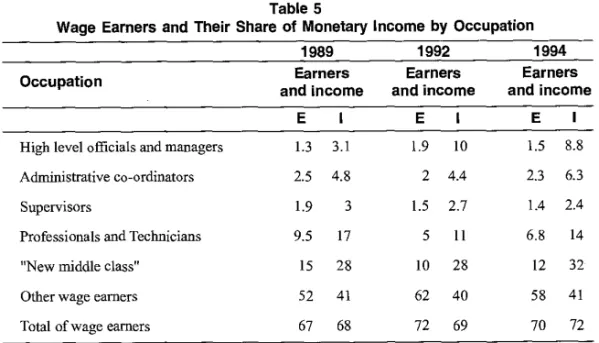
(23) WELL-BEING AND SOCIAL POLICY VOL 4, NUM. 1, pp. 1-27 Figure 5 Income Earners and their Income Share by Education Levels 40%. 30%. 20%. 10%. 0% 1992. 1989. 1994. $ Income eamers with less than primary education ■ Income share of eamers with less than primary education ■ Income eamer with higher education ■ Income share of eamers with higher education Source: Own calculations with information from ENIGH 1989, 1992, 1994, INEGI.. This relative distance between skilled and non skilled labour is also present in the composition of the labour force. Table 5 shows wage earners by occupation and their monetary income share. Wage earners with high skills and decision making jobs, sometimes called the "new middle class"' representa decreasing percentage of total earners' population but with a growing share of monetary income. However, not only there is a growing distance between the new middle class and the rest of wage earners. High level officials, managers and administrative co-ordinators represent an almost constant share of total eamers but with a growing share of total monetary income. Supervisors, professionals and technicians decrease their income and earners share. No attempt is done to reduce the very complex phenomena of relative deprivation and polarisation to a single factor. However, as in the case of poverty and inequality, an attractive hypothesis to explore is the human capital returns contribution to the increasing distance between skilled and non skilled labour, and then to a sharp division of society. Perhaps a more important point than the origins ofrelative deprivation and polarisation is the consequences of civil violence for social policy. Here the hypothesis is that if rebellion does not depend on an increase in poverty but on the joint contribution of relative deprivation and polarisation, then social policies oriented to respond to potential conflict will not coincide with the alleviation ofpoverty.. " See Wrigth (1986).. 21.
(24) ECONOMIC POLARISATION ANO GOVERNABILITY IN MEXICO. Table 5 Wage Earners and Their Share of Monetary Income by Occupation. Occupation. 1989 Earners and income. 1992 Earners and income. 1994 Earners and income. E. 1. E. 1. E. 1. High level officials and managers. 1.3. 3.1. 1.9. 10. 1.5. 8.8. Administrative co-ordinators. 2.5. 4.8. 2. 4.4. 2.3. 6.3. Supervisors. 1.9. 3. 1.5. 2.7. 1.4. 2.4. Professionals and Technicians. 9.5. 17. 5. 11. 6.8. 14. "New middle class". 15. 28. 10. 28. 12. 32. Other wage earners. 52. 41. 62. 40. 58. 41. Total of wage earners. 67. 68. 72. 69. 70. 72. Source: Own calculations with information of ENIGH 1984,1989,1992,1994, INEGI.. Figure 6 shows the targeting errors of poverty-reduction public spending before and alter the zapatista uprising." A targeting error is the difference between a state's share in national poverty and its share in total poverty-reduction expenditure." Scott and Bloom (1996) detected that social expenditure became more progressive from 1990 to 1995. Seventeen states reduced their targeting errors and the total sum of errors decreased. Table 6 presents the targeting characteristics of poverty-reduction expenditure.46 From 1990 to 1994 the Mexican government reduced the average targeting error by correcting over-expending ' but increased the share under-expending errors. Not all targeting errors were reduced by the same amount. Chiapas almost completely corrected its difference between its share of social expenditure and its poverty share. The poorest six states got better targeting, but they did not benefit as much as Chiapas. The correction of under-spending errors of the poorest states only contributed 39% to the 'reduction of total targeting errors. However, the general association between targets and instruments increased, as measured by correlation coefficient between poverty and social expenditure. This means that the change in targeting errors did translate in a more consistent allocation rule. " Only targeting errors at state level are considered, wich under-estimates possible deviations from poverty targets due to intra-state errors. A detailed evaluation of targeting policies is not currently available. This is done for Levy's (1994) extreme poverty line of 16.61 dollars per person per month at 1984 prices using the average free exchange rate. The Foster-Greer-Thorbecke index with squared terms is used to measure poverty shares. Ravallion and Chao (1989) show that targeting by poverty shares is not the optimal strategy (see Scott and Bloom 1997). However it is the easiest one and the one finally adopted by the Mexican government. " To measure the shares of targeting errors and the general index the sum of squared errors was used to attach more weight to the largest mistakes. The index used is E = 1/21j 1 el 12 , and e= FGTsi - Gsi. FGTsi is the poverty share of state i and Gsi is the expenditure share of state i. This index ranges from zero (perfect targeting) to one (all expenditure is allocated to a zero poverty state). The Federal District was excluded from this calculations.. 22.
(25) WELL-BEING AND SOCIAL POLICY VOL 4, NUM. 1, pp. 1-27 Figure 6 Targeting Errors of Poverty-Education Social Expenditure Baja C Colima Aguascalientes. Veracruz Mexico Puebla Guerrero. 7. BC.Sur. Michoacan Oaxaca. 4. Quintana Roo. Chiapas. Coahuila. Guanajuato. Sonora \ Ir • cc„,. Campeche. Jalisco Hidalgo. Nayarit Morelos. Zacatecas. Sinaloa. Chihuahua. Tamaulipas. San Luis Potosi. Tlaxcala Queretaro. Lu . catan Tabasco Durango Nuevo Y. • 1990. • 1995. calculations with census data 1990, 1995, INEGI, and data of primer informe de gobierno 1995 and segundo informe de gobierno 1990.. Source: Own. Table 6 Targeting Characteristics of Poverty-Reduction Expenditure Characteristics. 1990. 1995. % Change. Average targeting error (% points). 1.97. 1.46. -25.71. Share over-spending errors (%). 45.1. 18.5. -58.92. Share of under-spending errors (%). 54.9. 81.5. 48.38. Share of errors of poorest states (%). 45.2. 62.6. 38.47. Chiapas error share (%). 2.61. 0.27. -89.66. Correlation poverty-social expenditure. 51.7. 69.4. 35.05. Índex of targeting errors. 1.92. 0.68. -64.58. Source: Own calculations with census data 1990, 1995, INEGI, and data of primer informe de gobierno 1995 and segundo informe de gobierno 1990.. 23.
(26) ECONOMIC POLARISATION AND GOVERNABILITY IN MEXICO. When the largest targeting errors are weighted more than the small mistakes, the index of targeting errors shows a very substantial improvement in poverty-reduction policies. The states of Puebla, Guerrero, Michoacan, Hidalgo and Chiapas had themost important correction of underspending errors. Although Veracruz and Mexico have the largest shares of national poverty and Oaxaca is also a very important contributor to poverty, they did suffer an increase in underspending errors. Over-spending was corrected mainly in San Luis Potosi, Nuevo Leon and Tabasco. We can conclude that even when targeting improved from 1990 to 1995, after the zapatista rebellion the poorest states continue to suffer a severe problem of under-spending. Chiapas clearly got an advantage over less conflictive states. It seems that the EZLN uprising directed social expenditure over governability and not over poverty problems.. 9. Concluding Remarks In January 1996, after seven months of peace negotiations with the EZLN and before the EPR activity, the Mexican government officially announced that the main part of the poverty-reduction expenditure (the so called Ramo 26) would be allocated among states according to explicit poverty criteria. The relative reduction of immediate governability pressures and the prospect of future stability brought a significant improvement in targeting practices for social policy. However, Ramo 26 real expenditure decreased 20.7% from 1994 to 1997 and under-spending errors prevailed in the poorest states after the EPR attacks. No poverty-reduction plan was announced until mid 1997, when it was clear that Ramo 26 was no longer the axis of social policy towards the poor. The new plan PROGRESA (Programa de Educación, Salud y Alimentación) tried to link school and health clinic attendance with a cash transfer to buy food. The available studies evaluating the program (see SEDESOL, 2000) show less targeting errors with this strategy, now called Oportunidades. The considerable reduction in civil violence episodes has strengthen an efficiency view of social policy, against a governability perspective of poverty-reduction expenditure. On the other hand, if technological change and structural adjustment are behind the increases in polarisation, it seems that there are less agitated times ahead for the Mexican economy. First, the most important adjustment to global technology, trough trade liberalisation, has already been done. Future technological change is likely to be less traumatic. Second, the main institutional changes trough privatisation and economic deregulation are almost complete. Only the labour market reform could significatively change the relative retums of skilled and non-skilled labour, but even in this case the informal economy is already giving flexibility to the price of low human capital labour. In any case, investment to reduce education differentials could be very important to avoid future cases of organised civil violence. Unfortunately, the possible improvement in the targeting of poverty-reduction expenditure and the potential decline in economic polarisation do not seem to affect the chances of a rapid solution to the Chiapas conflict. On one hand, targeted benefits are difficult to sustain in the conflict zones. Not only operational problems, but political barriers arise. The new benefits could erode the base that supports the EZLN, so they will be blocked. It is likely that the targeted benefits will reach non supporters of the zapatista rebellion or undecided individuals, thus maintaining or increasing political divisions in the state. On the other hand, even when economic polarisation decreases, the optimal rebel strategy is to commit to maximum social change. If the. 24.
(27) WELL-BEING AND SOCIAL POLICY VOL 4, NUM. 1, pp. 1-27. rebel leaders show indecisiveness their base of supporters will be frustrated and it will seek stronger leadership. Polarisation among the rebel coalition could lead to new episodes of civil violence, but this time not so well organised.. 25.
Figure
Documento similar
In the fourth stage, the IPCC is again present with its V Report (with much less coverage than the previous one), and there are several events (commitments of countries of
(5) In words, economic growth at the country level is a weighted sum of the sector-level economic growths, where the weights are the relative output shares of the sectors at the
The coefficients of the proxy for household income are negative for kerosene, solar and others implying that with an increase in income, households are less likely to
This study is aimed to foster employment and development in the European Union as a whole, and particular in those countries with lower rates of employment and real income
economic inequality on health and wellbeing are summarized. Moreover, a review of the psychological effects of economic inequality is presented, and their relationship
In the preparation of this report, the Venice Commission has relied on the comments of its rapporteurs; its recently adopted Report on Respect for Democracy, Human Rights and the Rule
Analyzing the impact of institutional factors, capital accumulation (human and physical), foreign investment, economic growth and other indicators of economic development, it
The areas of the economic freedom index “Size of Govern- ment: Expenditures, Taxes and Enterprises” published by the Economic Freedom Network from the year 2000 to the year 2009,
