Dendrochronological contrast of flood caused growth differences among four urban ecosystem tree species in New Orleans, Louisiana, USA
29
0
0
Texto completo
(2) i. ZAMORANO SOCIOECONOMIC DEVELOPMENT AND ENVIRONMENT. Dendrochronological contrast of flood-caused growth differences among four urban ecosystem tree species in New Orleans, Louisiana, USA Special project submitted as partial requirement for eligibility for the Engineering degree in Socioeconomic Development and Environment at the Bachelor's level. Presented by. José Alfredo Escobar Sandoval. Zamorano, Honduras December, 2010.
(3) ii. Dendrochronological contrast of flood-caused growth differences among four urban ecosystem tree species in New Orleans, Louisiana, USA Presented by:. José Alfredo Escobar Sandoval. Approved:. _____________________ Timothy Longwell, M.Sc. Advisor. ____________________ Arie Sanders, M.Sc. Director Socioeconomic Development and Environment. _____________________ Jose Medina, Ing. Secondary Advisor. _____________________ Raúl Espinal, Ph.D. Academic Dean. ____________________ Kenneth L. Hoadley, D.B.A. President.
(4) iii. ABSTRACT. Escobar, J. 2010. Dendrochronological contrast of flood-caused growth differences among four urban ecosystem tree species in New Orleans, Louisiana, USA. Special graduation project for the Engineering degree in Socioeconomic Development and Environment, Pan-american Agricultural School, Zamorano, Honduras. 29p.. This study evaluates the effects on urban tree growth in different regimes of flooding caused by Hurricane Katrina in August and September of 2005 in the southeastern U.S. coast. The comparative analysis was done by taking core samples of four tree species: Green Ash (Fraxinus pennsylvanica), Loblolly Pine (Pinus taeda), American Sycamore (Platanus occidentalis), and Water Oak (Quercus nigra). The study evaluated the effect of long and short-term flooding on average annual diameter growth; by measuring growth rings between 2003 and 2008. In long-term flooding there was up to a 70% reduction in Green Ash diameter growth with p<0.10. Loblolly Pine was not impacted in terms of diameter growth; however, American Sycamore did experience growth reductions. Conversely, Water Oak showed a 98% increase in growth ring patterns in 2008 with p<0.01. This implies that the effects of flooding are species dependent based on their auto ecology. Key words: Dendrochronology, flooding, growth rates, Hurricane Katrina..
(5) iv. TABLE OF CONTENTS Title page ................................................................................................................. i Signature page ........................................................................................................ ii Abstract ................................................................................................................. iii Table of Contents ................................................................................................... iv Index of Tables, Figures, and Appendices ............................................................... v. 1.. INTRODUCTION .................................................................................................. 7. 2.. URBAN ECOSYSTEM TREE SPECIES IN NEW ORLEANS ......................... 11. 3.. METHODOLOGY ............................................................................................... 15. 4.. RESULTS AND DISCUSIONS ........................................................................... 17. 5.. CONCLUSIONS................................................................................................... 20. 6.. RECOMENDATIONS ......................................................................................... 21. 7.. REFERENCES…..………….………………………………………………..…….22. 8.. APPENDICES……………………………...………………………………………23.
(6) v. INDEX OF TABLES, FIGURES AND APPENDICES Table 1. 2. 3. 4. 5.. Page. General characteristics of Platanus occidentalis L. .................................................. 11 General characteristics of Fraxinus pennsylvanica Marsh. ....................................... 12 General characteristics of Pinus taeda L. ................................................................. 13 General characteristics of Quercus nigra L. ............................................................. 14 Growth rate means of the different species and treatments under short- and longterm flooding regimes during 2003-2008. ................................................................ 19. Figure. Page. 1. New Orleans flooding map. August 31st 2005 .......................................................... 9 2. New Orleans flooding map. September 14th 2005 .................................................... 9 3. Fraxinus pennsylvanica Marsh. - Green ash ............................................................ 12 4. Pinus taeda L. - Loblolly pine ................................................................................. 13 5. Quercus nigra L. - Water oak .................................................................................. 14 6. Flooding regimes in New Orleans, LA..................................................................... 16 7. Annual Growth Rate Means for Green Ash.............................................................. 17 8. Annual Growth Rate Means for Loblolly Pine. ........................................................ 17 9. Annual Growth Rate Means for American Sycamore. .............................................. 18 10. Annual Growth Rate Means for Water Oak. ............................................................ 18. Appendix. Page. 1. Statistical analyses for annual diameter growth of Green Ash under short- and long-term flooding events per year. ......................................................................... 23 2. Statistical analyses for annual diameter growth of Loblolly Pine under short- and long-term flooding events per year. ......................................................................... 24 3. Statistical analyses for annual diameter growth of American Sycamore under short- and long-term flooding events per year. ......................................................... 25 4. Statistical analyses for annual diameter growth of Water Oak under short- and long-term flooding events per year. ......................................................................... 26 5. Resumen Ejecutivo de Investigación………………………………………………...27.
(7) 7. 1. INTRODUCTION Nearly constant change in climate and physical phenomena can be catalyzed by human impacts. These manifestations of the problems caused man’s interaction with the global environment have been coined "Climate Change." Climate Change could lead to changes in the frequency and intensity of hurricanes and tropical storms affecting the Atlantic coastal area and specifically the Gulf of Mexico (Chambers 2010). Hurricane Katrina was one of the deadliest, destructive and costly hurricanes to impact the United States in decades. Katrina was the third strongest storm of the 2005 Atlantic hurricane season, hitting southern and central United States in August 2005 (USDHS 2005). It caused extensive damage in Florida, the Bahamas, and especially in Louisiana and Mississippi, including massive physical destruction and severe flooding. At landfall on the Louisiana coast on Aug. 29 Katrina turned into a Category 3 hurricane and passed directly across the city of New Orleans, causing great devastation both there and in nearby areas (NOAA 2005). Hurricane Katrina killed 1,836 people, making it the deadliest hurricane in U.S. since the 1928 Okeechobee Hurricane. Additionally it is estimated that Katrina caused 75 billion dollars of damage to property, becoming the costliest hurricane in U.S. history (USDHS 2005). It is commonly known that community composition and relative growth rates of urban trees are affected by such Climate Change motivated effects (Chambers 2010). Tree-ring analysis can be used to decipher such changes in radial growth within urban ecosystems.. 1.1. STATEMENT OF PROBLEM. The coastal zone of Louisiana and several large urban areas, including New Orleans and Baton Rouge were affected by Hurricane Katrina. In New Orleans, this hurricane flooded 80% of the urban area for periods of six weeks of the year. Therefore changes that might occur because of the aforementioned hurricane and its consequences, such as flooding impacts will be studied (Chambers 2010). It is widely known that trees in the Urban Ecosystem Area in New Orleans were affected by flooding events which could impact their normal annual growth. The degree to which these flooding events impacted the urban forest growth is the subject of this thesis..
(8) 88 1.2. BACKGROUND. Trees take many years to develop and mature. The urban ecosystem environment is especially harsh on tree growth because of the constant modification of the environment such us human-caused pollution, pruning of roots and branches of trees, soil compaction, but additional impacts of tropical storms and other results of Climate Change could affect survival and growth in future years (Chambers 2010). Such growth impacts are likely to differ among tree species. This impact on growth phenomena specifically caused by Hurricane Katrina has not been completely documented, so it is important to make a descriptive and exploratory research study on forest growth and development of urban ecosystems in Louisiana as a precursor to a possible environmental valuation of hurricanes on the urban areas in Louisiana, USA. An additional environmental disturbance in New Orleans, Louisiana was caused by Hurricane Katrina with flooding regimes (NOAA 2005). According to those disturbances apparently almost all of trees in New Orleans had experimented differences in growth rates. This research is important for knowing if there is a normal growing rate in 2005 and 2006 years despite the Hurricane Katrina event. This descriptive research study focuses on growth differences among four forest species in urban areas of New Orleans, Louisiana, USA between 2003 and 2008.. 1.2.1 New Orleans context Hurricane Katrina was one of the strongest storms to impact the coast of the United States during the last 100 years. With sustained winds during landfall of 125 mph (110 kts) (a strong category 3 hurricane on the Saffir-Simpson scale) and minimum central pressure the third lowest on record at landfall (920 mb). Katrina caused widespread devastation along the central Gulf Coast states of the US. Cities such as New Orleans, LA, Mobile, AL, and Gulfport, MS bore the brunt of Katrina's force and will need at least five years of recovery efforts to restore normality (NOAA 2005). According to National Oceanic and Atmospheric Administration NOAA (2005) and Jim Chambers (2010) those flooding regimes were: 2-4 feet for 2 weeks and 7-9 feet for 4 weeks as seen on Figure 1 and 2. Definitely any natural factor or disturbance will directly affect the growth ring patterns in hardwood trees (Chambers 2010). The loss of life and property damage was worsened by breaks in the levees that separate New Orleans from surrounding lakes. At least 80% of New Orleans was under flood water on August 31st, largely as a result of levee failures from Lake Pontchartrain. The combination of strong winds, heavy rainfall and storm surge led to breaks in the earthen levee after the storm passed, leaving some parts of New Orleans under 20 feet of water (NOAA 2005). Accordingly a toll caused by Hurricane Katrina would influence significantly the growth of trees in the urban area of New Orleans..
(9) 9 Estimates for damages for Hurricane Katrina at the beginning were extremely preliminary and properly assessing losses took six months. However, the total losses as a result of Katrina are estimated to exceed $100 billion with over $34 billion in insured losses (NOAA 2005). New Orleans is still under reconstruction as was seen during the process of collecting data in spring 2010.. Figure 1. New Orleans flooding map. August 31st 2005 Source: NOAA 2005.. Figure 2. New Orleans flooding map. September 14th 2005 Source: NOAA 2005..
(10) 10 1.2.2 Objectives The general objective of the study was to evaluate the diameter growth impact caused by Hurricane Katrina in the last six years in New Orleans, Louisiana, USA.. The specific objectives of the study were: To evaluate if climatic factors such as hurricanes impact urban forest population growth rates. To determine if flooding cause changes in tree growth patterns. To contrast radial growth in four urban trees before and after hurricane Katrina exposure as a result of flood for 2 or 4 weeks in South Louisiana urban ecosystems, USA.. 1.3. STATEMENT OF APPROACH. Specific research questions for the different objectives included: Do climatic factors such as hurricanes disturb urban forest populations? Can flooding hinder tree growth patterns? How can patterns of forest growth due to flooding be evaluated?. 1.4. FLOODING EFFECTS ON TREE GROWTH. Every process of flooding affects soils by altering its structure, depleting O2, increasing levels of CO2, inducing anaerobic decomposition of organic matter, and reducing iron and manganese availability. Flooding with fresh or saline water affects the distribution of many woody plants because it inhibits seed germination as well as vegetative and reproductive growth, it alters plant anatomy, and induces plant mortality. In nonhalophytes, water logging suppresses leaf formation and expansion of leaves and internodes, causes premature leaf abscission and senescence, induces shoot dieback, and generally decreases cambial growth (Kozlowski 1997). Flood damage to trees develops in three primary ways: 1) acute soil and tree changes because of saturated and inundated soil conditions; 2) flood water physically knocking over trees; and, 3) chronic problems associated with a changing environment and modified tree reactivity (Coder 1994)..
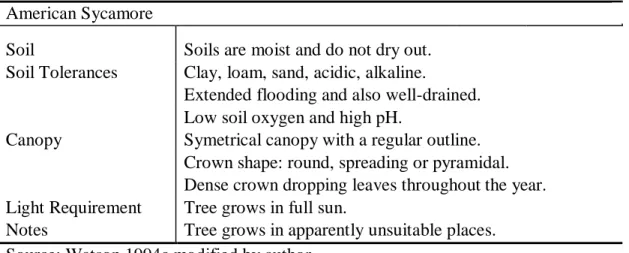
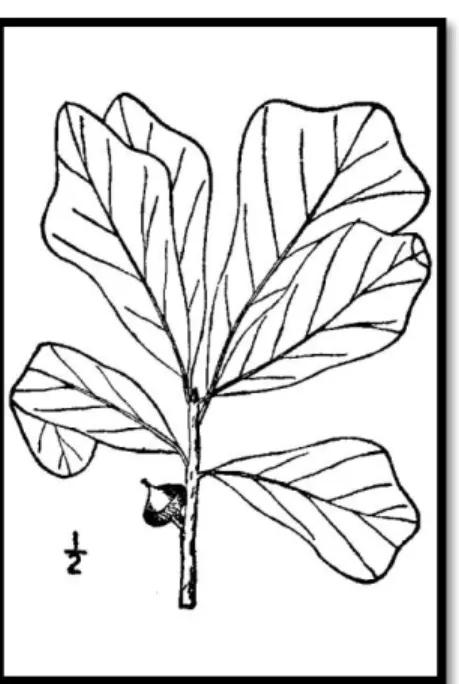
(11) 11. 2. URBAN ECOSYSTEM TREE SPECIES IN NEW ORLEANS There are more than 30 tree species in urban areas of New Orleans Louisiana (Chambers 2010); this study is based on four species that were the most common and representative in every area of study. Those species are: Green Ash (Fraxinus pennsylvanica), Loblolly Pine (Pinus taeda), American Sycamore (Platanus occidentalis), Water Oak (Quercus nigra).. 2.1. AMERICAN SYCAMORE. The American Sycamore (Platanus occidentalis) also known as sycamore is a common species of the family Platanaceae. It is commonly found in the Southeastern zone of The United States (USDA 2010). Table 1. General characteristics of Platanus occidentalis L. American Sycamore Soil Soil Tolerances. Soils are moist and do not dry out. Clay, loam, sand, acidic, alkaline. Extended flooding and also well-drained. Low soil oxygen and high pH. Canopy Symetrical canopy with a regular outline. Crown shape: round, spreading or pyramidal. Dense crown dropping leaves throughout the year. Light Requirement Tree grows in full sun. Notes Tree grows in apparently unsuitable places. Source: Watson 1994c modified by author..
(12) 12 12 2.2. GREEN ASH. The Green Ash (Fraxinus pennsylvanica) is a common species of the family Oleaceae; Olive family (USDA 2010). Table 2. General characteristics of Fraxinus pennsylvanica Marsh. Green Ash Soil Soil Tolerances. Flooded and wet soils. Texture: Medium. Clay, loam, sand, acidic, alkaline. Extended flooding and also well-drained. Low soil oxygen and high pH, salt and droughty sites. Canopy Symmetrical canopy with a regular outline. Crown shape: oval or upright. Dense crown with fast growth rate. Light Requirement Tree grows in full sun. Notes Tree grows in apparently unsuitable places. Source: Watson 1994a modified by author.. Figure 3. Fraxinus pennsylvanica Marsh. - Green ash Source: USDA NRCS. Wetland flora: Field office illustrated guide to plant species. USDA Natural Resources Conservation Service. Provided by NRCS National Wetland Team, Fort Worth, TX..
(13) 13 13 2.3. LOBLOLLY PINE. The Loblolly Pine (Pinus taeda) is a common species of family Pinaceae widely found in the Eastern zone of The United States (USDA 2010). Table 3. General characteristics of Pinus taeda L. Loblolly Pine Soil Soil Tolerances Canopy. Not flooded soils. Texture: Fine. Low soil oxygen and high pH. Irregular outline. Crown shape: oval. Open crown with fast growth rate. Light Requirement Tree grows in full sun. Notes Tree grows in apparently unsuitable places. Source: Watson 1994b modified by author.. Figure 4. Pinus taeda L. - Loblolly pine Source: Britton, N.L., and A. Brown. 1913. An illustrated flora of the northern United States, Canada and the British Possessions. Vol. 1: 59. Courtesy of Kentucky Native Plant Society. Scanned by Omnitek Inc..
(14) 14 14 2.4. WATER OAK. The Water Oak (Quercus nigra) is a common species of family Fagaceae and commonly found in Louisiana (USDA 2010). Table 4. General characteristics of Quercus nigra L. Water Oak Soil Flooded and wet soils. Texture: Medium. Soil Tolerances Clay, loam, sand, acidic, alkaline. Extended flooding and also well-drained. Low soil oxygen and high pH, salt and droughty sites. Canopy Symmetrical canopy with a regular outline Crown shape: spreading. Moderate crown density with fast growth rate. Light Requirement Tree grows in full sun. Source: Watson 1994d modified by author.. Figure 5. Quercus nigra L. - Water oak Source: Britton, N.L., and A. Brown. 1913. An illustrated flora of the northern United States, Canada and the British Possessions. Vol. 1: 621. Courtesy of Kentucky Native Plant Society. Scanned by Omnitek Inc..
(15) 15. 3. METHODOLOGY 3.1. FIELDWORK. The experiment was conducted in New Orleans, Louisiana, USA. The study represents two treatments: SF Short Term Flooding, shallow flood: 2-4 feet for 2 weeks. Replications: South Carrollton (SCAROL), Broadmoor (BM), Mid City (MC). LF Long Term Flooding, deeper water: 7-9 feet for 4 weeks. Replications: St. Bernard Parish (SBP), Lake View (LV), Gentilly (GT). Four hardwood tree species were chosen from urban areas of New Orleans, LA, USA. These species are: Green Ash (Fraxinus pennsylvanica), Loblolly Pine (Pinus taeda), American Sycamore (Platanus occidentalis), Water Oak (Quercus nigra). Each species were core-sampled at two flood impact regimes with a height on tree of one meter, taking two cores from each individual; short term flooding for two weeks and flooding of four to six weeks. Each flood condition was replicated 3 times having four individuals core-sampled per replication and 48 individuals cored of four species per treatment. Trees were sampled with an increment borer to a depth exceeding 10 years of growth. Each species were core-sampled in four individuals in each replication producing 24 coresampled individuals per species in total..
(16) 16. Figure 6. Flooding regimes in New Orleans, LA Source: Google Maps 2010. 3.2. LABORATORY ANALYSES. The research involved the evaluation of Hurricane Katrina flooding on urban trees in New Orleans area. Increment cores from sample trees were collected in various areas of New Orleans, using GIS to locate sample trees. Coring was completed using a power coring drill, after 24 hours they were mounted (all cores) and measured by Dendrochronology techniques in the School of Renewable of Natural Resources at Louisiana State University. Missing and false rings were identified through cross dating, and results were entered in data sets in Microsoft Excel for statistical analysis. Core-samples were taken exceeding a depth of 10 years (growth rings) per core..
(17) 17. 4. RESULTS AND DISCUSSIONS GREEN ASH Growth ring diameters (cm). 4.1. 15.000 10.000 5.000 0.000 SF LF SF LF SF LF SF LF SF LF SF LF 2003 2003 2004 2004 2005 2005 2006 2006 2007 2007 2008 2008 Treatments and Years. Figure 7. Annual Growth Rate Means for Green Ash. Notes: SF = Short Term Flooding; LF = Long Term Flooding. For Green Ash, as illustrated in Appendix A, during 2006, 2007 and 2008 there is a significant difference within years separated by flooding events. Therefore it can be seen that there are differences in averages of 70% reduced growth ring patterns in 2006, 55% of reduction in growth ring patterns on 2007 and a 46% reduction in 2008; those differences can be seen on Figure 8.. LOBLOLLY PINE Growth ring diameters (cm). 4.2. 5.000 4.000 3.000 2.000 1.000 0.000 SF LF SF LF SF LF SF LF SF LF SF LF 2003 2003 2004 2004 2005 2005 2006 2006 2007 2007 2008 2008 Treatments and Years. Figure 8. Annual Growth Rate Means for Loblolly Pine. Notes: SF = Short Term Flooding; LF = Long Term Flooding..
(18) 18 18 For Loblolly Pine, it is shown on Appendix B, during 2006 and 2008 there are significant differences within years separated by flooding events. Therefore it can be seen that there are differences in means of 37% reduced growth ring patterns in 2006, and 31% of reduction in growth ring patterns on 2007 those differences can be seen on Figure 9.. AMERICAN SYCAMORE Growth ring diameters (cm). 4.3. 12.000 10.000 8.000 6.000 4.000 2.000 0.000 SF LF SF LF SF LF SF LF SF LF SF LF 2003 2003 2004 2004 2005 2005 2006 2006 2007 2007 2008 2008 Treatments and Years. Figure 9. Annual Growth Rate Means for American Sycamore. Notes: SF = Short Term Flooding; LF = Long Term Flooding. For American Sycamore, as illustrated in Appendix C, during 2006, 2007 and 2008 there are significant differences within years separated by flooding events. Therefore it can be seen that there are differences in averages of 24% reduced growth ring patterns in 2006, 55% of reduction in growth ring patterns on 2007 and a 61% reduction in 2008; those differences can be seen on Figure 10.. WATER OAK. Growth ring diameters (cm). 4.4. 10.000 8.000 6.000 4.000 2.000 0.000. SF LF SF LF SF LF SF LF SF LF SF LF 2003 2003 2004 2004 2005 2005 2006 2006 2007 2007 2008 2008 Treatments and Years. Figure 10. Annual Growth Rate Means for Water Oak. Notes: SF = Short Term Flooding; LF = Long Term Flooding..
(19) 19 19 For Water Oak, as illustrated in Appendix D, during 2008 there is a significant difference within years separated by flooding events. Therefore it can be seen that there is a difference in average of 98% in increasing growth ring patterns in 2008, the rest of them were decreasing in growth ring patterns in 2006 and 2007; those differences can be seen on Figure 11.. Table 5. Growth rate means of the different species and treatments under short- and longterm flooding regimes during 2003-2008. Year Growth Rates. FRPE 2003 2004 2005 2006 2007 2008. 10.118 8.084 7.305 4.746*** 7.631** 7.259**. Short-term Flooding Species PITA PLOC QUNI 3.427 3.12 3.139 2.696 3.473* 3.102. 8.128 7.635 6.037 4.027 4.521* 5.196*. 7.329 7.066 6.415 3.509 5.472 (5.939)***. FRPE 8.874 6.848 5.252 1.471*** 3.385** 3.925**. Long-term Flooding Species PITA PLOC QUNI 3.17 3.312 2.505 1.69 2.382* 3.618. 3.959 4.176 3.398 3.201 2.037* 2.023*. 9.803 9.965 7.396 3.416 6.467 (11.168)***. Notes: FRPE (Fraxinus pennsylvanica); PITA (Pinus taeda); PLOC (Platanus occidentalis); QUNI (Quercus nigra). Means with the same number of * for each species were significantly different among flooding regimes comparing the same species in each year. Significance of: * = 90%; ** = 95%; *** = 99%. ()= increasing.
(20) 20. 5. CONCLUSIONS There is a significant difference between tree’s growth regimes in Long Term Flooding and Short Term Flooding areas. There is an impact on soil by flooding and after that occurrence, will directly affect trees in their growth patterns. All the impacts depend on flooding regimes and tree’s species. Each species will respond according to its eco-physiology and its interaction with the environment affected by flooding. There are more parameters to be evaluated on this contrasting study in order to establish a real impact of flooding on growth effects of those urban trees in New Orleans, LA. The occurrence of Hurricane Katrina affected growth patterns and it can be implied that flooding events of this kind of natural events can directly affect trees’ growth patterns..
(21) 21. 6. RECOMENDATIONS More parametric factors such as: Pruning of branches and roots of trees, constant pollution of environment; have to be included in this study in order to fulfill all the requirements of study and research of tree species that can affect their growth. Apply this methodology to evaluate the impact of natural or man caused disturbances, such as wildfire, floods, soil erosion in areas of Zamorano properties..
(22) 22. 7. REFERENCES Chambers, J. 2010. Forestry Program, School of Renewable Natural Resources, Louisiana State University. Coder, K. 1994. Flood damage to Trees. University of Georgia. 90p. Kozlowski, T. 1997. Responses of woody plants to flooding and salinity. Department of Environmental Science, Policy and Management, College of Natural Resources, University of California--Berkeley, Berkeley, CA 94720, USA. NOAA. 2005. Hurricane Katrina. Found in://www.katrina.noaa.gov/ USDHS. 2005. Louisiana Hurricane Katrina USDA. 2010. Plants Database. Natural Resources Conservation Service. 195p. Watson, E. 1994a. Fraxinus pennsylvanica Marsh. Associate professor, Environmental. Horticulture Department; Dennis G. Watson, associate professor, Agricultural Engineering Department, Cooperative Extension Service, Institute of Food and Agricultural Sciences, University of Florida, Gainesville FL 32611. 75p. Watson, E. 1994b. Pinus taeda L. Associate professor, Environmental Horticulture. Department; Dennis G. Watson, associate professor, Agricultural Engineering Department, Cooperative Extension Service, Institute of Food and Agricultural Sciences, University of Florida, Gainesville FL 32611. 75p. Watson, E. 1994c. Platanus occidentalis L. Sycamore. Associate professor, Environmental. Horticulture Department; Dennis G. Watson, associate professor, Agricultural Engineering Department, Cooperative Extension Service, Institute of Food and Agricultural Sciences, University of Florida, Gainesville FL 32611. 75p. Watson, E. 1994d. Quercus nigra L. Associate professor, Environmental Horticulture. Department; Dennis G. Watson, associate professor, Agricultural Engineering Department, Cooperative Extension Service, Institute of Food and Agricultural Sciences, University of Florida, Gainesville FL 32611. 75p.. In References: NOAA, National Oceanic and Atmospheric Administration; USDA, United States Department of Agriculture; USDHS, United States Department of Homeland Security..
(23) 23. 8. APPENDICES Appendix 1. Statistical analyses for annual diameter growth of Green Ash under shortand long-term flooding events per year. Group Statistics treatment rw03. rw04. rw05. rw06. rw07. rw08. N. Mean. Std. Deviation. Std. Error Mean. Short Term Flooding. 12. 10.11767. 5.817622. 1.679403. Long Term Flooding. 12. 8.87383. 4.662779. 1.346028. Short Term Flooding. 12. 8.08433. 6.553688. 1.891887. Long Term Flooding. 12. 6.84833. 2.609797. .753384. Short Term Flooding. 12. 7.30483. 4.594309. 1.326263. Long Term Flooding. 12. 5.25217. 2.523360. .728431. Short Term Flooding. 12. 4.745833. 2.8012315. .8086459. Long Term Flooding. 12. 1.470500. .9585926. .2767218. Short Term Flooding. 12. 7.63042. 5.560054. 1.605049. Long Term Flooding. 12. 3.38483. 1.902592. .549231. Short Term Flooding. 12. 7.25858. 5.093305. 1.470310. Long Term Flooding. 12. 3.92467. 2.125930. .613703. ANOVA Sum of Squares rw03. rw04. rw05. rw06. Between Groups. rw08. Mean Square 1. 9.283. Within Groups. 611.449. 22. 27.793. Total. 620.731. 23. 9.166. 1. 9.166. Within Groups. 547.381. 22. 24.881. Total. 556.547. 23. 25.281. 1. 25.281. Within Groups. 302.225. 22. 13.738. Total. 327.506. 23. 64.367. 1. 64.367 4.383. Between Groups. Between Groups. Between Groups Within Groups. rw07. df. 9.283. 96.424. 22. Total. 160.791. 23. Between Groups. 108.150. 1. 108.150. Within Groups. 379.875. 22. 17.267. Total. 488.024. 23. 66.690. 1. 66.690. Within Groups. 335.075. 22. 15.231. Total. 401.765. 23. Between Groups. F. Sig. .334. .569. .368. .550. 1.840. .189. 14.686. .001. 6.263. .020. 4.379. .048.
(24) 24 Appendix 2. Statistical analyses for annual diameter growth of Loblolly Pine under shortand long-term flooding events per year. Group Statistics treatment rw03. rw04. rw05. rw06. rw07. rw08. N. Mean. Std. Deviation. Std. Error Mean. Short Term Flooding. 12. 3.42700. 1.956600. .564822. Long Term Flooding. 12. 3.17050. 1.606470. .463748. Short Term Flooding. 12. 3.12013. 1.306449. .377139. Long Term Flooding. 12. 3.31150. 1.582500. .456828. Short Term Flooding. 12. 3.13862. 1.296106. .374153. Long Term Flooding. 12. 2.50450. 1.714840. .495032. Short Term Flooding. 12. 2.69642. 1.579518. .455968. Long Term Flooding. 12. 1.68983. 1.428714. .412434. Short Term Flooding. 12. 3.47300. 1.618604. .467251. Long Term Flooding. 12. 2.38233. 1.432443. .413511. Short Term Flooding. 12. 3.10192. 1.670301. .482174. Long Term Flooding. 12. 3.60392. 1.506937. .435015. ANOVA Sum of Squares rw03. rw04. rw05. rw06. rw07. rw08. Between Groups. df. Mean Square. .395. 1. .395. Within Groups. 70.499. 22. 3.205. Total. 70.894. 23. Between Groups. .220. 1. .220. Within Groups. 46.322. 22. 2.106. Total. 46.542. 23. Between Groups. 2.413. 1. 2.413. Within Groups. 50.826. 22. 2.310. Total. 53.239. 23. Between Groups. 6.079. 1. 6.079. Within Groups. 49.897. 22. 2.268. Total. 55.976. 23. Between Groups. 7.137. 1. 7.137. Within Groups. 51.389. 22. 2.336. Total. 58.527. 23. Between Groups. 1.512. 1. 1.512. Within Groups. 55.668. 22. 2.530. Total. 57.180. 23. F. Sig. .123. .729. .104. .750. 1.044. .318. 2.680. .116. 3.056. .094. .598. .448.
(25) 2525 Appendix 3. Statistical analyses for annual diameter growth of American Sycamore under short- and long-term flooding events per year. Group Statistics treatment rw03. rw04. rw05. rw06. rw07. rw08. N. Mean. Std. Deviation. Std. Error Mean. Short Term Flooding. 12. 8.12850. 6.539663. 1.887838. Long Term Flooding. 12. 3.95900. 2.441013. .704660. Short Term Flooding. 12. 7.63450. 5.976556. 1.725283. Long Term Flooding. 12. 4.17608. 1.897264. .547693. Short Term Flooding. 12. 6.03667. 5.368052. 1.549623. Long Term Flooding. 11. 3.39800. 2.044511. .616443. Short Term Flooding. 12. 4.02683. 3.996255. 1.153619. Long Term Flooding. 12. 3.20050. .838843. .242153. Short Term Flooding. 12. 4.52133. 4.478824. 1.292925. Long Term Flooding. 12. 2.03733. 1.023791. .295543. Short Term Flooding. 12. 5.19633. 5.401301. 1.559221. Long Term Flooding. 12. 2.02250. .982573. .283644. ANOVA Sum of Squares rw03. rw04. rw05. rw06. rw07. rw08. df. Mean Square. Between Groups. 104.308. 1. 104.308. Within Groups. 535.983. 22. 24.363. Total. 640.291. 23. Between Groups. 71.764. 1. 71.764. Within Groups. 432.507. 22. 19.659. Total. 504.271. 23. Between Groups. 39.959. 1. 39.959. Within Groups. 358.776. 21. 17.085. Total. 398.735. 22. Between Groups. 4.097. 1. 4.097. Within Groups. 183.411. 22. 8.337. Total. 187.508. 23. Between Groups. 37.022. 1. 37.022. Within Groups. 232.188. 22. 10.554. Total. 269.210. 23. Between Groups. 60.439. 1. 60.439. Within Groups. 331.535. 22. 15.070. Total. 391.974. 23. F. Sig.. 4.281. .050. 3.650. .069. 2.339. .141. .491. .491. 3.508. .074. 4.011. .058.
(26) 2626 Appendix 4. Statistical analyses for annual diameter growth of Water Oak under shortand long-term flooding events per year. Group Statistics treatment rw03. rw04. rw05. rw06. rw07. rw08. N. Mean. Std. Deviation. Std. Error Mean. Short Term Flooding. 12. 7.32900. 3.668021. 1.058866. Long Term Flooding. 12. 9.80300. 3.954804. 1.141654. Short Term Flooding. 12. 7.06592. 4.307870. 1.243575. Long Term Flooding. 12. 9.96517. 3.595172. 1.037837. Short Term Flooding. 12. 6.41533. 3.938217. 1.136865. Long Term Flooding. 12. 7.39633. 3.745510. 1.081236. Short Term Flooding. 12. 3.50925. 3.769979. 1.088299. Long Term Flooding. 12. 3.41583. 1.359191. .392365. Short Term Flooding. 12. 5.47225. 5.661363. 1.634295. Long Term Flooding. 12. 6.46683. 2.289290. .660861. Short Term Flooding. 12. 5.93892. 5.398842. 1.558511. Long Term Flooding. 12. 11.16800. 2.970061. .857383. ANOVA Sum of Squares rw03. rw04. rw05. rw06. rw07. rw08. Between Groups. df. Mean Square. 36.724. 1. 36.724. Within Groups. 320.043. 22. 14.547. Total. 356.767. 23. Between Groups. 50.434. 1. 50.434. Within Groups. 346.313. 22. 15.742. Total. 396.747. 23. Between Groups. 5.774. 1. 5.774. Within Groups. 324.922. 22. 14.769. Total. 330.697. 23. Between Groups. .052. 1. .052. Within Groups. 176.662. 22. 8.030. Total. 176.714. 23. Between Groups. 5.935. 1. 5.935. Within Groups. 410.211. 22. 18.646. Total. 416.146. 23. Between Groups. 164.060. 1. 164.060. Within Groups. 417.656. 22. 18.984. Total. 581.716. 23. F. Sig.. 2.524. .126. 3.204. .087. .391. .538. .007. .936. .318. .578. 8.642. .008.
(27) 27 Appendix 5. Resumen Ejecutivo de Investigación. Escobar, J. 2010. Contraste dendrocronológico de diferencias de crecimiento causadas por inundaciones entre cuatro especies de árboles de los ecosistemas urbanos de Nueva Orleans, Louisiana, EE.UU. Proyecto especial de graduación para la carrera de Ingeniería en Desarrollo Socioeconómico y Ambiente, Escuela Agrícola Panamericana, Zamorano, Honduras. 29p. El huracán Katrina mató a 1,836 personas, convirtiéndose en el segundo más mortal junto con el huracán Okeechobee en 1928; además, se estima que Katrina causó 75 mil millones de dólares en pérdidas por daños a la propiedad, convirtiéndose en el huracán más costoso, en la historia de Estados Unidos (USDHS 2005). Es conocido comúnmente que las tasas de composición de comunidad y crecimiento relativo de los árboles urbanos se ven afectados por el cambio climático (Chambers 2010). Utilizando el análisis de anillos de crecimiento de árboles se puede descifrar estos cambios en el crecimiento radial dentro de los ecosistemas urbanos. La zona costera de Louisiana y otras grandes áreas urbanas incluyendo Nueva Orleans y Baton Rouge fueron afectadas por el huracán Katrina. En Nueva Orleans, Katrina inundó el 80% del área urbana por períodos de dos a nueve semanas (Chambers 2010). El entorno de ecosistema urbano es duro con el crecimiento del árbol debido a la modificación constante del medio ambiente, factores como: contaminación, poda de raíces y ramas de árboles, la compactación del suelo, además de los efectos adicionales de las tormentas tropicales podría afectar la supervivencia y el crecimiento en los próximos años de dichos árboles (Chambers 2010). El impacto sobre el crecimiento de los árboles causado por el huracán Katrina no ha sido documentado completamente, por lo que es importante hacer un estudio descriptivo y exploratorio sobre el crecimiento de árboles urbanos en Louisiana, como un precursor de una valoración ambiental de los huracanes en las zonas urbanas de Louisiana, Estados Unidos. El objetivo general del estudio fue evaluar el impacto causado por el huracán Katrina en el crecimiento en diámetro (DAP) de los árboles en los últimos seis años en Nueva Orleans, Louisiana, Estados Unidos. Los impactos en árboles causados por inundaciones pueden ser de tres formas: 1) Problemas en el suelo por saturación, 2) Agua de la inundación físicamente derribando árboles, esto a causa de debilitamiento del suelo y por pudrición del sistema radicular y, 3) Problemas crónicos como enfermedades por infecciones fúngicas o bacterianas, asociados a un entorno cambiante o modificado por el hombre como es el caso de podas y pavimentación de aceras (Coder 1994). En las zonas urbanas de Nueva Orleans, hay más de 30 especies de árboles (Chambers 2010); este estudio se basa en cuatro especies las cuales fueron las más comunes y representativas en cada área de estudio, estas especies son: Fresno Verde (Fraxinus.
(28) 28 pennsylvanica), Pino Taeda (Pinus taeda), Sicómoro Americano (Platanus occidentalis) y Roble Americano (Quercus nigra). El estudio consta de dos tratamientos: • SF “Short-term Flooding” inundaciones a corto plazo, las inundaciones poco profundas: 2-4 pies por 2 semanas. Repeticiones: South Carrollton (SCAROL), Broadmoor (BM), Mid City (MC). • LF “Long-term Flooding” inundaciones a largo plazo, aguas más profundas: 7-9 pies por 4 semanas. Repeticiones: St. Bernard Parish (SBP), Lake View (LV), Gentilly (GT). En los árboles se tomaron muestras de anillos de crecimiento con un taladro de incremento a una profundidad superior a 10 años de crecimiento, en dos regímenes de inundación (inundaciones a corto plazo por dos semanas y la inundación a largo plazo de cuatro a seis semanas), se tomaron dos muestras de cada individuo a una altura de un metro. Cada condición de inundación se repitió tres veces con cuatro individuos muestreados por repetición y 48 muestras de cuatro especies por tratamiento. Como resultados se obtienen: Para Fresno Verde, en 2006, 2007 y 2008 hay una diferencia significativa en años separados por eventos de inundación. Por lo tanto, difieren los promedios con reducción del 70% en anillos de crecimiento durante 2006 comparado con los años 2003 a 2005, 55% de reducción en los patrones de anillos de crecimiento en 2007 y una reducción del 46% en 2008 con p<0.10. Para Pino Teada, durante 2006 y 2008 hay diferencias significativas en años separados por eventos de inundación. Por lo tanto, hay reducción de 37% en los anillos de crecimiento durante 2006 comparado con los años 2003 a 2005, y 31% de reducción en los patrones de anillos de crecimiento durante 2007 con p<0.10. Para Sicómoro Americano, en 2006, 2007 y 2008 hay diferencias significativas en años separados por eventos de inundación. Por lo tanto, existen diferencias en los promedios con reducción de 24% de los patrones de anillos de crecimiento en 2006 comparado con 2003 a 2005, el 55% de reducción en los patrones de anillos de crecimiento en 2007 y una reducción del 61% en 2008 p<0.10. El Roble Americano se comportó de forma inversa a las tres anteriores especies, durante el año 2008 hay una diferencia significativa en años separados por eventos de inundación. Por lo tanto, la diferencia en promedio es del 98% en el aumento de los patrones de los anillos de crecimiento en 2008 comparado con los años 2003 a.
(29) 29 2005, el resto de ellos fueron de disminución en los patrones de anillos de crecimiento en 2006 y 2007con p<0.01. Como conclusiones se tiene: Existe una diferencia significativa entre los patrones de crecimiento de los árboles ante inundaciones a largo plazo y corto plazo. Hay un impacto en el suelo por las inundaciones y después de ese suceso, se afectará directamente a los árboles en sus patrones de crecimiento. Los impactos en el crecimiento lateral de árboles dependen de factores causales o eventos modificadores como es el caso de los regímenes de inundaciones, y están ligados también a las especies del árbol. Cada especie responderá de acuerdo a su eco-fisiología y su interacción con el medio ambiente afectado por las inundaciones. El huracán Katrina afectó los patrones de crecimiento y se puede entender que debido a eventos de inundación con regímenes mayores a dos semanas y 4 pies de altura pueden afectar directamente los patrones de crecimiento de árboles. Se sugiere por tanto: Más factores paramétricos como poda de ramas y raíces además de la contaminación constante del medio ambiente, tienen que ser incluidos en este estudio con el fin de complementarlo. Aplicar la metodología para evaluar el impacto de las perturbaciones naturales o antropológicas tales como incendios, inundaciones y erosión del suelo en las zonas de propiedades de Zamorano..
(30)
Figure


+5


Documento similar
The predicted values for each region represent the counterfactual (or projected) annual growth rate of employment expected in absent of the economic crisis. That
T F is folding temperature and it depends on ∆E the energy gap between funnel minima and random states, and configurational entropy Sc.. T G is glass transition temperature
A 20 year term field experiment was conducted to deter- mine the survival, growth and fuelwood volume yield in a pure plantation of five eucalyptus species planted on a degraded
Average by location of elongation, date of growth start (Julian day), date of growth end (Julian day), duration of shoot growth and final height (two- year-old) for a
The objective of this study was to determine the diameter growth rates and evaluate the influence of tree size, crown class and neighbouring tree basal area on the growth of common
R Foundation for Statistical Computing Vienna Austria, (01/19). Ecosystem service values and restoration in the urban Sanyang wetland of Wenzhou, China. RUSLE for mining,
basal area and timber volume stocks and growth rates for several site productivities and for several native and some introduced pine species; b) the temporal scale of projections
scleroxylon, one of the most valuable and fragile timber species from the Chiquitano forest in Santa Cruz de la Sierra, Bolivia, (ii) to quantify the changes in
