NUSTAR Unveils a Heavily Obscured Low luminosity Active Galactic Nucleus in the Luminous Infrared Galaxy NGC 6286
13
0
0
Texto completo
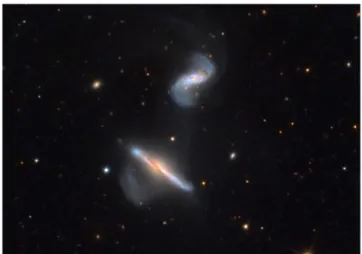
(2) The Astrophysical Journal, 819:4 (13pp), 2016 March 1. Ricci et al.. the L (3–4 μm) and M (4–5 μm) bands (Imanishi & Dudley 2000; Risaliti et al. 2006; Sani et al. 2008; Risaliti et al. 2010): the 3.3 μm polycyclic aromatic hydrocarbon (PAH) emission feature, the bare carbonaceous 3.4 μm absorption feature, and the slope of the continuum. The 6.2 μm (e.g., Stierwalt et al. 2013, 2014) and 7.7 μm PAH features (e.g., Veilleux et al. 2009), the presence of highexcitation MIR lines (e.g., [Ne V] 14.32 μm, Veilleux et al. 2009), or the radio properties (e.g., Parra et al. 2010; Romero-Cañizales et al. 2012a; Vardoulaki et al. 2015) have also been used to infer the presence of a buried AGN. X-ray observations are a very powerful tool used to detect accreting SMBHs and to disentangle the contributions of star formation and AGN emission to the total luminosity of U/LIRGs. Studies performed so far using XMM-Newton (e.g., Franceschini et al. 2003; Imanishi et al. 2003; Pereira-Santaella et al. 2011) and Chandra (e.g., Ptak et al. 2003; Teng et al. 2005; Iwasawa et al. 2011) have characterized the properties of a significant number of these systems. However, a significant fraction of U/LIRGs might be heavily obscured (e.g., Bauer et al. 2010; Treister et al. 2010b) and X-rays at energies 10 keV are strongly attenuated in Compton-thick (CT, NH 1024 cm−2) AGNs. Observations carried out in the hard X-ray band ( 10 keV) are less affected by absorption and can be used to probe nuclear X-ray emission even in highly obscured systems (e.g., Arévalo et al. 2014; Baloković et al. 2014; Gandhi et al. 2014; Annuar et al. 2015; Bauer et al. 2015; Koss et al. 2015; Lansbury et al. 2015; Puccetti et al. 2015; Ricci et al. 2015). Previous hard X-ray observations of U/LIRGs were carried out with BeppoSAX (e.g., Vignati et al. 1999), Suzaku (e.g., Teng et al. 2009), and Swift/BAT (Koss et al. 2013). The recent launch of the Nuclear Spectroscopic Telescope Array (NuSTAR, Harrison et al. 2013), the first focusing telescope in orbit operating at E 10 keV, has opened a new window in the study of U/LIRGs thanks to its unprecedented characteristics. The first studies of the hard X-ray emission of local ULIRGs carried out with NuSTAR have recently been reported by Teng et al. (2015) and Ptak et al. (2015) who show the importance of sensitive hard X-ray spectra to well constrain the line of sight column density. We report here on the first results of a series of NuSTAR observations awarded to our group during AO-1 as part of a campaign aimed at observing 10 local LIRGs in different merger stages (PI: F. E. Bauer). The sources were selected from the Great Observatories All-sky LIRG Survey (GOALS14, Armus et al. 2009). GOALS is a local (z < 0.088) sample that contains 181 LIRGs and 21 ULIRGs selected from the IRAS Revised Bright Galaxy Sample (Sanders et al. 2003). This paper reports the detection of a heavily obscured AGN in NGC 6286 (also referred to as NGC 6286S), a LIRG (log LIR L =11.36, Howell et al. 2010) located at z=0.018349 (i.e., a luminosity distance of dL = 76.1 Mpc), which was not previously detected above 10 keV (Koss et al. 2013). The source has a star formation rate (SFR) of 41.3 Me yr−1 (Howell et al. 2010), is in an early merging stage (i.e., stage B or 2, following the classification of Stierwalt et al. 2013), and is interacting with the galaxy NGC 6285 (NGC 6286N) located at a distance of ∼1.5 arcmin (∼33 kpc, projected distance; see Figure 1 and panel four of Figure 2). 14. Figure 1. Optical image of the interacting pair NGC 6286 (bottom)/NGC 6285 (top) obtained with the Schulman 32-inch Telescope of the Mount Lemmon SkyCenter. Image courtesy of Adam Block (Mount Lemmon SkyCenter/ University of Arizona).. The source is also known to host a OH megamaser (Baan et al. 1998). The only previous X-ray study of this source, carried out using XMM-Newton observations, did not find any evidence of an AGN (Brightman & Nandra 2011). The XMMNewton can in fact be well represented by a model taking into account only a collisionally ionized plasma and an unabsorbed power-law component, representing thermal emission from the starburst and X-ray radiation produced by X-ray binaries, respectively. Possible evidence of very faint AGN activity has been found by studying the near-IR to radio spectral energy distribution (SED; Vega et al. 2008) and could be inferred by the detection of [Ne V] lines, although the detection of these features has been questioned by Inami et al. (2013) and due to their weakness they might also have been produced by a young starburst. The paper is structured as follows. In Sections 2 and 3 we present the X-ray and radio data used and describe the data reduction procedures. In Section 4 we report on the X-ray spectral analysis of NGC 6286. In Section 5 we discuss our results by taking into account the multiwavelength properties of NGC 6286 and in Section 6 we summarize the main results of our work. Throughout the paper we adopt standard cosmological parameters (H0 = 70 km s−1 Mpc−1, Ωm = 0.3, ΩΛ = 0.7). 2. X-RAY OBSERVATIONS AND DATA REDUCTION 2.1. NuSTAR NuSTAR observed NGC 6286 on UT 2015 May 29 for 17.5 ks. We processed the data using the NuSTAR Data Analysis Software NUSTARDAS v1.4.1 within HEASOFT v6.16, adopting the latest calibration files (Madsen et al. 2015). The source is clearly detected in the 3–24 keV image (Panel 3 of Figure 2). For both focal plane modules (FPMA and FPMB) we extracted source and background spectra and light curves with the NUPRODUCTS task. A circular region of 45 arcsec was used for the source15, while the background was extracted from an annulus centered on the X-ray source with inner and outer radii of 90 and 150 arcsec, respectively. The 3–10 and 15 In the 3–24 keV band for photon indices Γ=0.6−1.8. This aperture encloses ∼65% of the full point-spread function energy (Lansbury et al. 2015).. http://goals.ipac.caltech.edu. 2.
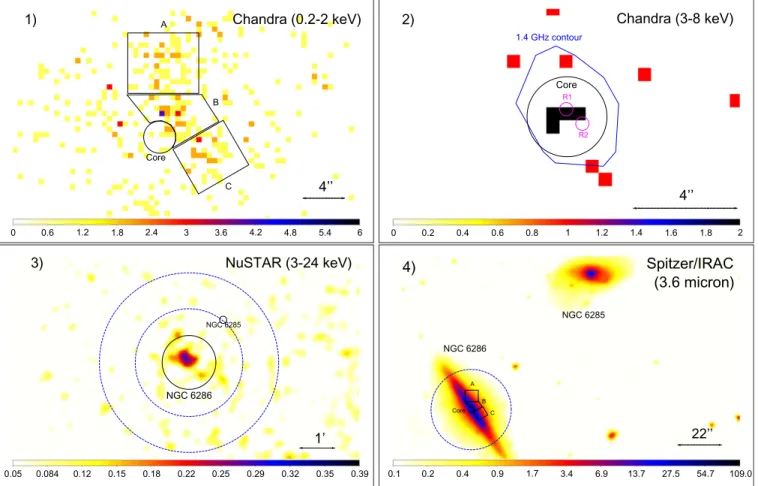
(3) The Astrophysical Journal, 819:4 (13pp), 2016 March 1. Ricci et al.. Figure 2. Chandra ACIS-S (Panel 1: 0.2–2 keV; Panel 2: 3–8 keV), NuSTAR FPMA (Panel 3: 3–24 keV), and Spitzer IRAC (Panel 4: 3.6 μm) images of NGC 6286. The Chandra 0.2–2 keV image shows a clear extended structure of ∼12 arcsec size (∼4.4 kpc). The four regions shown in Panels 1 and 4 represent the 3–8 keV core and the north, central, and south regions discussed in Section 4.1. The 1.4 GHz VLA FIRST radio contour is illustrated in Panel 2 together with the two radio sources (R1 and R2) detected by our analysis of EVN observations at 5 GHz (see Section 3), which show that the radio emission coincides with the hard X-ray core, suggesting the presence of a buried AGN. The black circle and the blue dashed annulus in Panel 3 correspond to the NuSTAR source and background extraction regions, respectively. The image in Panel 4 was smoothed with a Gaussian kernel of radius five pixels. The blue dashed circle in Panel 4 represents the source region used for XMM-Newton EPIC/PN.. 10–50 keV light curves of the sources do not show any evidence of flux variability.. extracted the spectrum of the source using a circular region of 20 arcsec radius, while the background was extracted from a circular region of 40 arcsec radius located on the same CCD of the source and in a zone devoid of other sources. No significant flux variability is found in the 0.3–10 keV band during the XMM-Newton observation.. 2.2. XMM-Newton Two XMM-Newton (Jansen et al. 2001) observations of NGC 6286 (ID: 0203390701 and 0203391201; PI: Maiolino) were carried out on UT 2005 May 7 with exposures of 20.8 and 8.9 ks. Both PN (Strüder et al. 2001) and MOS (Turner et al. 2001) data were analyzed by first reducing the observation data files (ODFs) using the XMM-Newton Standard Analysis Software (SAS) version 12.0.1 (Gabriel et al. 2004), and then the raw PN and MOS data files using the EPCHAIN and EMCHAIN tasks, respectively. To filter the observations for periods of high background activity we analyzed the EPIC/PN and MOS background light curves in the 10–12 keV band and above 10 keV, respectively, and found that both observations showed a significant background contamination. Observation 0203391201 was not used because the background flux dominates the whole observation (with an average count-rate of 6 ct s−1 and a minimum of 2 ct s−1). Observation 0203390701 showed less contamination and we filtered the periods of high background activity using a threshold of 2 ct s−1 for both PN and MOS, which resulted in net exposure times of 2.3 and 4.7 ks, respectively. For both cameras we. 2.3. Swift/XRT The X-ray Telescope (XRT, 0.2–10 keV; Burrows et al. 2005) on board Swift (Gehrels et al. 2004) observed NGC 6286 quasi-simultaneously with NuSTAR on UT 2015 May 29 for 2 ks. XRT data were reduced using the XRTPIPELINE V0.13.0 within HEASOFT v6.16. 2.4. Chandra A Chandra (Weisskopf et al. 2000) ACIS-S (Garmire et al. 2003) observation of NGC 6286 was carried out on UT 2009 September 18 (PI: Swartz) with an exposure of 14.2 ks. The data reduction was performed following the standard procedure using CIAO v.4.6. The data were reprocessed using CHANDRA_REPRO and the spectra were extracted using the SPECEXTRACT tool. The 0.2–2 keV Chandra image shows clear evidence of extended emission (Panel 1 of Figure 2). The 3–8 keV image 3.
(4) The Astrophysical Journal, 819:4 (13pp), 2016 March 1. Ricci et al.. (J1651+5805) is not detected in this experiment and constraints for it are also not available in the VLBA Calibrator search engine at NRAO. We have resorted to the use of another nearby calibrator (J1656+6012, at 2°. 22) which was observed 2 min before the NGC 6286 scan. We found that there are no sources detected above ∼0.8 mJy/beam (3×rms) in the VLBA observations convolved with a 3.16×0.94 arcsec at 29°. 31 beam. If any of the sources detected with the EVN is the AGN core we would expect a similar peak intensity measured in a baseline with comparable length as that from Ef-Jb or Ef-Wb baselines. The fact that we do not detect any source in the VLBA observations leaves two possible explanations: (i) the sources are variable and the VLBA observations are not sensitive enough or (ii) the sources are resolved at resolutions better than ∼3 arcsec. Although the VLBA array includes three times as many antennas as the EVN small array, it also observed the target for only 1/3 of the time with respect to the EVN and used antennas ∼3–100 times smaller than those in the small EVN array. We made the exercise of producing an image with similar UV-range for both EVN and VLBA observations. The obtained UV coverages result in the VLBA being sensitive to emission close to perpendicular to the structure we detected with the EVN (at an inclination ∼50°), and since there is no emission in such an orientation the VLBA cannot detect any structure, unlike the EVN. Therefore, to better constrain the radio emission of NGC 6286, further VLBI observations covering proper hour angles at high sensitivity are needed.. Figure 3. EVN (Effelsberg, Westerbork, and Lovell antennas) contour map of NGC 6286 at 5 GHz from UT 2005 June 13, imaged with a convolving beam of 8.39×25.94 arcsec at 33°. 71 (north through east) using natural weighting.. (Panel 2) shows instead only a point-like source that does not appear in the 0.2–2 keV image. This source is located at the center of the galaxy (see Panel 3) and could be associated with AGN emission. The spectra of these different regions are discussed in Section 4.1. To be consistent with the spectral extraction of XMMNewton and Swift/XRT, which have a much lower spatial resolution than Chandra, the ACIS-S source spectrum used for the broadband X-ray fitting was extracted from a circular region of 10.5 arcsec radius. The background spectrum was extracted from a circular region of the same size on the same CCD where no other source was detected.. 4. X-RAY SPECTRAL ANALYSIS The X-ray spectral analysis was performed within (Arnaud 1996). Galactic absorption in the 20 −2 direction of the source (NG H = 1.8 × 10 cm , Kalberla et al. 2005) was taken into account by adding photoelectric absorption (TBABS in XSPEC, Wilms et al. 2000). Abundances were set to the solar value. Spectra were rebinned to have at least 20 counts per bin in order to use χ2 statistics unless reported otherwise. In the following we first present the X-ray spectral analysis of the extended and nuclear emission revealed by Chandra (Section 4.1) and then discuss the spatially integrated broadband X-ray emission (Section 4.2) considering all observations available.. XSPEC v.12.8.2. 3. RADIO OBSERVATIONS AND DATA REDUCTION Parra et al. (2010) reported VLA observations of NGC 6286 at 4.8 GHz, showing a compact morphology with a size of 0.25×0.21 arcsec and a flux density of 15.24 mJy. They also observed this galaxy with three of the most sensitive antennas (Effelsberg, Westerbork, and Lovell) of the European very long baseline interferometry (VLBI) Network (EVN) at 5 GHz and detected fringes in each one of the baselines with amplitudes between 5.36 and 6.11 mJy. We have extracted these observations from the archive and applied the pipelined calibration available. In Figure 3 we show the contour map obtained using the cleaning algorithm within the Caltech program DIFMAP (Shepherd et al. 1995). No proper flux density could be obtained with such a small array since the measurements are still subject of instrumental amplitude errors. We can, however, rely on the source structure as there is enough information to determine phase closure. We find two milli-arcsec sources with S/N>5, one (R1) at R.A.=16h58m31 7374, decl.= +58° 56′14 705, and the other (R2) at R.A.=16h58m31 6572, decl.=+58°56′14 167. These two sources are consistent with the 3–8 keV core region (see Panel 2 of Figure 2 and Section 4.1). We have also extracted and analyzed the very long baseline array (VLBA) experiment BC196 observed at 8 GHz on UT 2012 January 12. We used the NRAO Astronomical Image Processing System (AIPS) to reduce the data following standard procedures. We note that the source chosen as phase reference. 4.1. Extended and Nuclear Emission The diffuse soft X-ray emission detected by Chandra has an angular size of ∼12 arcsec, which at the distance of the source corresponds to ∼4.4 kpc. This diffuse emission might either be related to thermal plasma in a star-forming region, to scattered radiation from the AGN to X-ray binaries, or to shocks created by the interaction between outflows from the AGN and the galactic medium. To analyze the diffuse and nuclear emission we extracted the spectra of the four regions shown in Panel 1 of Figure 2. Besides the 3–8 keV core, to study how the extended emission varies we arbitrarily selected three regions (A, B, and C) where most of the 0.2–2 keV photons were detected. Due to the low number of counts, we rebinned the spectra to have at least one count per bin and used Cash statistics (Cash 1979) to fit the data. In the following we discuss the spectral properties of the Core and regions A, B, and C. The Core. The spectrum of the core was extracted from a circular region of radius 1.5 arcsec centered on the peak of the 4.
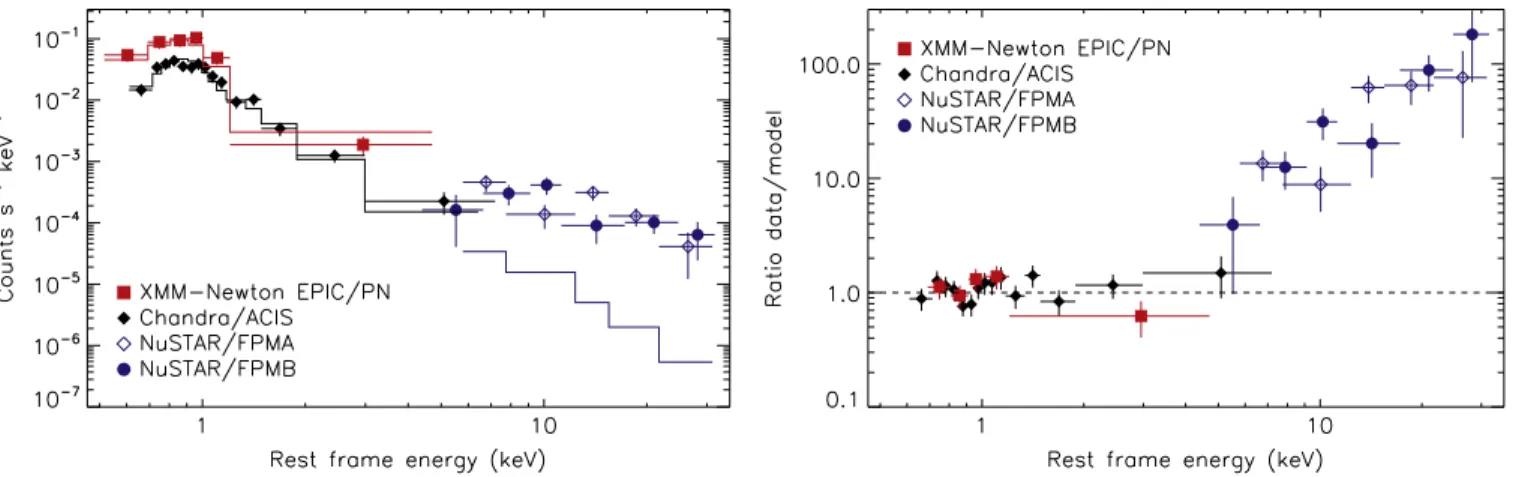
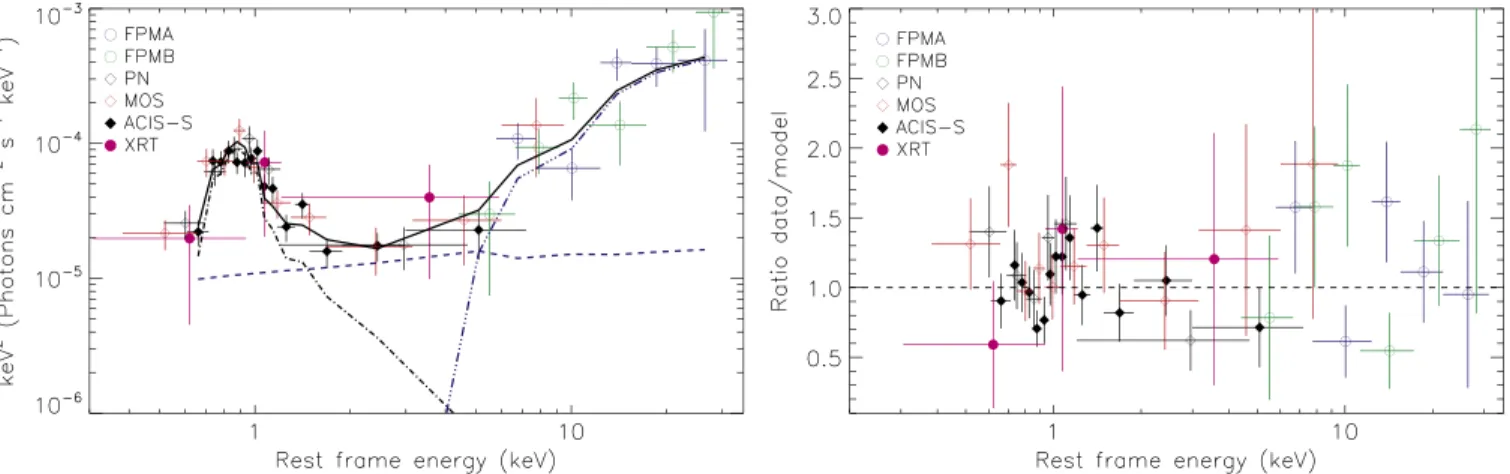
(5) The Astrophysical Journal, 819:4 (13pp), 2016 March 1. Ricci et al.. Figure 4. Left panel: XMM-Newton EPIC/PN, Chandra ACIS-S (using a 10.5 arcsec extraction radius), and NuSTAR FPMA/FPMB spectra of NGC 6286. The continuous lines represent the model used in Brightman & Nandra (2011) (APEC+ZPOWERLAW) to reproduce the 0.3–10 keV spectrum of the source. Right panel: ratio between the data and the model. The plots clearly show the importance of hard X-ray coverage to fully understand the characteristics of the X-ray emission.. The XMM-Newton EPIC spectrum of NGC 6286 was analyzed by Brightman & Nandra (2011) who found that it could be well represented by an unabsorbed power-law continuum plus a thermal plasma16 with the photon index fixed to Γ=1.9. This is in disagreement with the hard +1.01 (G = -0.171.03, see Section 4.1) 1–8 keV spectrum of the 3–8 keV core. Fitting the NuSTAR FPMA/FPMB data with a simple power-law model, we also find a very flat continuum. +0.46 (G = 0.490.41 ). The low values of the photon index obtained in the 3–8 keV and 3–30 keV bands could indicate that the X-ray emission is highly absorbed. While the model used by Brightman & Nandra (2011) can reproduce well the XMM-Newton and the spatially integrated Chandra spectra, it severely underpredicts the hard X-ray flux inferred by NuSTAR as illustrated in Figure 4. This might be related either to heavy obscuration of the X-ray source or to flux variability between XMM-Newton and NuSTAR observations, although variability would not be able to explain the very flat hard X-ray spectrum. The Swift/XRT observation allows us to constrain the flux level below 10 keV band at the time of the NuSTAR observations. We find that the Swift/XRT 0.3–2 and 2–5 keV fluxes are consistent with that inferred by Chandra and XMM-Newton EPIC/PN observations (see Table 1), which implies the lack of significant variability between the different observations. To further test the variability scenario we fitted NuSTAR and the spatially integrated Chandra spectra with a model that consists of a power-law plus a thermal plasma [TBABSGa×(APEC + POWER LAW)], allowing for different normalizations of the power-law continuum to vary (fixing Γ = 1.9). We found that the model cannot reproduce well the spectra (χ2/dof=28.9/20), with the fit17 showing clear residuals between 10 and 30 keV. This rules out variability as a likely explanation for the large ratio between the 10–50 keV and 2–10 keV fluxes. In the following we report the results obtained by adopting several different X-ray spectral models to infer the properties of the AGN in NGC 6286. To reduce the possible degeneracies in the models we constrained the average properties of the diffuse soft X-ray emission. To do this we first extracted the Chandra X-ray spectrum of the diffuse emission by excluding from the circular region of 10.5 arcsec a circle of 1.5 arcsec radius centered on the 3–8 keV core. We then fitted the spectrum with a model that includes (i) a thermal plasma and (ii) a power-law component (Γ = 1.9) to take into account the X-ray emission from binaries or the scattered radiation from the AGN. In the following, we refer to this component as the scattered emission. We obtained a normalization of the scatt = (1.03 0.37) ´ 10-5 ph keV-1 cm-2 s-1, power law n po and a temperature and normalization of the thermal +0.07 plasma of kT = 0.770.08 keV and n apec = (2.02 0.33). 16. 17. 3–8 keV emission. Ignoring the data below 1.2 keV to avoid contamination from the diffuse soft X-ray emission and fitting with a power-law model (TBABSGAL × ZPOWERLAW in XSPEC), we +1.01 obtain a photon index of G = -0.171.03. This low value is indicative of heavy absorption in the nuclear region. Fitting the X-ray spectrum using the whole energy range with a model that also includes a collisionally ionized plasma model (TBABSGal×ZPOWERLAW+APEC) we obtain C-stat/dof=20.9/ +0.28 21, Γ−0.03 and a plasma temperature of kT = 0.990.35 keV. The 3–8 keV core coincides with the 1.4 GHz radio emission measured by the VLA FIRST survey (Becker et al. 1995). Region A. Fitting the spectrum with a collisionally ionized thermal plasma model (TBABSGa×APEC) results in a good fit +0.10 (C-stat/dof=31.0/37), with kT = 0.910.18 keV. Applying a spectral model which reproduces a nonequilibrium plasma created in a shock (PSHOCK in XSPEC) yields C-stat/dof=31.4/ +0.11 36, a plasma temperature of kTS = 0.880.13 keV, and an upper limit on the ionization timescale of tu 1.6 ´ 1012 s cm-3. Region B. Using the thermal plasma model yields a rather poor fit (C-stat/dof=48.0/34). This can be improved by adding photoelectric absorption (TBABSGal × ZTBABS × APEC, C-stat/ dof=43.7/33), and would be consistent with the presence of larger absorption in the central part of the edge-on galaxy with respect to other regions. The shock plasma model fails to reproduce well the spectrum both without (C-stat/dof=48.7/ 33) and with (C-stat/dof=43.6/32) an absorption component. +0.37 Region C. A thermal plasma model with kT = 1.230.35 keV yields a good fit (C-stat/dof=34/34) while a shock plasma model cannot reproduce well the data (C-stat/dof=45.1/33), +0.73 -3 8 and results in kTs = 1.090.38 keV and tu 1.4 ´ 10 s cm . 4.2. Spatially Integrated X-Ray Emission. ZPOWERLAW+APEC. in. XSPEC. 5. The ratio of the power-law normalizations is ;4..
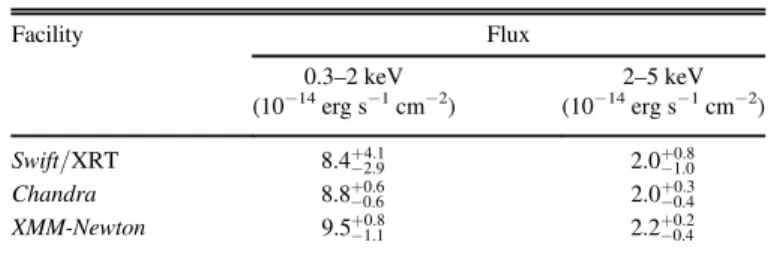
(6) The Astrophysical Journal, 819:4 (13pp), 2016 March 1. Ricci et al.. Table 1 Observed X-Ray Fluxes Facility. law to take into account the scattered emission and a collisionally ionized plasma model. In XSPEC, the model is TBABSGal (ATABLE{TORUS1006.FITS} + APEC + ZPOWERLAW). We fixed Γ=1.9 and tested several values of the halfopening angle of the torus (qOA = 40, 60, 80). The three models are statistically indistinguishable and in all cases we obtained good fits. For the three values of θOA the column densities are consistent within the uncertainties with CT absorption.. Flux 0.3–2 keV (10−14 erg s−1 cm−2). 2–5 keV (10−14 erg s−1 cm−2). +4.1 8.42.9 +0.6 8.80.6 +0.8 9.51.1. +0.8 2.01.0 +0.3 2.00.4 +0.2 2.20.4. Swift/XRT Chandra XMM-Newton. 4.2.3. SPHERE. ´10-5. keV-1 cm-2 s-1. ph , respectively. In all the spectral models reported below we set nscatt po , kT, and napec to the values obtained for the diffuse emission and allow them to vary only within their 90% uncertainties.. To test the scenario in which the X-ray source is fully covered by the obscuring material, we applied the SPHERE model (Brightman & Nandra 2011) using the same setting as for the TORUS model: TBABSGal(ATABLE{SPHERE0708.FITS} + APEC + ZPOWERLAW). This model provides a good fit (Figure 5), and confirms the +4.6 23 -2 presence of heavy obscuration (NH = 10.13.2 ´ 10 cm ).. 4.2.1. PEXRAV. To infer the value of the line of sight column density (NH) we fitted the joint Swift/XRT, Chandra ACIS-S, XMM-Newton EPIC/PN and MOS, and NuSTAR FPMA and FPMB data with a model that consists of (a) an absorbed power-law with a photon index fixed to Γ=1.9, consistent with the average value of AGNs (e.g., Nandra & Pounds 1994a; Piconcelli et al. 2005; Ricci et al. 2011); (b) unabsorbed reprocessed X-ray emission from a slab; (c) a Gaussian to reproduce the fluorescent Fe Kα emission line (with the rest-frame energy fixed to EKα = 6.4 keV); (d) a second power-law to reproduce the scattered component; and (e) an emission from a collisionally ionized plasma. To reproduce the effect of obscuration we included both Compton scattering and photoelectric absorption. Reprocessed X-ray emission (excluding fluorescent lines) was taken into account using the PEXRAV model (Magdziarz & Zdziarski 1995). The fraction of scattered flux (fscatt) is calculated as the ratio between the normalization at 1 keV of the primary power law (npo) and nscatt po . The width of the Gaussian line was fixed to σ=40 eV, consistent with the results obtained by Chandra/HETG studies (e.g., Shu et al. 2010). An Fe Kα line at 6.4 keV is usually found in the X-ray spectrum of AGNs (e.g., Nandra & Pounds 1994b; Shu et al. 2010; Ricci et al. 2014b) and is believed to originate in the material surrounding the SMBH (e.g., Ricci et al. 2014a; Gandhi et al. 2015 and references therein). In XSPEC our model is TBABSGal (ZTBABS × CABS × ZPOWERLAW + PEXRAV + ZGAUSS + APEC + ZPOWERLAW). The model yields a good fit (χ2/dof=47.2/44) and results in a column density consistent with border-line Compton-thick +0.82 24 -2 obscuration (NH = 1.320.54 ´ 10 cm ). Due to the low signal-to-noise ratio the Fe Kα is not spectrally resolved and only an upper limit of its equivalent width was obtained (EW 2318 eV), which is consistent with heavy obscuration.. 4.2.4. MYTORUS. Next we applied the MYTORUS model (Murphy & Yaqoob 2009), which considers absorbed and reprocessed X-ray emission from a smooth torus with θOA=60° and can be used for spectral fitting as a combination of three additive and exponential table models: the zeroth-order continuum (MYTORUSZ), the scattered continuum (MYTORUSS), and a component containing the fluorescent emission lines (MYTORUSL). We used the decoupled version of MYTORUS (Yaqoob 2012). This was done by (i) allowing the values of the column density of the absorbing [NHT (Z )] and reprocessing [NHT (S , L )] material to have different values; (ii) fixing the inclination angle of MYTORUSL and MYTORUSS to qi (S , L ) = 0 and that of MYTORUSZ to qi (Z ) = 90;; (iii) adding a second scattered component with qi (S , L ) = 90;; and (iv) leaving the normalizations of the transmitted and scattered component (npo and nrefl) free to vary. To this model we added a scattered component and thermal emission. In XSPEC the model is TBABSGal × {MYTORUSZ(90°) × ZPOWERLAW + MYTORUSS(0°) + MYTORUSS(90°) + GSMOOTH[MYTORUSL(0°) + MYTORUSL(90°)] + APEC + ZPOWERLAW}. Due to the low signal-to-noise ratio of the spectrum we could not constrain the different values of NHT (S , L ) and NHT (Z ) so their values were tied. The same was done for the normalizations of the scattered and transmitted components while the photon index was left free to vary. This model also yields a good fit and results in a line of sight column density consistent +5.1 23 -2 with heavy obscuration (NH = 8.83.8 ´ 10 cm ). The parameters obtained from the spectral analysis are reported in Table 3 while in Figure 6 we show the values of Δχ2 versus NH for the models described above. Depending on the X-ray spectral model adopted, the intrinsic (i.e., absorption and k-corrected) 2–10 keV luminosity of NGC 6286 is 3−20×1041 erg s−1.. 4.2.2. TORUS. 5. DISCUSSION. To further study the absorbing material we used the TORUS model developed by Brightman & Nandra (2011), which considers reprocessed and absorbed X-ray emission from a spherical-toroidal structure. In this model the line of sight column density is independent of the inclination angle, which we fixed to the maximum value permitted (θi = 87°. 1). Similar to what was done for PEXRAV, we added to the model a power. The X-ray spectral analysis of NGC 6286 reported above clearly shows that the accreting SMBH is heavily obscured, possibly by CT material (see Figure 6). The very flat continuum found by both Chandra (for the hard X-ray core) and NuSTAR, together with the fact that the 1.4 GHz emission coincides with the 3–8 keV Chandra point-source (Panel 2 of Figure 2), 6.
(7) The Astrophysical Journal, 819:4 (13pp), 2016 March 1. Ricci et al.. Figure 5. Left panel: unfolded broadband X-ray spectrum of NGC 6286. The black continuous line represents the best fit to the data while the dotted–dashed line is the thermal plasma, the dashed line is the scattered emission, and the dotted–dotted–dashed line is the SPHERE model. Right panel: ratio between the data and the model.. presence of a bright AGN, since it can destroy PAH molecules (e.g., Imanishi et al. 2010b); (iv) studying the slope of the 2.5–5 μm continuum (Γ2.5–5, e.g., Imanishi et al. 2010b) or the continuum 30 μm/15 μm flux density ratio (e.g., Stierwalt et al. 2013), which tend to be red in the presence of an AGN; (v) using the depth of absorption features (e.g., Imanishi & Dudley 2000; Risaliti et al. 2006; Georgantopoulos et al. 2011a), with large depths pointing toward AGNs obscured by dust; and/or (vi) from deviations of the well-known correlation between the far-IR (FIR) and the radio luminosity (Helou et al. 1985; Condon et al. 1991; Condon 1992) using the radioFIR flux ratio q (e.g., Yun et al. 2001). We find that all these proxies (Table 2) fail to detect the AGN in NGC 6286 with the exception of the Ne V lines. These lines can, however, also be produced by a young starburst with a large population of WolfRayet and O stars (e.g., Abel & Satyapal 2008), so their detection does not always provide conclusive evidence of an AGN. This is especially true for NGC 6286 since the Ne V lines are weak (log (L[Ne V] erg s-1) ~ 38.8). Moreover, the detection of the [Ne V] lines has been questioned by Inami et al. (2013), who found [Ne V] 14.32 μm to be detected only in one of the two Spitzer observations available while in both observations a feature possibly consistent with [Ne V] 24.32 μm were detected at ∼24.37 μm (H. Inami 2016, private communication). Spitzer/IRAC selection provides another important tool for identifying AGNs (e.g., Lacy et al. 2004; Stern et al. 2005). Using the AGN selection criteria proposed by Donley et al. (2012) (see equations (1) and (2) in their paper) and considering the fluxes reported by U et al. (2012), we find that NGC 6286 does not satisfy the conditions for the presence of an AGN. The fact that the IR proxies fail to identify the AGN emission in NGC 6286 is due to the problematic identification of low-luminosity AGNs with IR spectra dominated by the host. For example, in a low-luminosity AGN the silicate absorption feature would be diluted by the strong IR continuum of the host galaxy. Iwasawa et al. (2011) studied 44 LIRGs from the GOALS sample with Chandra and assessed the presence of an AGN using the hardness ratio HR º (H - S ) (H + S ), where H and S are the background-corrected counts in the 2–8 and 0.5–2 keV ranges, respectively. Sources with HR > -0.3 are reported as candidate AGNs. This value was chosen because ULIRGs, which are known to host AGNs such as Mrk 231, Mrk 273, and UGC 5101, tend to cluster just above this limit (Iwasawa et al. 2009). Considering the spatially. Figure 6. Value of Dc 2 = c 2 - c 2best (where c 2best is the minimum value of the χ2) vs. the column density for the different X-ray spectral models discussed in Section 4.2. The horizontal dashed line represents Dc 2 = 2.7. The plot shows that NGC 6286 is heavily obscured with NH consistent with the source being CT for the five models considered.. confirms the presence of a heavily obscured AGN. While the buried AGN in NGC 6286 could be easily identified at hard X-rays, several other diagnostics failed to detect it because of its low luminosity. In Section 5.1 we illustrate the most commonly adopted techniques to detect AGNs in U/LIRGs and discuss the case of NGC 6286 by exploiting the wealth of multiwavelength data available for the GOALS sample. In Section 5.2 we estimate the contribution of the AGN to the luminosity of NGC 6286, while in Section 5.3 we discuss the optical and radio properties of the galaxy, comparing them to those of other similar LIRGs. Finally in Section 5.4, we discuss the presence of heavily obscured low-luminosity AGNs in LIRGs. 5.1. IR and X-Ray Tracers of AGN Activity in U/LIRGs AGNs in U/LIRGs can be identified in the IR by several means: (i) with the detection of high-excitation MIR emission lines (e.g., Sturm et al. 2002), in particular of [Ne V] 14.32 μm and [Ne V] 24.32 μm (e.g., Weedman et al. 2005; Satyapal et al. 2008; Goulding & Alexander 2009); (ii) using the ratios of high-to-low ionization fine-structure emission lines (e.g., [Ne V] 14.32 μm/[Ne II] 12.8 μm and [O IV] 25.89 μm/ [Ne II] 12.8 μm; e.g., Lutz et al. 1999; Petric et al. 2011); (iii) with the EW of the PAH features, which tend to be lower in the 7.
(8) The Astrophysical Journal, 819:4 (13pp), 2016 March 1. Ricci et al.. Table 2 List of IR and X-Ray Tracers of AGN Activity Commonly Used for U/LIRGs (1) Indicator [Ne V] 14.32 μm (10−17 W m−2) [Ne V] 24.32 μm (10-17 W m-2 ) [Ne V]/[Ne II] [O IV]/[Ne II] G2.5 - 5 mm Fn (30 m m) Fn (15 m m) EW (PAH 3.3 m m)(nm) EW(PAH 6.2 μm) (μm) t3.1 mm (3.1 μm H2O ice) τ3.4 μm (3.4 μm bare carbonaceous) τ9.7 μm Chandra hardness ratio Observed log L 2 - 10 (erg s−1) Radio/FIR flux ratio (q). (2) NGC 6286. (3) References. (4) Mean GOALS. (5) Threshold. (6) AGN. 0.33±0.11 0.99±0.20 0.02 0.05 −0.1 5.97 48 0.59 ND ND −0.40 −0.85±0.07 40.80 2. Dudik et al. (2009) Dudik et al. (2009) Dudik et al. (2009) Dudik et al. (2009) Imanishi et al. (2010b) Stierwalt et al. (2013) Imanishi et al. (2010b) Stierwalt et al. (2013) Imanishi et al. (2010b) Imanishi et al. (2010b) Stierwalt et al. (2013) This work This work U et al. (2012). 2.27a L 0.07b 0.03d/0.24e L +2 h 81.5 L 0.55h L L -0.35h −0.56i 41.3k 2.41±0.29m. L L 0.1c 1.75f 1g L <40g 0.3c >0.3g >0.2g L >−0.3j >42l <1.64n. ? ? ⨯ ⨯ ⨯ ⨯ ⨯ ⨯ ⨯ ⨯ ⨯ ⨯ ⨯ ⨯. Notes. The table lists (1) the indicator used, (2) the value and (3) reference for NGC 6286, (4) the mean value for the GOALS sample, (5) the threshold used to infer the presence of an AGN, and (6) whether an AGN was found. ND: not detected. a Median of the 43 detections (18% of the sample) from Petric et al. (2011). b Median (Petric et al. 2011). c Threshold used by Inami et al. (2013) to establish a significant contribution of the AGN to the MIR flux. d Median from Petric et al. (2011). e Mean from Petric et al. (2011). f Value indicating if the AGN contributes to more than 50% of the MIR flux (Petric et al. 2011). g Value used by Imanishi et al. (2010b) h Mean value for objects in the same merger stage (B) as NGC 6286 (Stierwalt et al. 2013), the 30 μm/15 μm flux density ratio of NGC 6286 is only marginally lower than the average value for the B merger stage and has a value consistent with 63% of GOALS LIRGs. i Median of the 44 objects reported in Iwasawa et al. (2011). j Value used to establish the presence of an AGN (Iwasawa et al. 2011). k Median value (Iwasawa et al. 2011). l Values commonly used to separate AGNs from starbursts in the 2–10 keV band (e.g., Szokoly et al. 2004; Kartaltepe et al. 2010). m Mean obtained for the 64 objects studied by U et al. (2012). n Threshold for radio-excess defined by Yun et al. (2001).. L 2 - 10 L 6 m m 2.4 ´ 10-3. This value is consistent with undetected DOGs in the CDF-N (Georgakakis et al. 2010) and with other U/LIRGs (Georgantopoulos et al. 2011b), which is related to the fact that in U/LIRGs the IR emission is enhanced by strong star formation, leading to very low values of L 2 - 10 L 6 m m . Using the largest 2–10 keV X-ray luminosity obtained in Section 4 (L 2 - 10 ~ 2 ´ 10 42 erg s-1) one would still find that L 2 - 10 L 6 m m ~ 0.1, a value lower than that expected from the L 2 - 10 - L 6 m m correlation. This might imply that the AGN contribution to the IR flux is significantly lower than that reported by Vega et al. (2008) (see Section 5.2 and Figure 7).. integrated X-ray flux NGC 6286 has a hardness ratio HR = -0.85 0.07, which would not allow to infer the presence of an AGN. However, as discussed by Iwasawa et al. (2011) this threshold could become less reliable for some CT AGNs, since mostly reprocessed radiation is observed in the hard X-ray band. Another criteria commonly used to identify AGNs is the observed 2–10 keV X-ray luminosity. Using log (L 2 - 10 erg s-1) > 42 as a threshold (e.g., Szokoly et al. 2004; Kartaltepe et al. 2010) one would also miss identifying NGC 6286 as a buried AGN [log (L 2 - 10 erg s-1) = 40.80]. Spectral decomposition (e.g., Nardini et al. 2008; AlonsoHerrero et al. 2012) is another powerful method to constrain the contribution of AGNs to the multiwavelength SED. Vega et al. (2008) found that a pure starburst model fails to reproduce well the near-IR to radio SED of NGC 6286 and a buried AGN accounting for 5% of the IR luminosity is required by the data. A useful diagnostic of the presence of a heavily obscured AGN is the ratio between the MIR and the 2–10 keV luminosities (e.g., Alexander et al. 2008; Georgantopoulos et al. 2011b; Rovilos et al. 2014). It has been shown indeed that for AGNs the absorption-corrected 2–10 keV and the 6 and 12 μm luminosities are well-correlated (e.g., Gandhi et al. 2009; Asmus et al. 2015; Stern 2015) so that deviations from the correlation might imply the presence of heavy obscuration. Vega et al. (2008) report that at 6 μm about 58% of the flux is produced by the AGN. This would imply that the ratio between the IR and observed X-ray AGN luminosity is very low:. 5.2. AGN Contribution to the IR Luminosity The IR luminosity of NGC 6286 is 8.8×1044 erg s−1, which would imply that depending on the X-ray spectral model used, we obtain a ratio L 2 - 10 LIR 4 ´ 10-4 - 2.3 ´ 10-3, significantly lower than the value expected from pure AGNs (e.g., Mullaney et al. 2011). Considering the observed 2–10 keV luminosity, the ratio is log (L 2obs - 10 LIR ) - 4.14 , which is consistent with the average value found for the GOALS sample (log (L 2obs - 10 LIR ) = - 4.40 0.63, Iwasawa et al. 2011). Using the relationship of Mullaney et al. (2011) it is possible to convert the 2–10 keV luminosity into the expected IR 8.
(9) The Astrophysical Journal, 819:4 (13pp), 2016 March 1. Ricci et al.. Table 3 Summary of the X-Ray Spectral Analysis for the Spatially Integrated X-Ray Spectrum of NGC 6286 PEXRAV Column density (NH) (1022 cm−2) Reflection parameter (R) Plasma temperature (kT) (keV) Scattered fraction (fscatt) (%) Fe Kα EW (eV) −13 Observed 2–10 keV flux (F2obs erg s−1 cm−2) - 10 ) (10 −13 obs ) (10 erg s−1 cm−2) Observed 10–50 keV flux (F10 - 50 Intrinsic 2–10 keV flux (F2 - 10 ) (10−12 erg s−1 cm−2) intrinsic 10–50 keV flux (F10 - 50 )(10−12 erg s−1 cm−2) 2–10 keV luminosity (L 2 - 10 )(erg s−1) 10–50 keV luminosity (L10 - 50 )(erg s−1) χ2/dof. +82 13254 0.4 0.79 a +1.9 b 1.30.7 2318 0.9 9.6 2.6 3.1 2.01×1042 2.34×1042 47.2/44. TORUS. Plasma temperature (kT) (keV) Scattered fraction (fscatt) (%) Column density (NH) (1022 cm−2) Intrinsic 2–10 keV flux (F2 - 10 ) (10−13 erg s−1 cm−2) intrinsic 10–50 keV flux (F10 - 50 )(10−13 erg s−1 cm−2) 2–10 keV luminosity (L 2 - 10 )(erg s−1) 10–50 keV luminosity (L10 - 50 )(erg s−1) χ2/dof. θOA=40°. θOA=60°. θOA=80°. 0.79 a +2.0 b 3.01.3 +89 11039 10.7 13.1 8.14 ´ 10 41 9.90×1041 47.8/46. 0.79 A +2.0 B 2.41.3 +109 11141 13.0 15.8 9.84×1041 1.20×1042 48.1/46. 0.79 A +1.9 b 2.01.3 +101 10638 16.0 19.5 1.21×1042 1.48×1042 48.5/46. SPHERE Plasma temperature (kT)(keV) Scattered fraction (fscatt) (%) Column density (NH) (1022 cm−2) Intrinsic 2–10 keV flux (F2 - 10 )(10−13 erg s−1 cm−2) Intrinsic 10–50 keV flux (F10 - 50 )(10−13 erg s−1 cm−2) 2–10 keV luminosity (L 2 - 10 )(erg s−1) 10–50 keV luminosity (L10 - 50 )(erg s−1) χ2/dof. 0.79 a +2.1 b 3.61.2 +46 10132 9.2 11.2 6.98×1041 8.50×1041 47.2/46 MYTORUS +0.10 c 1.53NC 0.79 a +4.9 b 8.82.6 +61 9539 4.7 11.1 3.49 ´ 10 41 8.35×1041 52.5/45. Photon index (Γ) Plasma temperature (kT) (keV) Scattered fraction (fscatt) (%) Column density (NH) (1022 cm−2) Intrinsic 2–10 keV flux (F2 - 10 )(10−13 erg s−1 cm−2) Intrinsic 10–50 keV flux (F10 - 50 ) (10−13 erg s−1 cm−2) 2–10 keV luminosity (L 2 - 10 )(erg s−1) 10–50 keV luminosity (L10 - 50 ) (erg s−1) χ2/dof. Notes. a Parameter left free to vary within the uncertainties of the value obtained fitting the extended emission (see Section 4.2 for details). b scatt Value calculated from the ratio of npo and n po . c The photon index in MYTORUS is calculated only in the range G = 1.4–2.6 . AGN log (L IR erg s-1) = 41.91–42.75. Comparing this with the IR luminosity of the system (log (LIR erg s-1) = 44.96) we find that the IR luminosity of the AGN is between 0.1% and 0.6% of the total IR luminosity. This value is in disagreement with that obtained by Vega et al. (2008) using spectral decomposition, who found that the contribution of the AGN to the total IR luminosity is about one order of magnitude larger. A 5% contribution to the total IR luminosity would imply that. luminosity emitted by the dust around the AGN: AGN log L IR, 43 = (0.53 0.26) + (1.11 0.07) log L 2 - 10,43. (1). AGN In the above equation L IR, 43 and L 2 - 10,43 are the 8–1000 μm and 2–10 keV luminosities of the AGN in units of 10 43 erg s-1. Considering the range of values obtained for the 2–10 keV intrinsic luminosity, the IR luminosity of the AGN is. 9.
(10) The Astrophysical Journal, 819:4 (13pp), 2016 March 1. Ricci et al.. [Ne V] 14.32 μm, clearly disfavors the intrinsically X-ray weak AGN scenario. We can therefore conclude that the energetics of NGC 6286 are clearly dominated by the host galaxy with the low-luminosity AGN providing only a minor contribution to the total flux. The contribution of the AGN to the IR flux of the system is shown in Figure 7. 5.3. Optical and Radio Emission NGC 6286 has been classified as a low-ionization nuclear emission-line region (LINER) by Veilleux & Osterbrock (1987) using a classification scheme based on the diagram first proposed by Baldwin et al. (1981). While most LINERs appear to be driven by old stellar populations (e.g., Sarzi et al. 2010) and by shocks in ULIRGs (e.g., Soto & Martin 2010, 2012), in some cases they can be associated with low-luminosity AGNs (e.g., Ho 2008). Yuan et al. (2010) have recently used a new semi-empirical optical spectral classification to classify IR-selected galaxies based on three diagrams: [O III]/Hβ versus [N II]/Hα, [S II]/Hα, and [O I]/Hα line ratios. This is based on the work of Kewley et al. (2006) to separate starburst galaxies, starburst/AGN composite galaxies, Seyfert 2s, and LINERs. In the scheme of Kewley et al. (2006) objects that were classified as LINERs according to Veilleux & Osterbrock (1987) would be either true LINERs, Seyfert 2 s, composite H II-AGN galaxies, or high metallicity star-forming galaxies. Yuan et al. (2010) found that true LINERs are rare in IR-selected samples (<5%) and that most of the objects would be either classified as star-forming galaxies or starburst/AGN composites. Yuan et al. (2010) classified NGC 6286 as a composite using [N II], as a H II region using [S II], and as a LINER using [O I]. Therefore they adopted a composite classification for the source, which might imply the presence of an AGN. Yuan et al. (2010) found that in the IR luminosity bin LIR = 1011–1012L about 37% of the objects in the IRAS Bright Galaxy Sample (BGS, Sanders et al. 1995; Veilleux et al. 1995) are classified as composites. To characterize the relative AGN contribution to the extreme ultraviolet (EUV) radiation field, Yuan et al. 2010 use DAGN, which is the normalized distance from the outer boundary of the star-forming sequence. While this quantity does not provide information on the fraction of emission due to the AGN, it can be used to compare the amount of EUV radiation due to the AGN in different objects. For NGC 6286 they found DAGN=0.5 using both the [O I]/Hα and the [N II]/Hα diagram. Yuan et al. (2010) found a statistically significant increase of DAGN with LIR, consistent with the idea that the fraction of AGNs increases for increasing values of the 8–100 μm luminosity (e.g., Veilleux et al. 1995). The value obtained for NGC 6286 is marginally larger than the average value obtained by Yuan et al. (2010) for the BGS sample for 11 < log (LIR L ) < 12 (DAGN ; 0.35). The dense molecular gas tracer HCN has been found to be enhanced (relative to HCO+ and CO) in systems with dominant AGNs (e.g., Imanishi et al. 2007). Privon et al. (2015) have shown that some pure starburst and composite sources show similarly enhanced HCN emission. The origin of this enhancement is uncertain, but might be due to mid-infrared pumping associated with a compact obscured nucleus (CON; e.g., Aalto et al. 2015). However, the HCN/HCO+ ratio of NGC 6286 is consistent with that of normal starbursts rather than CONs. From this we can conclude that the starburst does not appear to be compact.. Figure 7. Intrinsic X-ray luminosity of the AGN in the 2–10 keV band vs. the total IR luminosity of the system (in the 8–1000 μm band). Both luminosities are in units of 1043 erg s−1. The continuous black line represents the values for which the AGN and starburst contribute in the same amount to the IR flux while the dashed lines show contributions of the AGN of 20, 10, and 1%. The values of the IR luminosity expected to be due to the AGN are calculated from the 2–10 keV luminosity following Equation (1). The two values of the 2–10 keV luminosity of NGC 6286 represent the minimum and maximum value obtained with the different models discussed in Section 4.2 (see also Table 3). The figure shows that the AGN in NGC 6286 contributes <1% of the total IR luminosity.. AGN log (L IR erg s-1) = 43.66 and the intrinsic 2–10 keV luminosity of the AGN would be log (L 2 - 10 erg s-1) = 43.12, also an order of magnitude larger than predicted by our X-ray spectral analysis. To have such a luminosity the AGN should be obscured by log (NH cm-2) > 25, which is inconsistent with the results obtained here. An alternative explanation for this discrepancy is that the AGN is intrinsically weak at X-ray wavelengths, as recently found by NuSTAR for the AGN in Mrk 231 (Teng et al. 2014, see also Teng et al. 2015). Assuming a 2–10 keV bolometric correction of k x = 20 (e.g., Vasudevan & Fabian 2007), the bolometric output of the AGN would be 7–40×1042 erg s−1. This implies that the ratio between the IR luminosity and the total output of the AGN is Bol LAGN LIR 0.8%–4.5%. The AGN bolometric output can also be inferred from the [Ne V] 14.32 μm luminosity following the relation obtained by Satyapal et al. (2007): AGN log L Bol = 0.938 log L[Ne V] + 6.317,. (2). AGN erg s-1) ~ 42.7, consistent with the estimate and is log (L Bol obtained using the X-ray luminosity. The 2–10 keV bolometric correction obtained using this value is k x 3 - 17. The black hole mass of NGC 6286 has been estimated to be MBH ~ 2.7 ´ 108 M by Caramete & Biermann (2010) using the black hole mass-spheroid correlation (e.g., Magorrian et al. 1998). The Eddington ratio of the source would then be lEdd (0.2–1.2) ´ 10-3, consistent with a low accretion rate AGN. The lack of a significant AGN contribution to the total IR flux is also confirmed considering the [Ne V]/[Ne II] ratio versus the EW of the 6.2 μm PAH feature (see Figures 1 and 2 of Petric et al. 2011), which shows that the ratio between AGN and LIR is below 1% for this object. This together L IR with the 2–10 keV bolometric correction obtained using. 10.
(11) The Astrophysical Journal, 819:4 (13pp), 2016 March 1. Ricci et al.. A radio core is rather common in low-luminosity AGNs as shown by the work of Nagar et al. (2005), who found evidence of radio emission in 50% of the low-luminosity AGNs of the Palomar Spectroscopic sample (see also Ho 2008). The flux of NGC 6286 at 1.4 GHz is f1.4 GHz=157.4±5.6 mJy (Condon et al. 1998), which implies that the radio loudness is log RX = log ( f1.4 GHz f2 - 10 ) = -2.6 to −3.1, depending on the X-ray spectral model assumed. These values were obtained taking into account only the nuclear emission in the computation of the 2–10 keV flux. Considering the threshold suggested by La Franca et al. (2010; see also Terashima & Wilson 2003; Panessa et al. 2007), log RX = -4.3, NGC 6286 would be classified as a radio-loud AGN. Murphy (2013) reports that the radio spectral index18 of NGC 6286 is alow = -0.73 0.03, amid = -0.89 0.03, and a high = -1.02 0.12 for n < 5 GHz, 1<ν/GHz<10, and ν>10 GHz, respectively. This would point toward a significant contribution of synchrotron emission, possibly from a jet. The two radio sources detected by EVN and coincident with the 3–8 keV core could be in fact associated to a jet and counter jet, consistent with the radio-loud classification of NGC 6286.. stacking Chandra spectra of LIRGs in the Chandra Deep Field-South that 15% of the objects with LIR > 1011 L contain heavily obscured AGNs. By stacking X-ray spectra in different bins of stellar mass they found a significant excess at E=6−7 keV in the stacked spectrum of sources with mass M > 1011M, very likely related to a prominent Fe Kα line, while no clear evidence of AGN activity was found in lessmassive galaxies. Treister et al. (2010b) concluded that there might be a large population of heavily obscured AGNs in high mass galaxies. NGC 6286, with a stellar mass of 1.26 ´ 1011M (Howell et al. 2010), fits extremely well into this scenario in the local Universe. We have shown in Sections 5.1 and 5.3 that NGC 6286 has optical and IR characteristics quite typical of LIRGs and consistent with other galaxies of the GOALS sample for the same merger stage. It is interesting to notice that also the hardness ratio and the observed 2–10 keV luminosity inferred by Chandra are consistent with a large fraction of the objects of the sample of Iwasawa et al. (2011; see Figures 5 and 6 of their paper, respectively), which might indicate that several more heavily obscured low-luminosity AGNs are present in LIRGs of the GOALS sample. Moreover, we have shown that in the low-count regime it is possible to miss obscured AGNs by adopting a simple phenomenological model to reproduce their X-ray spectra. Therefore, there might be a significant population of low-luminosity heavily obscured AGNs in LIRGs that we are missing due to the lack of sensitive hard X-ray observations. Numerical simulations have shown that accretion onto SMBHs might be happening at some level even after the first encounter (e.g., Di Matteo et al. 2005), although the expected accretion rate varies depending on the galaxy mergers code adopted (e.g., Gabor et al. 2015). Our ongoing campaign of NuSTAR observations of ten LIRGs will allow us to study the AGN fraction in merging galaxies in the hard X-ray band across the whole merger sequence. Another object showing similar characteristics to NGC 6286 is IC 883, a LIRG in a late merger stage that was found to host a low-luminosity AGN from radio observations (C. RomeroCañizales et al. 2012b; Romero-Cañizales et al. et al. 2016, in preparation). As for NGC 6286, the IR emission of IC 883 is dominated by star formation and the AGN does not contribute significantly to the energetics of the system. Interestingly, similar to NGC 6268, IC 883 is also reported as a composite AGN/starburst system by Yuan et al. (2010), along with more than one-third of LIRGs from the BGS sample.. 5.4. Heavily Obscured Low-luminosity AGNs in U/LIRGs As discussed above for the case of NGC 6286, the identification of heavily obscured AGNs in LIRGs can be rather difficult if the AGN has a low luminosity. The EW of PAH features would not be significantly affected by the AGN if it is highly obscured, since the gas and dust would shield the PAH-emitting molecules, or if it is not very luminous. A lowluminosity AGN would also be difficult to find by studying the 2.5–5 μm slope since the IR emission would be dominated by the starburst and the AGN emission can still be self-absorbed. Absorption features also would not be able to help if the AGN is not very luminous. A more reliable tracer is [Ne V], but while its detection might indicate the presence of an AGN its nondetection does not exclude it. Moreover, [Ne V] could be created in young starbursts and for low-luminosity AGNs it could be too faint to be detected (see Equation (2)). Radio studies can also give important insights, but since not all AGNs are very strong at these wavelengths results are not always conclusive. Hard X-ray studies are possibly the best way to unveil obscured AGNs in U/LIRGs, although they can also be limited by absorption for log (NH cm-2) 24. By using multiwavelength indicators of AGNs for a subsample of 53 U/LIRGs within the GOALS sample, U et al. (2012) found that ∼60% and ∼25% of ULIRGs and LIRGs host AGNs. Studying the whole GOALS sample, Petric et al. (2011) found that 18% of the LIRGs show evidence of [Ne V] 14.32 μm, and hence might host an AGN. By means of optical spectroscopy, Yuan et al. (2010) found that 59% of the 51 single nuclei galaxies with 11 < log (LIR L ) < 12 in the BGS sample might host an AGN.19 The fraction of AGNs is larger (77%) if one considers only two of the three diagrams for the spectral classification. A significant fraction of the composite systems might hide buried low-luminosity AGNs, as in the case of NGC 6286, although an important contribution to the line emission in these objects might be due to shocks (e.g., Soto et al. 2012). Treister et al. (2010b) have shown by. 6. SUMMARY AND CONCLUSIONS We have reported here the first results of a NuSTAR campaign aimed at observing ten LIRGs in different merger stages, focusing on the first detection of a heavily obscured AGN in NGC 6286. The Chandra/ACIS-S 0.3–2 keV image of the source shows extended emission that covers ∼4.4 kpc (Figure 2) and which might be due to collisionally ionized plasma. In the 3–8 keV band we found a compact source with a flat 1.2–8 keV spectrum (G ~ -0.2), which coincides with the radio emission detected by FIRST. The NuSTAR spectrum also shows a flat X-ray continuum (G ~ 0.5). By analyzing the broadband X-ray spectrum of the source, combining archival XMM-Newton, Chandra, and quasi-simultaneous NuSTAR and Swift/XRT observations, we have found that the source is consistent with being obscured by mildly CT material +0.63 24 -2 (NH = 1.080.38 ´ 10 cm , Figure 6). The presence of a. We consider here the following definition of the spectral index: Fn µ n a . 37% are composite AGN/starburst, 14% Seyfert 2s, 2% Sy1s, and 6% LINERs.. 18 19. 11.
(12) The Astrophysical Journal, 819:4 (13pp), 2016 March 1. Ricci et al.. heavily obscured AGN is confirmed by the possible detection of weak [Ne V] 14.32 m m and [Ne V] 24.32 μm lines (Dudik et al. 2009), by near-IR to radio spectral decomposition (Vega et al. 2008), and by the optical classification of the galaxy as an AGN/starburst composite (Yuan et al. 2010). The buried AGN has an intrinsically low luminosity (L2−10 ∼ 3−20 × 1041 erg s−1), a low value of the Eddington ratio (λEdd ; (0.2−1.2) × 10−3) and seems to contribute less than 1% to the energetics of the system (Figure 7). Because of its low luminosity, previous observations carried out below 10 keV and in the infrared did not notice the presence of a buried AGN. By exploiting the rich multiwavelength coverage of U/LIRGs in the GOALS sample, we have discussed the radio to X-ray characteristics of NGC 6286, showing that they are consistent with those of objects with similar luminosities and in a similar merger stage. We speculated that there might be a significant fraction of low-luminosity AGNs in LIRGs that we are missing due to their low contribution to the total IR flux of the system. In particular, more than one-third of LIRGs from the BGS sample are classified as composite AGN/starburst systems by Yuan et al. (2010), and might hide low-luminosity highly obscured AGNs. The case of NGC 6286 clearly shows the importance of hard X-ray coverage to detect low-luminosity, heavily obscured AGNs in LIRGs. Our ongoing NuSTAR campaign of LIRGs will put better constraints on the fraction of these objects and the relation between obscured accretion and merger stage.. Alonso-Herrero, A., Pereira-Santaella, M., Rieke, G. H., & Rigopoulou, D. 2012, ApJ, 744, 2 Annuar, A., Gandhi, P., Alexander, D. M., et al. 2015, ApJ, 815, 36 Arévalo, P., Bauer, F. E., Puccetti, S., et al. 2014, ApJ, 791, 81 Armus, L., Mazzarella, J. M., Evans, A. S., et al. 2009, PASP, 121, 559 Arnaud, K. A. 1996, in ASP Conf. Ser. 101, Astronomical Data Analysis Software and Systems V, ed. G. H. Jacoby, & J. Barnes (San Francisco, CA: ASP), 17 Asmus, D., Gandhi, P., Hoenig, S. F., Smette, A., & Duschl, W. J. 2015, MNRAS, 454, 766 Assef, R. J., Eisenhardt, P. R. M., Stern, D., et al. 2015, ApJ, 804, 27 Baan, W. A., Salzer, J. J., & LeWinter, R. D. 1998, ApJ, 509, 633 Baldwin, J. A., Phillips, M. M., & Terlevich, R. 1981, PASP, 93, 5 Baloković, M., Comastri, A., Harrison, F. A., et al. 2014, ApJ, 794, 111 Bauer, F. E., Arévalo, P., Walton, D. J., et al. 2015, ApJ, 812, 116 Bauer, F. E., Yan, L., Sajina, A., & Alexander, D. M. 2010, ApJ, 710, 212 Becker, R. H., White, R. L., & Helfand, D. J. 1995, ApJ, 450, 559 Brightman, M., & Nandra, K. 2011, MNRAS, 413, 1206 Burrows, D. N., Hill, J. E., Nousek, J. A., et al. 2005, SSRv, 120, 165 Caputi, K. I., Lagache, G., Yan, L., et al. 2007, ApJ, 660, 97 Caramete, L. I., & Biermann, P. L. 2010, A&A, 521, A55 Cash, W. 1979, ApJ, 228, 939 Condon, J. J. 1992, ARA&A, 30, 575 Condon, J. J., Cotton, W. D., Greisen, E. W., et al. 1998, AJ, 115, 1693 Condon, J. J., Huang, Z.-P., Yin, Q. F., & Thuan, T. X. 1991, ApJ, 378, 65 Di Matteo, T., Springel, V., & Hernquist, L. 2005, Natur, 433, 604 Donley, J. L., Koekemoer, A. M., Brusa, M., et al. 2012, ApJ, 748, 142 Dudik, R. P., Satyapal, S., & Marcu, D. 2009, ApJ, 691, 1501 Eisenhardt, P. R. M., Wu, J., Tsai, C.-W., et al. 2012, ApJ, 755, 173 Franceschini, A., Braito, V., Persic, M., et al. 2003, MNRAS, 343, 1181 Gabor, J. M., Capelo, P. R., Volonteri, M., et al. 2015, arXiv Gabriel, C., Denby, M., Fyfe, D. J., et al. 2004, in ASP Conf. Ser. 314, Astronomical Data Analysis Software and Systems (ADASS) XIII, ed. F. Ochsenbein, M. G. Allen, & D. Egret (San Francisco, CA: ASP), 759 Gandhi, P., Hönig, S. F., & Kishimoto, M. 2015, ApJ, 812, 113 Gandhi, P., Horst, H., Smette, A., et al. 2009, A&A, 502, 457 Gandhi, P., Lansbury, G. B., Alexander, D. M., et al. 2014, ApJ, 792, 117 Garmire, G. P., Bautz, M. W., Ford, P. G., Nousek, J. A., & Ricker, G. R., Jr. 2003, Proc. SPIE, 4851, 28 Gehrels, N., Chincarini, G., Giommi, P., et al. 2004, ApJ, 611, 1005 Georgakakis, A., Rowan-Robinson, M., Nandra, K., et al. 2010, MNRAS, 406, 420 Georgantopoulos, I., Dasyra, K. M., Rovilos, E., et al. 2011a, A&A, 531, A116 Georgantopoulos, I., Rovilos, E., Akylas, A., et al. 2011b, A&A, 534, A23 Glikman, E., Simmons, B., Mailly, M., et al. 2015, ApJ, 806, 218 Goto, T., Takagi, T., Matsuhara, H., et al. 2010, A&A, 514, A6 Goulding, A. D., & Alexander, D. M. 2009, MNRAS, 398, 1165 Harrison, F. A., Craig, W. W., Christensen, F. E., et al. 2013, ApJ, 770, 103 Helou, G., Soifer, B. T., & Rowan-Robinson, M. 1985, ApJL, 298, L7 Ho, L. C. 2008, ARA&A, 46, 475 Howell, J. H., Armus, L., Mazzarella, J. M., et al. 2010, ApJ, 715, 572 Ichikawa, K., Imanishi, M., Ueda, Y., et al. 2014, ApJ, 794, 139 Imanishi, M. 2009, ApJ, 694, 751 Imanishi, M., & Dudley, C. C. 2000, ApJ, 545, 701 Imanishi, M., Maiolino, R., & Nakagawa, T. 2010a, ApJ, 709, 801 Imanishi, M., Nakagawa, T., Shirahata, M., Ohyama, Y., & Onaka, T. 2010b, ApJ, 721, 1233 Imanishi, M., Nakanishi, K., Tamura, Y., Oi, N., & Kohno, K. 2007, AJ, 134, 2366 Imanishi, M., Terashima, Y., Anabuki, N., & Nakagawa, T. 2003, ApJL, 596, L167 Inami, H., Armus, L., Charmandaris, V., et al. 2013, ApJ, 777, 156 Iwasawa, K., Sanders, D. B., Evans, A. S., et al. 2009, ApJL, 695, L103 Iwasawa, K., Sanders, D. B., Teng, S. H., et al. 2011, A&A, 529, A106 Jansen, F., Lumb, D., Altieri, B., et al. 2001, A&A, 365, L1 Kalberla, P. M. W., Burton, W. B., Hartmann, D., et al. 2005, A&A, 440, 775 Kartaltepe, J. S., Sanders, D. B., Le Floc’h, E., et al. 2010, ApJ, 709, 572 Kewley, L. J., Groves, B., Kauffmann, G., & Heckman, T. 2006, MNRAS, 372, 961 Kleinmann, D. E., & Low, F. J. 1970, ApJL, 159, L165 Koss, M., Mushotzky, R., Baumgartner, W., et al. 2013, ApJL, 765, L26 Koss, M. J., Romero-Cañizales, C., Baronchelli, L., et al. 2015, ApJ, 807, 149 Lacy, M., Storrie-Lombardi, L. J., Sajina, A., et al. 2004, ApJS, 154, 166 La Franca, F., Melini, G., & Fiore, F. 2010, ApJ, 718, 368 Lansbury, G. B., Gandhi, P., Alexander, D. M., et al. 2015, ApJ, 809, 115 Le Floc’h, E., Papovich, C., Dole, H., et al. 2005, ApJ, 632, 169. We thank the anonymous referee for comments that helped us to improve the quality of our manuscript, and the NuSTAR Cycle 1 TAC for the NuSTAR data on which this paper is based. C. R. acknowledges C. S. Chang, H. Inami, P. Gandhi and S. Satyapal for their useful discussions. We thank Adam Block (Mount Lemmon SkyCenter/University of Arizona) for allowing us to publish his optical image of NGC 6286/ NGC 6285. This research has made use of the NuSTAR Data Analysis Software (NUSTARDAS) jointly developed by the ASI Science Data Center (ASDC, Italy) and the California Institute of Technology (Caltech, USA), and of the NASA/ IPAC Infrared Science Archive and NASA/IPAC Extragalactic Database (NED), which are operated by the Jet Propulsion Laboratory, California Institute of Technology, under contract with the National Aeronautics and Space Administration. We acknowledge financial support from the CONICYT-Chile grants “EMBIGGEN” Anillo ACT1101 (C. R., F. E. B., E. T.), FONDECYT 1141218 (C. R., F. E. B.), FONDECYT 315238 (C. R. C.), FONDECYT 3150361 (G. P.), BasalCATA PFB–06/2007 (C. R., F. E. B., E. T.), and the Ministry of Economy, Development, and Tourism’s Millennium Science Initiative through grant IC120009, awarded to The Millennium Institute of Astrophysics, MAS (F. E. B., C. R. C.). K. S. gratefully acknowledges support from Swiss National Science Foundation Grant PP00P2_138979/1. M. I. was supported by JSPS KAKENHI Grant Number 23540273 and 15K05030. Facilities: NuSTAR, Chandra, Swift, XMM-Newton.. REFERENCES Aalto, S., Costagliola, S. M. F., Gonzalez-Alfonso, E., et al. 2015, A&A, 584, 42 Abel, N. P., & Satyapal, S. 2008, ApJ, 678, 686 Alexander, D. M., Chary, R.-R., Pope, A., et al. 2008, ApJ, 687, 835. 12.
(13) The Astrophysical Journal, 819:4 (13pp), 2016 March 1. Ricci et al.. Low, J., & Kleinmann, D. E. 1968, AJ, 73, 868 Lutz, D., Veilleux, S., & Genzel, R. 1999, ApJL, 517, L13 Madsen, K. K., Harrison, F. A., Markwardt, C., et al. 2015, ApJS, 220, 8 Magdziarz, P., & Zdziarski, A. A. 1995, MNRAS, 273, 837 Magorrian, J., Tremaine, S., Richstone, D., et al. 1998, AJ, 115, 2285 Mullaney, J. R., Alexander, D. M., Goulding, A. D., & Hickox, R. C. 2011, MNRAS, 414, 1082 Murphy, E. J. 2013, ApJ, 777, 58 Murphy, K. D., & Yaqoob, T. 2009, MNRAS, 397, 1549 Nagar, N. M., Falcke, H., & Wilson, A. S. 2005, A&A, 435, 521 Nandra, K., & Pounds, K. A. 1994a, MNRAS, 268, 405 Nandra, K., & Pounds, K. A. 1994b, MNRAS, 268, 405 Nardini, E., Risaliti, G., Salvati, M., et al. 2008, MNRAS, 385, L130 Nardini, E., Risaliti, G., Watabe, Y., Salvati, M., & Sani, E. 2010, MNRAS, 405, 2505 Panessa, F., Barcons, X., Bassani, L., et al. 2007, A&A, 467, 519 Parra, R., Conway, J. E., Aalto, S., et al. 2010, ApJ, 720, 555 Pereira-Santaella, M., Alonso-Herrero, A., Santos-Lleo, M., et al. 2011, A&A, 535, A93 Petric, A. O., Armus, L., Howell, J., et al. 2011, ApJ, 730, 28 Piconcelli, E., Jimenez-Bailón, E., Guainazzi, M., et al. 2005, A&A, 432, 15 Privon, G. C., Herrero-Illana, R., Evans, A. S., et al. 2015, ApJ, 814, 39 Ptak, A., Heckman, T., Levenson, N. A., Weaver, K., & Strickland, D. 2003, ApJ, 592, 782 Ptak, A., Hornschemeier, A., Zezas, A., et al. 2015, ApJ, 800, 104 Puccetti, S., Comastri, A., Bauer, F. E., et al. 2016, A&A, 585, 157 Ricci, C., Ueda, Y., Ichikawa, K., et al. 2014a, A&A, 567, A142 Ricci, C., Ueda, Y., Koss, M. J., et al. 2015, ApJL, 815, L13 Ricci, C., Ueda, Y., Paltani, S., et al. 2014b, MNRAS, 441, 3622 Ricci, C., Walter, R., Courvoisier, T. J.-L., & Paltani, S. 2011, A&A, 532, A102 Risaliti, G., Imanishi, M., & Sani, E. 2010, MNRAS, 401, 197 Risaliti, G., Maiolino, R., Marconi, A., et al. 2006, MNRAS, 365, 303 Romero-Cañizales, C., Pérez-Torres, M. Á, & Alberdi, A. 2012a, MNRAS, 422, 510 Romero-Cañizales, C., Pérez-Torres, M. A., Alberdi, A., et al. 2012b, A&A, 543, A72 Rovilos, E., Georgantopoulos, I., Akylas, A., et al. 2014, MNRAS, 438, 494 Sanders, D. B., Egami, E., Lipari, S., Mirabel, I. F., & Soifer, B. T. 1995, AJ, 110, 1993 Sanders, D. B., Mazzarella, J. M., Kim, D.-C., Surace, J. A., & Soifer, B. T. 2003, AJ, 126, 1607 Sanders, D. B., & Mirabel, I. F. 1996, ARA&A, 34, 749 Sanders, D. B., Soifer, B. T., Elias, J. H., et al. 1988, ApJ, 325, 74 Sani, E., Risaliti, G., Salvati, M., et al. 2008, ApJ, 675, 96 Sarzi, M., Shields, J. C., Schawinski, K., et al. 2010, MNRAS, 402, 2187 Satyapal, S., Vega, D., Dudik, R. P., Abel, N. P., & Heckman, T. 2008, ApJ, 677, 926 Satyapal, S., Vega, D., Heckman, T., O’Halloran, B., & Dudik, R. 2007, ApJL, 663, L9. Schawinski, K., Simmons, B. D., Urry, C. M., Treister, E., & Glikman, E. 2012, MNRAS, 425, L61 Shepherd, M. C., Pearson, T. J., & Taylor, G. B. 1995, BAAS, 27, 903 Shu, X. W., Yaqoob, T., & Wang, J. X. 2010, ApJS, 187, 581 Soto, K. T., & Martin, C. L. 2010, ApJ, 716, 332 Soto, K. T., & Martin, C. L. 2012, ApJS, 203, 3 Soto, K. T., Martin, C. L., Prescott, M. K. M., & Armus, L. 2012, ApJ, 757, 86 Springel, V., Di Matteo, T., & Hernquist, L. 2005, MNRAS, 361, 776 Stern, D. 2015, ApJ, 807, 129 Stern, D., Eisenhardt, P., Gorjian, V., et al. 2005, ApJ, 631, 163 Stern, D., Lansbury, G. B., Assef, R. J., et al. 2014, ApJ, 794, 102 Stierwalt, S., Armus, L., Charmandaris, V., et al. 2014, ApJ, 790, 124 Stierwalt, S., Armus, L., Surace, J. A., et al. 2013, ApJS, 206, 1 Strüder, L., Briel, U., Dennerl, K., et al. 2001, A&A, 365, L18 Sturm, E., Lutz, D., Verma, A., et al. 2002, A&A, 393, 821 Szokoly, G. P., Bergeron, J., Hasinger, G., et al. 2004, ApJS, 155, 271 Teng, S. H., Brandt, W. N., Harrison, F. A., et al. 2014, ApJ, 785, 19 Teng, S. H., Rigby, J. R., Stern, D., et al. 2015, ApJ, 814, 56 Teng, S. H., Veilleux, S., Anabuki, N., et al. 2009, ApJ, 691, 261 Teng, S. H., Wilson, A. S., Veilleux, S., et al. 2005, ApJ, 633, 664 Terashima, Y., & Wilson, A. S. 2003, ApJ, 583, 145 Treister, E., Natarajan, P., Sanders, D. B., et al. 2010a, Sci, 328, 600 Treister, E., Schawinski, K., Urry, C. M., & Simmons, B. D. 2012, ApJL, 758, L39 Treister, E., Urry, C. M., Schawinski, K., Cardamone, C. N., & Sanders, D. B. 2010b, ApJL, 722, L238 Turner, M. J. L., Abbey, A., Arnaud, M., et al. 2001, A&A, 365, L27 U, V., Sanders, D. B., Mazzarella, J. M., et al. 2012, ApJS, 203, 9 Ueda, Y., Akiyama, M., Hasinger, G., Miyaji, T., & Watson, M. G. 2014, ApJ, 786, 104 Vardoulaki, E., Charmandaris, V., Murphy, E. J., et al. 2015, A&A, 574, A4 Vasudevan, R. V., & Fabian, A. C. 2007, MNRAS, 381, 1235 Vega, O., Clemens, M. S., Bressan, A., et al. 2008, A&A, 484, 631 Veilleux, S., Kim, D.-C., & Sanders, D. B. 1999, ApJ, 522, 113 Veilleux, S., Kim, D.-C., Sanders, D. B., Mazzarella, J. M., & Soifer, B. T. 1995, ApJS, 98, 171 Veilleux, S., & Osterbrock, D. E. 1987, ApJS, 63, 295 Veilleux, S., Rupke, D. S. N., Kim, D.-C., et al. 2009, ApJS, 182, 628 Vignati, P., Molendi, S., Matt, G., et al. 1999, A&A, 349, L57 Weedman, D. W., Hao, L., Higdon, S. J. U., et al. 2005, ApJ, 633, 706 Weisskopf, M. C., Tananbaum, H. D., Van Speybroeck, L. P., & O’Dell, S. L. 2000, Proc. SPIE, 4012, 2 Wilms, J., Allen, A., & McCray, R. 2000, ApJ, 542, 914 Wu, J., Tsai, C.-W., Sayers, J., et al. 2012, ApJ, 756, 96 Yaqoob, T. 2012, MNRAS, 423, 3360 Yuan, T.-T., Kewley, L. J., & Sanders, D. B. 2010, ApJ, 709, 884 Yun, M. S., Reddy, N. A., & Condon, J. J. 2001, ApJ, 554, 803. 13.
(14)
Figure

+4

Documento similar
The spectra of this galaxy was modelled with a narrow (second panel) and a secondary (third panel) kinematical components per emission line plus a broad component under Hα..
Our analysis is guided by the general hypothesis that the regional information offered by national mainstream radio and television news services is reduced and
If the activity of the radio industry and the behaviour of users in the profiles in every radio station on Facebook is extrapolated with what happens on the audience ranking
In fact, according to the self-similar expansion model of Chevalier (1982a,b), the ratio between the maximum velocity inferred from the optical spectral lines in the very early days
We report on quasi-simultaneous 14.4 GHz and 43.1 GHz VLBA observations of the S5 polar cap sample, performed in December 2010 in phase-referencing mode, using
The density distribution of sources detected in at least one IRAC channel has been analyzed as a function of the distance from the cluster center (panel (A) of Figure 5).. The
By far the deepest radio pulsar search so far (1.6-2.4 GHz) (Jaodand, Patruno, Hessels in prep.. Radio pulsar search
Thus, the EEG activities, which appear during stages 2 and 3–4 (N3) of NREM sleep are essentially generated by the activity of neurons in the thalamic reticular nucleus, in
