Temporal variation in richness and composition of recruits in a diverse cnidarian assemblage of subtropical Brazil
9
0
0
Texto completo
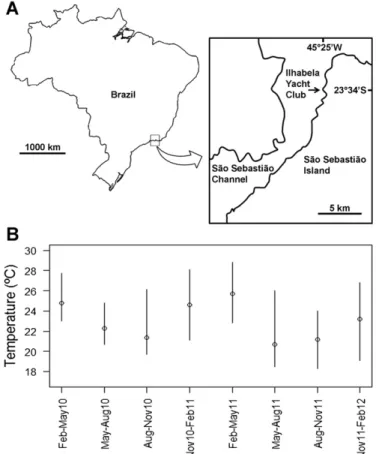
(2) M.O. Fernandez et al. / Journal of Experimental Marine Biology and Ecology 460 (2014) 144–152. Downes, 1982), temporal variation in these chemical signals can determine which species successfully colonize a surface. All of these processes can cause temporal variation in the structure and richness of the settling larval assemblage. After settlement, differential early mortality will further modify the structure of the recruit community found on the surface (Gosselin and Qian, 1997). Therefore, factors affecting early mortality (e.g. substrate heterogeneity, substrate temperature) can further modulate the structure of the recruit assemblage. As time after settlement increases, the more important these pos-settlement factors of mortality become. Indeed, studies on artificial panels find that community development varies relative to both time of submersion (Bram et al., 2005) and colonization success (Keough and Downes, 1982). Interactions between different taxa comprising the local community may have consequences from larval settlement to adult survival (Osman and Whitlatch, 1995; Osman et al., 1989). Competition for space may limit the arrival of new recruits to an established community (Jackson, 1977), while concurrently, post mortality may free space for settlement by new species which may gradually replace existing ones (Minchinton and Scheibling, 1993). Thus, community composition and patterns of species abundance of the recruit and early juvenile stages of epifaunal communities is inexorably related to the time that the surface remains submerged. Here we evaluate whether there are characteristic patterns of temporal variation in richness, species composition and relative abundance of cnidarian species that recruit to highly diverse epifaunal communities of subtropical Brazil, and how these patterns change with time since the substrate was submerged and first colonized by new arrivals. Cnidarians have complex life cycles that usually comprise two main stages: polyp (generally benthic) and medusa (generally planktonic), which sometimes include reduced, derived phases (Marques and Collins, 2004). Hydrozoan cnidarians are the commonest taxa on recruitment panels along Brazilian shores and opportunistic settlement (Calder, 1991b; Migotto et al., 2001) allows them to colonize a variety of habitats and substrates (Gili and Hughes, 1995). Hydrozoan have different modes of sexual (planula and actinula larvae) and asexual (buds, frustules or colony fragments) propagation (Gili and Hughes, 1995). Therefore, rapid larval settlement from the plankton and rapid asexual initial growth of colonies help explain why they quickly show on bare substrates and over other organisms (Boero, 1984; Migotto et al., 2001). It is also common to see some hydroids that develop into relatively large and robust colonies, which can then resist settlement and overgrowth by other sessile invertebrates, such as sponges, tunicates, and bryozoans (Migotto et al., 2001). Seasonal variation in abundance of hydroids has been associated with activity–quiescence cycles (Bavestrello et al., 2006), recruitment (Migotto et al., 2001), and reproduction (Gili and Hughes, 1995), and fluctuations often follow sudden changes in sea surface temperature (Calder, 1990; Migotto et al., 2001). Most studies on cnidarian seasonality have focused on one or few common species (Bavestrello et al., 2006; Calder, 1990; Migotto et al., 2001), while temporal variation in assemblage structure, including richness and relative commonness and rarity in time and space has not been amply reported. Since no previous information exists in this system, our aim here is to evaluate simple hypotheses regarding richness and composition of cnidarian assemblages as they recruit to new surfaces and change over time. Using settling panels replaced every 3 mo we examined whether the total number of species observed after 2 years is primarily the result of different species recruiting over time (high temporal Beta diversity, Anderson et al., 2011), or whether a large fraction of all species is available at any given point in time. The latter means that there is a comparatively low species turnover in time and that studies could estimate cnidarian species richness for the region by increasing sample size a single time. It also implies relatively low seasonality in richness and recruitment of most species, but comparatively high species turnover from month to month. Comparisons with plates submerged throughout the year allowed us to test whether total richness is the result of species. 145. (passively) accumulating on the panels through the year, or whether significantly higher extinctions occurred as species settle and grow in the plates, as expected for instance, if competitive exclusion is important on the plates. Since the spatial distribution of marine organisms is predicted to be bimodal, with abundant and widely distributed core species, and rare and patchily distributed satellite species (Hanski, 1982), we evaluate whether such a core–satellite pattern characterize the cnidarian recruit assemblage in terms of temporal persistence and spatial occupation, as it might be expected from the dependency of species distributions also on sampling time interval (Magurran, 2007). We hypothesized that 1) the long-term (yearly) and typically high hydrozoan species richness is the result of accumulation of species recruiting on different times of the year; 2) the structure (composition and abundance) of the assemblage changes over time; 3) microhabitat (sheltered or exposed plates) influence the cnidarian recruit assemblage structure; and 4) the structure of the cnidarian assemblage after one year converges to a more homogeneous configuration, different than all recruitment events, as observed for instance in rocky shore communities (Caro et al., 2010).. 2. Material and methods 2.1. Study site The study was carried out at the Ilhabela Yacht Club (hereafter Ilhabela), in the São Sebastião Channel (SSC) in southeastern Brazil (23°46′S, 45°25′W). The yacht club is near the São Sebastião harbor, which has been in operation since 1963 (Porto de São Sebastião, 2012). The climate is subtropical with warm and rainy summers and cool and dry winters. The 22 km long and 1.9 to 7.2 km wide SSC separates the continent from the island (Castro et al., 2008, Fig. 1a).. Fig. 1. Study site (A) and monthly mean sea surface temperature (+daily range) during the study (B) in the São Sebastião Channel (Brazil)..
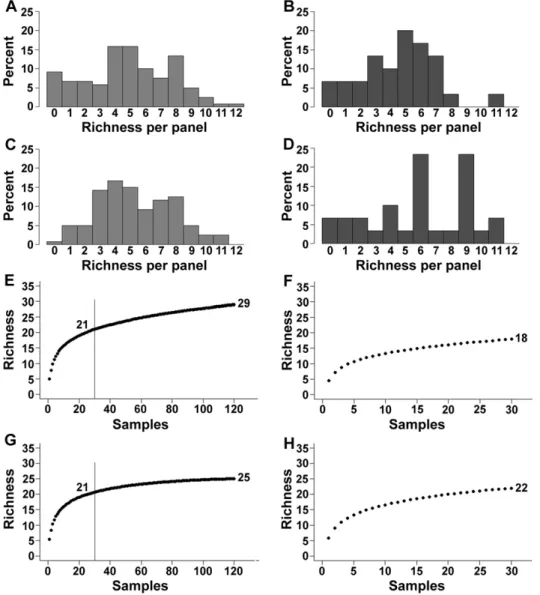
(3) 146. M.O. Fernandez et al. / Journal of Experimental Marine Biology and Ecology 460 (2014) 144–152. The channel is influenced by the Coastal Water mass, occasionally the South Atlantic Central Water mass from late spring to summer and rarely the Tropical Water mass in autumn (Castro et al., 2008). Daily mean sea temperature was obtained at 0.5 m deep at the marine biology center Centro de Biologia Marinha (CEBIMar) located on the continental shore of SSC and 9 km from the Ilhabela Yacht Club. 2.2. Temporal variation in recruitment Recruitment of benthic cnidarian propagules was measured on sets of black experimental test panels conformed by two polyethylene square plates (12 × 12 cm each, 144 cm2 area) parallel to each other and held together with a PVC tube to form ‘sandwich’ with a 2 cm gap between plates. Thus, the experimental panels provided two exposed (outer) surfaces and two sheltered (inner surfaces) within the gap. Inner surfaces were protected from direct solar radiation and from potential large predators, and probably altered hydrodynamics as compared to outer surfaces. Between February 2010 and February 2012, 15 experimental units (30 plates) were deployed 5–20 m apart hanging down from a floating pier at ~ 2 m depth. Panels were submerged simultaneously and retrieved and replaced with clean ones every three months (see Appendix A for specific dates), totaling eight 3-mo intervals and 240 samples. To evaluate differences in species composition, richness and relative abundances between plates submerged for 3 mo and the resultant community after a full year, 15 additional units (30 panels) were deployed in February 2010 and then again in February 2011 and retrieved a year later (February 2011 and 2012, respectively). Cnidarians were identified based on descriptions in the literature (Calder, 1988, 1991a, 1997; Marques, 2001; Migotto, 1996) and only those species identified and those characterized as distinct morphotypes were included in the analysis. Individuals were counted on one exposed (outer) and one sheltered (inner) surface chosen at random from each experimental unit on each time period. Estimates of surface cover were obtained with the aid of a 1 × 1 cm grid that completely covered the plate surface. Following Migotto et al. (2001), each of the 144 squares in the grid was ranked in the following categories: zero (absent), 1 (~ 25%), 2 (~ 50%), 3 (~ 75%), and 4 (100% of the square covered). Total cover per panel was then simply estimated as the sum of the categorical values of all squares (Dethier et al., 1993) and then expressed as percentage of the 144 cm2 plate surface. 2.3. Statistical analysis To provide robust estimates of local richness we used the Jackknife2 estimator implemented in PRIMER v6 (Clarke and Gorley, 2006), which weights in the number of rare species in the total richness (Colwell and Coddington, 1994). To quantify the role of species turnover on temporal changes of species richness we calculated: a) the proportion of the total number of species – observed over the entire two years of the study – that represented the subset of species observed on a single 3 mo period, (i.e., if only two species from a total of 10 appear in a single period, a 0.2 proportion represents this subset of species), b) the proportion of species that changed (those newly encountered or lost) between consecutive periods, i.e., temporal turnover of species (Anderson et al., 2011), c) the proportion of species with different temporal persistence over the study period (i.e. percentage of time in which a species was observed over the study period, from 12.5% to 100%), and d) the proportion of species with different abundances (average cover per panel over the periods each species occur). While these measures are not independent from each other, they quantify different dynamic aspects of species richness in this assemblage. To test whether population abundance was positively correlated with temporal persistence, we assessed the relationship between long-term average cover per panel of each species (across all sampling observations, but not including absences) and their temporal frequency.. Since the relationship was non-linear but showed a characteristic triangular spread (see the Results section), we tested whether the shape of the spread between cover of each species and their temporal frequency was significantly different from random by randomizing the data 10,000 times using EcoSim v7.71 (Gotelli and Entsminger, 2012). Following the core–satellite model proposed by Hanski (1982), and extending it to encompass both, time and space, we evaluated whether the distributions of temporal persistence and of abundances were bimodal. We defined the species present in all periods and abundant (N0.03 mean cover) as ‘core’ species, species present in all periods but with average cover less than 0.1% as ‘satellite’ species, and those found in only one sampling period and with low cover (≤0.1%) as ‘rare’ species. Cutoff values were established for convenience since there is no general convention for this classification. Therefore, we could identify species with extremely low or high temporal and spatial occurrences. To compare the structure, including composition and abundance of cnidarian assemblages between sampling periods and between inner (sheltered) and outer (exposed) panel surfaces, a permutational multivariate analysis of variance (PERMANOVA; Anderson, 2001) was conducted on cover data with 9999 permutations of residuals under a reduced model. A dummy variable was added to the matrix before measuring Bray–Curtis similarities because of the undefined similarities between samples without cnidarian species (Clarke and Gorley, 2006). This analysis considered “Time” (random; 8 levels; with contrasts: first versus second year) and “Surface” (fixed; 2 levels: inner and outer surface; crossed with Time) as factors, with 15 replicates per combination. Differences in homogeneity of multivariate dispersion (Anderson, 2006) between periods were evaluated by PERMDISP pairwise tests (Anderson et al., 2008) based on 9999 permutations. Non-metric multidimensional scaling (nMDS, Clarke, 1993) was used to provide an ordination of samples in the species space and visually evaluate separation between sampling periods and the type of surface. Samples without species were removed from the nMDS ordination. Since it may be difficult to visualize the separation among periods in ordinations with too many samples and categories, we also calculated the centroid of each period (using the principal coordinate axis from the Bray–Curtis similarities) and used nMDS ordination to visualize the multivariate distance among these centroids (Anderson et al., 2008). To characterize any bias of species for one or another surface condition (inner, outer) we calculated the strength of association between abundance and surface condition, using the point-biserial correlation coefficient (De Cáceres and Legendre, 2009) implemented in R (R Core Team, 2012). This correlation is calculated for each species independently, so the pattern observed for one species is independent of the patterns of other species (De Cáceres and Legendre, 2009). Presences inside and absences outside a given group contribute to the strength of the association (De Cáceres and Legendre, 2009). Additionally, average richness and average cover (across all species) were compared between outer and inner surfaces for 3-mo periods using a two-way ANOVA with factors “Time” (random; 8 levels) and “Surface” (fixed; 2 levels). Cover data were arcsin square root transformed to meet homoscedasticity. To compare species richness per panel observed in 3-month intervals versus yearly submersion, – pooling outer and inner surfaces – we constructed frequency histograms of the number of species per panel for 3-month and yearly submersions for each year separately. A two-way ANOVA was used to compare mean species richness between “Submersion Time” (fixed; 2 levels: 3 mo, 1 year) and “Year” (fixed; 2 levels: 2011, 2012) — the two years are considered as fixed, since we cannot make inferences about other years. To determine whether the yearly-submerged panels contained fewer species than expected by the simple accumulation of species observed over all four sets of 3-mo panels in each year, we constructed sample-based rarefaction curves by permutation (Gotelli and Colwell, 2001) for each year and submersion time (3 mo and yearly) and compared total number of species at a fixed sample size of 30 panels..
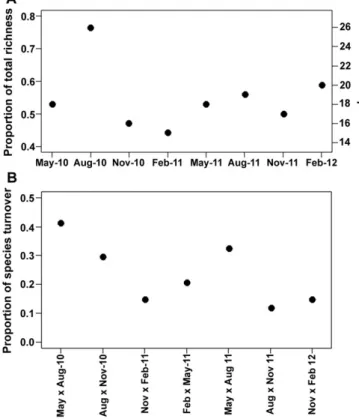
(4) M.O. Fernandez et al. / Journal of Experimental Marine Biology and Ecology 460 (2014) 144–152. 147. Using a separate PERMANOVA and nMDS ordination we compared the structure of the assemblages observed in 1-yr panels against 3-mo panels considering factors “Submersion Time” (fixed; 2 levels: 3 mo, 1 year) and “Year” (fixed; 2 levels: 2011, 2012). All multivariate analyses were performed in PRIMER v6 (Clarke and Gorley, 2006) and PERMANOVA v1.0.5 (Anderson et al., 2008) using Bray–Curtis similarities for cover. Similar weights were applied for all species after fourth root transforming their cover (Clarke and Warwick, 2001). 3. Results 3.1. Sea temperature Sea temperature ranged between 18.3 °C and 28.8 °C in the SSC during the sampling period, with a moderate seasonal signal (Fig. 1b). Mean summer sea temperature reached around 25–26 °C both years, while mean winter sea temperature dropped to about 21 °C (Fig. 1b). Mean sea temperature was similar during both years of study. 3.2. Temporal patterns of species richness and turnover A total of 34 cnidarian taxa (32 hydroids and 2 small, rare anemones) were found in the 3-mo samples over the two years of observations in Ilhabela. The rarefaction curve did not reach an asymptote (Appendix B), suggesting that despite the large sample size of panels (n = 240) and time observations (8 different occasions over 2 years), there are no signs of species saturation. The Jackknife2 estimate was 47 cnidarian species, which is 38% more than the number observed, but the estimate must be interpreted with caution because of lack of saturation. With one exception, species richness on any 3 mo sampling period, represented between 44% and 59% of the total richness observed over the two-years. In other words, nearly half the total richness recorded for the area can be observed in a single 3 mo period. The exception was in August 2010 when richness was greater than 76% of the total richness (Fig. 2a), i.e. less than 24% of all species ever recorded during the study were absent on this particular sampling period. The importance of species turnover from one sampling period to the next varied over time, but it was usually less than 30% of the total richness, with the greatest turnover between the months of May and August in both years (Fig. 2b). The species responsible for the large turnovers were not the same in both years. Only three of them (Bimeria vestita Wright, 1859, Eudendrium carneum Clarke, 1882 and Zyzzyzus warreni Calder, 1988) showed seasonal pattern and, therefore, the larger turnovers between May and August are not due to species seasonality. A clear bimodal pattern of temporal persistence of species (frequencies at which a species was observed through the study) characterized the assemblage (Fig. 3a), with a large fraction of species (N30%) found in only one sampling period, and another large fraction (29%) found in all periods sampled. The remaining species were intermediate in frequencies of occurrence (persistence) over time (Fig. 3a). In contrast, species abundances were unequally distributed between rare and common species — there were many rare species (71% of the cnidarian species covered less than 0.005 of the panel area) and just one common species (Fig. 3b). Species infrequently found over time were also less abundant and the most abundant species tended to be persistently found over time (Fig. 3c) but species with low overall abundance could be either rarely found (just one time) or be found in virtually all sampling periods (Fig. 3c). This relationship between abundance and temporal persistence formed a surface that was not random (10,000 iterations, p = 0.0013), but rather significantly ‘triangular’, which suggests the existence of constraints. The extremes of the triangular distribution had one core species (Obelia dichotoma (Linnaeus, 1758)), one satellite (Turritopsis nutricula McCrady, 1857) and nine rare species. Fig. 2. Number of species observed in 3 mo sampling periods and the proportion that it represents from the total richness observed during the 2 year study (A) and species turnover between successive sampling periods as a proportion of the total number of species (B) at Ilhabela (Brazil).. (Table 1, Fig. 3c). Finally, 11 species (32% of the total) were found on only one or two panels during the entire experiment (Appendix C). 3.3. Temporal and microhabitat variation in assemblage structure The structure (composition and abundance) of the cnidarian assemblage was significantly different among sampling periods (Pseudo-F = 12.7680; P(perm) = 0.0001). Assemblage structures obtained in the 3-mo periods during the first year of the study were different than those observed in 3 -mo periods during the second year (Pseudo-F = 3.3942; P(perm) = 0.0064). Differences in dispersions in assemblage structure did not explain the differences among the sampling periods (PERMDISP, Appendix D). Inner and outer surfaces were also significantly different (Pseudo-F = 8.0800; P(perm) = 0.0024), and the difference was independent of the sampling period (Interaction Pseudo-F = 0.7463; P(perm) = 0.8564). Although assemblage structure was different among sampling periods and between the microhabitat surfaces, a considerable overlap was found in the multivariate species space (Fig. 4a, c). Centroids for the assemblage structure in all periods were relatively dispersed (Fig. 4b), and those of assemblages in similar time periods but in different years, tended to be closer (yet still different) than those in different time periods. Interestingly, similar total richness was found for outer and inner surfaces, 29 and 30 species respectively, and mean richness per panel (species density) per period was the same for both surfaces (p = 0.0783) but cnidarian total abundance on 3-mo panels was significantly different between the two habitat surfaces (p = 0.0001); the outer surface had an average of 67% total cover, while the inner surface averaged 33% cover. Six species were associated with outer surfaces (Table 2), but no species were associated with the inner surface. Three rare species were exclusively found on outer surfaces, and five on inner surfaces (Appendix E)..
(5) 148. M.O. Fernandez et al. / Journal of Experimental Marine Biology and Ecology 460 (2014) 144–152 Table 1 Species and morphospecies recorded from February 2010–2012 at Ilhabela (Brazil), their respective temporal frequencies and average proportion of cover on 3-month samples. Species. Temporal frequency. Average cover. Bougainvillia muscus (Allman, 1863) Clytia cf. gracilis (M. Sars, 1851) Clytia linearis (Thornely, 1900) Eudendrium caraiuru Marques & Oliveira, 2003 Halecium bermudense Congdon, 1907 Halopteris alternata (Nutting, 1900) Lafoeina amirantensis (Millard & Bouillon, 1973) Obelia bidentata Clark, 1875 Obelia dichotoma (Linnaeus, 1758) Turritopsis nutricula McCrady, 1857 Ectopleura crocea (L. Agassiz, 1862) Filellum sp. Bimeria vestita Wright, 1859 Halecium tenellum Hincks, 1861 Sertularella tenella (Alder, 1856) Actiniaria indet.7 Coryne sp. Pennaria disticha Goldfuss, 1820 Corydendrium parasiticum (Linnaeus, 1767) Diphasia digitalis (Busk, 1852) Eudendrium carneum Clarke, 1882 Halecium dyssymetrum Billard, 1929 Plumularia cf. strictocarpa Pictet, 1893 Zyzzyzus warreni Calder, 1988 Actiniaria indet.8 Clytia cf. stolonifera Blackburn, 1938 Haleciidae indet.1 Haleciidae indet.2 Lafoea sp. Monotheca margaretta Nutting, 1900 Pandeidae indet.1 Parawrightia robusta Warren, 1908 Sertularia marginata (Kirchenpauer, 1864) Zanclea sp. a Campanulinidae indet.1 Cladocoryne floccosa Rotch, 1871 a. 1.000 1.000 1.000 1.000 1.000 1.000 1.000 1.000 1.000 1.000 0.875 0.875 0.750 0.750 0.750 0.500 0.500 0.500 0.375 0.375 0.375 0.250 0.250 0.250 0.125 0.125 0.125 0.125 0.125 0.125 0.125 0.125 0.125 0.125. 0.0076 0.0047 0.0067 0.0067 0.0143 0.0134 0.0040 0.0080 0.0325 0.0008 0.0117 0.0011 0.0009 0.0010 0.0015 0.0005 0.0012 0.0028 0.0076 0.0002 0.0011 0.0001 0.0002 0.0009 0.0024 0.0004 0.0004 0.0002 0.0003 0.0001 0.0001 0.0002 0.0001 0.0001. a. species found only in annual samples. Species categories are core (red), satellite (green) and rare (blue).. Fig. 3. Percentage of species observed at varying frequencies during the 2 year study, from one (12.5%) to eight (100.0%) sampling periods (A), percentage of species observed at varying average covers on plates (B) and relationship between average cover and the time frequency at which a species was found at Ilhabela (Brazil), from February 2010 to February 2012 (C). The red dot is the core species Obelia dichotoma, green is the satellite species Turritopsis nutricula and in blue are nine rare species.. of species in yearly-submerged panels due to, for instance, increased extinctions. While richness was similar in 3-mo and yearly submerged panels, composition and abundance (structure) of species in the cnidarian assemblages were significantly different (PERMANOVA, Pseudo-F = 7.0953; P(perm) = 0.0001), and the difference was independent of the year of the study (Pseudo-F = 0.9506; P(perm) = 0.4383). Even though the structure in annual samples was significantly different from that in the 3-mo submersion, the former fell well within the multivariate space defined by the structure of all 3-mo samples (Fig. 6a), and the centroids of annual panels were close to the respective 3-mo samples retrieved at the same moment (Fig. 6b).. 3.4. Assemblage structure after one year of submersion 4. Discussion Two taxa on the annual samples were never observed in the 3-mo samples, totaling 36 species in all panels in both years. The total number of species per panel after one year of submersion was within the range observed in the corresponding 3-mo periods for both years (F = 0.1300; p = 0.7184, Fig. 5a–d). In contrast, richness per panel in both 3-mo samples and 1-year panels, was different between years (F = 4.0690; p = 0.0446) and the differences observed between 3-mo and yearly submerged panels were independent of the year examined (Interaction F = 1.3640; p = 0.2438). The number of species observed in 3-mo periods was the same as that observed in one year panels, after standardizing by sampling effort (Fig. 5e–h, vertical lines). In other words, the larger total number of species in 3-mo panels appears to result from the larger sample size, rather than to a reduction. The 32 hydrozoans in the São Sebastião Channel described here represent 32% of benthic hydrozoans historically recorded in the comparatively well studied state of São Paulo, Brazil (Migotto et al., 2001, 2002). Anthozoans, on the other hand, were not well represented in our experimental plates, with only two species observed in the two years of the 55 species recorded for the state (Silveira and Morandini, 2011). Therefore our analyses and interpretations pertain primarily to the hydrozoan assemblage. Our results show that the richness found in 2 years of experiment is a balanced consequence of two factors: many species capable of recruiting year round, and moderate species temporal turnover, because of a large fraction of temporally rare (infrequent) species in this assemblage. Total richness in 1-yr panels is not a consequence of.
(6) M.O. Fernandez et al. / Journal of Experimental Marine Biology and Ecology 460 (2014) 144–152. Fig. 4. nMDS plots showing differences in the assemblages of cnidarians among the eight sampling periods (A), distances among the centroids for the different time periods (B) and differences in the cnidarian assemblages between inner and outer surfaces (C) at Ilhabela (Brazil), from February 2010 to February 2012. A, B: Solid symbols = first year; hollow symbols = second year. Blue triangle = May; purple square = August; red circle = November; green triangle = February. C: Solid orange symbol = outer surfaces; hollow blue symbol = inner surfaces. The line in (B) connects subsequent periods chronologically.. species accumulating through time since richness in 1-yr panels is similar to 3-mo panels. We found a bimodal pattern for species temporal persistence, with most species divided between rare and abundant species in time, showing that diversity depends on the time sampling interval. Table 2 Species associated with outer surfaces found with the point-biserial correlation coefficient test in eight 3-month periods at Ilhabela (Brazil), from February 2010 to February 2012 (the inner surface had no associations). Species. Stat.. p-Value. Ectopleura crocea Eudendrium caraiuru Halecium bermudense Lafoeina amirantensis Obelia dichotoma Obelia bidentata. 0.161 0.139 0.170 0.154 0.256 0.234. 0.004 0.032 0.008 0.026 0.001 0.001. 149. Through extensive sampling over time, we were able to better characterize richness in the São Sebastião Channel, not because of strong seasonality, but because staggering samples over time captured many of the temporally infrequent species. It is unlikely that increasing sample size at any single time would achieve similar results. This is because of the bimodal time pattern for species distribution, where most species were either present in all time periods or in only one. Although the bimodal core–satellite model was proposed to explain space occupation (Hanski, 1982), our data suggest that it may also apply to occupation over time (Magurran, 2007). Thus, richness in this assemblage is dominated by a set of species capable of recruiting year round, which conform the core of the assemblage, and a large number of temporally rare species, emphasizing the importance of the time component of recruitment as a contributor of species richness and of maintenance of diversity in the assemblage. These findings support our hypotheses that the many factors affecting larval settlement and successful recruitment over time would result in moderate to high temporal turnover in assemblage structure. In contrast, a bimodal pattern was not found when examining spatial occupancy. Many species were rare (along the rare-satellite gradient) and very few were extremely abundant (one core, in this case). We could not identify a set of core species, as shown in other assemblages (McGill et al., 2007). The combined temporal and spatial distributions resulted in a triangular pattern, in which spatially rare species are found at a variety of temporal frequencies, but spatially abundant species are found throughout the year. O. dichotoma was the only core species, abundant and common over time. This species is a cosmopolitan hydrozoan found on a variety of substrates, both in harbors and natural habitats (Cornelius, 1995; Gaonkar et al., 2010; Megina et al., 2013; Millard, 1975; Orejas et al., 2013; Ruiz et al., 2000). It is considered invasive in some regions, such as Australia (Wyatt et al., 2005), and it can inhibit recruitment of some invertebrates (Standing, 1976). Although low in abundance, the satellite species T. nutricula appeared in all periods, even though a previous experiment found it to be restricted to certain time periods in the SSC (as inferred from 1–2 mo test panels, Migotto et al., 2001). It is possible that T. nutricula is changing its local abundance over time because in the study by Migotto et al. (2001) in the same location this species had a greater total annual cover than O. dichotoma. Shifts in local abundance through time are predicted in the core–satellite model (Hanski, 1982), but further studies are needed to determine as to what extent differences between studies could be related to the different lengths of panel submersion employed in experiments. Variation in species composition followed temperature seasonality, with the greatest species turnover following the decline in sea surface temperature between May and August of each year. Yet, most species responsible for large turnover were not the same both years, which suggest that temporal changes in richness may not be due to the seasonal occurrence of the species. We did not observe a similar high turnover of species in the cold to warm water seasonal transition. The structure of the assemblage (considering composition and abundance) was not seasonal either, but instead varied among all 3-mo periods, as well as between the two years of the study. Surprisingly, although greater abundance was found on the outer surfaces of the 3-mo panels, species richness was the same for inner and outer surfaces, which suggests that, over the range observed in the study, increased space occupation, does not lead to increased species extinctions (or reduced colonization). Greater abundance on outer surfaces is probably due to a combination of differential initial growth of colonies, natural mortality patterns and differential predation pressures (Keough and Downes, 1982). Indeed, different regimes of water flow dynamics over the surfaces may have reduced feeding rates for suspension feeders on the inner surfaces (Gili and Hughes, 1995), leading to reduced growth and/or increased mortality. Although some species were exclusive or prevalent to one or another surface, species composition was very similar, suggesting that differences found in multivariate.
(7) 150. M.O. Fernandez et al. / Journal of Experimental Marine Biology and Ecology 460 (2014) 144–152. Fig. 5. Species richness per panel found in 3-month sampling periods (A, C) and annual panels (B, D) for the first (A, B) and the second (C, D) years of the study. Sample-based rarefaction curves for the first year of 3-month periods (E) and annual panels (F), and second year of 3-month periods (G) and annual panels (H) at Ilhabela (Brazil), from February 2010 to February 2012. Vertical lines in E and G indicate richness at the same sample size as annual samples.. structure between inner and outer surfaces are probably due to different abundances. Our results suggest that predation by meso- and macropredators on the outer surfaces of suspended plates is of lesser importance for the structure of hydrozoan assemblage but further studies should evaluate predation effects on natural substrate. Although richness per panel and total richness for 3-mo and yearly panels were the same, their assemblage structures were different.. Thus, limited recruitment of new propagule arrivals to the established yearly assemblage may not be supported. It is more likely that species composition was changing in this assemblage throughout the year, with post-settlement mortality in some species thereby opening space for others (Sutherland and Karlson, 1977). Moreover, there was no convergence of year-old assemblages to a common structure in comparison to 3 mo recruitment plates, unlike the pattern observed, for instance, in. Fig. 6. nMDS plots showing differences in the cnidarian assemblage between the eight 3-month samplings and the two annual samplings (A) and distances among each centroid of the sampling periods (B) at Ilhabela (Brazil), from February 2010 to February 2012. Solid symbols = first year; hollow symbols = second year. Blue triangle = May; purple square = August; red circle = November; green triangle = February; black diamond = 1-year sample. The line in (B) connects sequential points in time (but not the two annual points)..
(8) M.O. Fernandez et al. / Journal of Experimental Marine Biology and Ecology 460 (2014) 144–152. rocky shores of temperate Chilean coast (Caro et al., 2010). Thus, yearly species composition on panels may be the result of several processes taking place. Indeed, they are most similar to 3-mo samples that were retrieved at the same time and place. This, therefore, supports the hypothesis that subtropical fouling assemblages are not directional, but rather simply keep changing with recruitment chance events (Sutherland and Karlson, 1977), and with a moderate role of species competitive or facilitative interactions. In summary, hydrozoan species richness is largely modulated by two types of species, those capable of recruiting to new surfaces year round, and those that for reasons that we do not yet understand, colonize new surface only sporadically and without strong seasonality. This strong bimodal temporal pattern of occurrence is not associated with local ecological success of species, as measured by spatial occupancy of the substrate. Therefore, ecological studies must consider that increasing sampling effort at any one time would not increase species representation as much as increasing temporal effort. Since seasonality in the system was weak, sampling effort would be better off when placed throughout the year. Moreover, the increasing time of submersion of settlement plates does not improve species representation, as the number of species does not accumulate over time. Finally, although important for species abundances, microhabitat differences, a factor commonly considered critical in studies of epifaunal assemblages and represented here by sheltered versus exposed surfaces, can only weakly influence species composition and does not affect species richness at all. Further studies are needed to examine in detail the role of species interactions in the diversity of these assemblages, but our results suggest that they play a moderate role at best. These patterns in hydroids, which were by far the majority of cnidarians, should be tested in other taxa and in other regions to examine the generality of our conclusions. Supplementary data to this article can be found online at http://dx. doi.org/10.1016/j.jembe.2014.06.015. Acknowledgments We thank Alvaro Migotto and Centro de Biologia Marinha (CEBIMar) of the Universidade de São Paulo for offering laboratory support during data collection, the Ilhabela Yacht Club for allowing the sampling in the marina, Thais P. Miranda, Amanda F. Cunha and María de los Angeles Becerríl for sharing their knowledge on hydrozoans, James Roper for providing language assistance, Rosana Rocha and Tito Lotufo for their contributions throughout the study, and an anonymous reviewer for the valuable comments. MOF had a MSc scholarship from FAPESP. SAN thanks support from FAPESP through a visiting science grant (# 2012/ 0519-3) which made this collaboration possible. ACM was supported by FAPESP, CAPES, and CNPq. This work was funded by the project CAPES PROCAD and PROTAX, FAPESP (2010/52324-6, 2011/50242-5, 2013/50484-4), and CNPq (562143/2010-6, 563106/2010-7, 477156/ 2011-8, 458555/2013-4, 458555/2013-4). This publication is a contribution of NP-BioMar, USP. [ST] References Anderson, M.J., 2001. A new method for non-parametric multivariate analysis of variance. Aust. Ecol. 26, 32–46. Anderson, M.J., 2006. Distance-based tests for homogeneity of multivariate dispersions. Biometrics 62, 245–253. Anderson, M.J., Gorley, R.N., Clarke, K.R., 2008. PERMANOVA+ for PRIMER: Guide to Software and Statistical Methods. PRIMER-E, Plymouth. Anderson, M.J., Crist, T.O., Chase, J.M., Vellend, M., Inouye, B.D., Freestone, A.L., Sanders, N.J., Cornell, H.V., Comita, L.S., Davies, K.F., Harrison, S.P., Kraft, N.J.B., Stegen, J.C., Swenson, N.G., 2011. Navigating the multiple meanings of β diversity: a roadmap for the practicing ecologist. Ecol. Lett. 14, 19–28. Bavestrello, G., Puce, S., Cerrano, C., Zocchi, E., Boero, F., 2006. The problem of seasonality of benthic hydroids in temperate waters. Chem. Ecol. 22, 197–205. Benedetti-Cecchi, L., Bertocci, I., Micheli, F., Maggi, E., Fosella, T., Vaselli, S., 2003. Implications of spatial heterogeneity for management of marine protected areas (MPAs): examples from assemblages of rocky coasts in the northwest Mediterranean. Mar. Environ. Res. 55, 429–458.. 151. Bertness, M.D., Gaines, S.D., Hay, M.E., 2001. Marine Community Ecology. Sinauer Associates, Sunderland. Boero, F., 1984. The ecology of marine hydroids and effects of environmental factors: a review. P.S.Z.N.I. Mar. Ecol. 5 (2), 93–118. Bram, J.B., Page, H.M., Dugan, J.E., 2005. Spatial and temporal variability in early successional patterns of an invertebrate assemblage at an offshore oil platform. J. Exp. Mar. Biol. Ecol. 317, 223–237. Butman, C.A., 1987. Larval settlement of soft-sediment invertebrates: the spatial scales of pattern explained by active habitat selection and the emerging role of hydrodynamic processes. Oceanogr. Mar. Biol. Annu. Rev. 25, 113–165. Caffey, H.M., 1985. Spatial and temporal variation in settlement and recruitment of intertidal barnacles. Ecol. Monogr. 55, 313–332. Calder, D.R., 1988. Shallow-water hydroids of Bermuda: the Athecatae. Royal Ontario Museum. Life Sci. Contrib. 148, 1–107. Calder, D.R., 1990. Seasonal cycles of activity and inactivity in some hydroids from Virginia and South Carolina, U.S.A. Can. J. Zool. 68, 442–450. Calder, D.R., 1991a. Shallow-water hydroids of Bermuda: the Thecatae, exclusive of Plumularioidea. Royal Ontario Museum. Life Sci. Contrib. 154, 1–140. Calder, D.R., 1991b. Associations between hydroid species assemblages and substrate types in the mangal at Twin Cays, Belize. Can. J. Zool. 69, 2067–2074. Calder, D.R., 1997. Shallow-water hydroids of Bermuda: superfamily Plumularioidea. Royal Ontario Museum. Life Sci. Contrib. 161, 1–85. Caro, A.U., Navarrete, S.A., Castilla, J.C., 2010. Ecological convergence in a rocky intertidal shore metacommunity despite high spatial variability in recruitment regimes. Proc. Natl. Acad. Sci. U. S. A. 107, 18528–18532. Castro, B.M., Miranda, L.B., Silva, L.S., Fontes, R.F.C., Pereira, A.F., Coelho, A.L., 2008. Processos físicos: hidrografia, circulação e transporte. In: Pires-Vanin, A.M.S. (Ed.), Oceanografia de um ecossistema subtropical: Plataforma de São Sebastião. SP. Editora da Universidade de São Paulo, São Paulo, pp. 59–121. Clarke, K.R., 1993. Non-parametric multivariate analyses of changes in community structure. Aust. J. Ecol. 18, 117–143. Clarke, A., 2009. Temperature and marine macroecology. In: Witman, J.D., Roy, K. (Eds.), Marine Macroecology. The University of Chicago Press, Chicago, pp. 250–278. Clarke, K.R., Gorley, R.N., 2006. PRIMER v6: User Manual/Tutorial. PRIMER-E, Plymouth. Clarke, K.R., Warwick, R.M., 2001. Change in Marine Communities: An Approach to Statistical Analysis and Interpretation, 2nd ed. PRIMER-E, Plymouth. Colwell, R.K., Coddington, J.A., 1994. Estimating terrestrial biodiversity through extrapolation. Philos. Trans. R. Soc. B 345, 101–118. Coma, R., Ribes, M., Gili, J.M., Zabala, M., 2000. Seasonality in coastal benthic ecosystems. Trends Ecol. Evol. 15, 448–453. Cornelius, P.F.S., 1995. North-west European thecate hydroids and their medusae. Part 2. Sertulariidae to Campanulariidae. Synop. Br. Fauna New Ser. 50 (2), 1–386. Cowen, R.K., Sponaugle, S., 2009. Larval dispersal and marine population connectivity. Annu. Rev. Mar. Sci. 1, 443–466. Crowder, L.B., Figueira, W.F., 2006. Metapopulation ecology and marine conservation. In: Kritzer, J., Sale, P.F. (Eds.), Marine Metapopulations. Elsevier Academic Press, San Diego, pp. 491–515. De Cáceres, M., Legendre, P., 2009. Associations between species and groups of sites: indices and statistical inference. Ecology 90 (12), 3566–3574. Dethier, M.N., Graham, E.S., Cohen, S., Tear, L.M., 1993. Visual versus random-point percent cover estimations: ‘objective’ is not always better. Mar. Ecol. Prog. Ser. 96, 93–100. Flores, A.A.V., Negreiros-Fransozo, M.L., 1998. External factors determining seasonal breeding in a subtropical population of the shore crab Pachygrapsus transversus (Gibbes, 1850) (Brachyura, Grapsidae). Invertebr. Reprod. Dev. 34, 149–155. Gaonkar, C.A., Sawant, S.S., Anil, A.C., Krishnamurthy, V., Harkantra, S.N., 2010. Changes in the occurrence of hard substratum fauna: a case study from Mumbai harbour, India. Indian J. Mar. Sci. 39 (1), 74–84. Gili, J.M., Hughes, R.G., 1995. The ecology of marine benthic hydroids. Oceanogr. Mar. Biol. Annu. Rev. 33, 351–426. Gosselin, L.A., Qian, P.Y., 1997. Juvenile mortality in benthic marine invertebrates. Mar. Ecol. Prog. Ser. 146, 265–282. Gotelli, N.J., Colwell, R.K., 2001. Quantifying biodiversity: procedures and pitfalls in the measurement and comparison of species richness. Ecol. Lett. 4, 379–391. Gotelli, N.J., Entsminger, G.L., 2012. EcoSim: Null Models Software for Ecology. Version 7. 71Acquired Intelligence Inc. Hadfield, M.G., 2011. Biofilms and marine invertebrate larvae: what bacteria produce that larvae use to choose settlement sites. Annu. Rev. Mar. Sci. 3, 453–470. Hanski, I., 1982. Dynamics of regional distribution: the core and satellite species hypothesis. Oikos 38, 210–221. Hubbell, S.P., 1997. A unified theory of biogeography and relative species abundance and its application to tropical rain forests and coral reefs. Coral Reefs 16, S9–S21 (Suppl.). Jackson, J.B.C., 1977. Competition on marine hard substrates: the adaptive significance of solitary and colonial strategies. Am. Nat. 111, 743–767. Jenkins, S.R., 2005. Larval habitat selection, not larval supply, determines settlement patterns and adult distribution in two chthamalid barnacles. J. Anim. Ecol. 74, 893–904. Keough, M.J., Downes, B.J., 1982. Recruitment of marine invertebrates: the role of active larval choice and early mortality. Oecologia 54, 348–352. Magurran, A.E., 2007. Species abundance distributions over time. Ecol. Lett. 10, 347–354. Marques, A.C., 2001. O gênero Eudendrium (Hydrozoa, Anthomedusae, Eudendriidae) no Brasil. Pap. Avulsos Zool. 41, 329–405. Marques, A.C., Collins, A.G., 2004. Cladistic analysis of Medusozoa and cnidarian evolution. Invertebr. Biol. 123, 23–42. McGill, B.J., Etienne, R.S., Gray, J.S., Alonso, D., Anderson, M.J., Benecha, H.K., Dornelas, M., Enquist, B.J., Green, J.L., He, F., Hurlbert, A.H., Magurran, A.E., Marquet, P.A., Maurer, B.A., Ostling, A., Soykan, C.U., Ugland, K.I., White, E.P., 2007. Species abundance.
(9) 152. M.O. Fernandez et al. / Journal of Experimental Marine Biology and Ecology 460 (2014) 144–152. distributions: moving beyond single prediction theories to integration within an ecological framework. Ecol. Lett. 10, 995–1015. Megina, C., González-Duarte, M.M., López-González, P.J., Piraino, S., 2013. Harbours as marine habitats: hydroid assemblages on sea-walls compared with natural habitats. Mar. Biol. 160, 371–381. Migotto, A.E., 1996. Benthic shallow water hydroids (Cnidaria, Hydrozoa) of the coast of São Sebastião, Brazil, including a checklist of the Brazilian hydroids. Zool. Verh. 306, 1–125. Migotto, A.E., Marques, A.C., Flynn, M.N., 2001. Seasonal recruitment of Hydroids (Cnidaria) on experimental panels in the São Sebastião Channel, Southeastern Brazil. Bull. Mar. Sci. 68, 287–298. Migotto, A.E., Marques, A.C., Morandini, A.C., Silveira, F.L., 2002. Checklist of Cnidaria Medusozoa of Brazil. Biota Neotrop. 2, 1–31. Millard, N.A.H., 1975. Monograph on the Hydroida of southern Africa. Ann. S. Afr. Mus. 68, 1–513. Minchinton, T.E., Scheibling, R.E., 1993. Free space availability and larval substratum selection as determinants of barnacle population structure in a developing rocky intertidal community. Mar. Ecol. Prog. Ser. 95, 233–244. Nandakumar, K., 1996. Importance of timing of panel exposure on the competitive outcome and succession of sessile organisms. Mar. Ecol. Prog. Ser. 131, 191–203. Narváez, D.A., Navarrete, S.A., Largier, J., Vargas, C.A., 2006. Onshore advection of warm water, larval invertebrate settlement, and relaxation of upwelling off central Chile. Mar. Ecol. Prog. Ser. 309, 159–173. Navarrete, S.A., 2007. Maintenance of biodiversity. In: Denny, M.W., Gaines, S.D. (Eds.), Encyclopedia of Tidepools and Rocky Shores. University of California Press, Los Angeles, pp. 76–81. Navarrete, S.A., Broitman, B.R., Menge, B.A., 2008. Interhemispheric comparison of recruitment to intertidal communities: pattern persistence and scales of variation. Ecology 89, 1308–1322. Orejas, C., Rossi, S., Peralba, A., García, E., Gili, J.M., Lippert, H., 2013. Feeding ecology and trophic impact of the hydroid Obelia dichotoma in the Kongsfjorden (Spitsbergen, Arctic). Polar Biol. 36, 61–72. Osman, R.W., Whitlatch, R.B., 1995. The influence of resident adults on recruitment: a comparison to settlement. J. Exp. Mar. Biol. Ecol. 190, 169–198. Osman, R.W., Whitlatch, R.B., Zajac, R.N., 1989. Effect of resident species on recruitment into a community: larval settlement versus post-settlement mortality in the oyster Crassostrea virginica. Mar. Ecol. Prog. Ser. 54, 61–73.. Palardy, J.E., Witman, J.D., 2011. Water flow drives biodiversity by mediating rarity in marine benthic communities. Ecol. Lett. 14, 63–68. Palardy, J.E., Witman, J.D., 2014. Flow, recruitment limitation, and the maintenance of diversity in marine benthic communities. Ecology 95, 286–297. Pineda, J., Porri, F., Starczak, V., Blythe, J., 2010. Causes of decoupling between larval supply and settlement and consequences for understanding recruitment and population connectivity. J. Exp. Mar. Biol. Ecol. 392, 9–21. Porto de São Sebastião, 2012. Autoridade Portuária. http://www.portodesaosebastiao. com.br (Accessed in 10/08/2012). R Core Team, 2012. R: A Language and Environment for Statistical Computing. R Foundation for Statistical Computing, Vienna, Austria (http://www.R-project.org/. Accessed in 05/08/2012). Ruiz, G.M., Fofonoff, P., Carlton, J.T., Wonham, M.J., Hines, A.H., 2000. Invasions of coastal marine communities in North America: apparent patterns, processes, and biases. Annu. Rev. Ecol. Syst. 31, 481–531. Santelices, B., 1990. Patterns of reproduction, dispersal and recruitment in seaweeds. Oceanogr. Mar. Biol. Ann. Rev. 28, 177–276. Silveira, F.L., Morandini, A.C., 2011. Checklist dos Cnidaria do Estado de São Paulo, Brasil. Biota Neotrop. 11, 1–10. Standing, J.D., 1976. Fouling community structure: effects of the hydroid, Obelia dichotoma, on larval recruitment. In: Mackie, G.O. (Ed.), Coelenterate Ecology and Behavior. Plenum Press, New York, pp. 154–164. Sutherland, J.P., 1981. The fouling community at Beaufort, North Carolina: a study in stability. Am. Nat. 118, 499–519. Sutherland, J.P., Karlson, R.H., 1977. Development and stability of the fouling community at Beaufort, North Carolina. Ecol. Monogr. 47 (4), 425–446. Watson, J.R., Hays, C.G., Raimondi, P.T., Mitarai, S., Dong, C., McWilliams, J.C., Blanchette, C.A., Caselle, J.E., Siegel, D.A., 2011. Currents connecting communities: nearshore community similarity and ocean circulation. Ecology 92, 1193–1200. Wyatt, A.S.J., Hewitt, C.L., Walker, D.I., Ward, T.J., 2005. Marine introductions in the Shark Bay World Heritage Property, Western Australia: a preliminary assessment. Divers. Distrib. 11, 33–44..
(10)
Figure
Documento similar
Zooplankton abundance, species richness, diversity, and assemblage composition 23.. differed significantly among treatments, and post-inundation temperature and pH
This study aims to estimate the impact of the land cover change from shrubs to oil palm plantation on mammal species richness, evenness, and composition and estimate the amount
The expansionary monetary policy measures have had a negative impact on net interest margins both via the reduction in interest rates and –less powerfully- the flattening of the
Jointly estimate this entry game with several outcome equations (fees/rates, credit limits) for bank accounts, credit cards and lines of credit. Use simulation methods to
In our sample, 2890 deals were issued by less reputable underwriters (i.e. a weighted syndication underwriting reputation share below the share of the 7 th largest underwriter
In winter, both species richness and abun- dance of birds decreased westwards, a result which supports the view that the regional pat- terns of bird abundance are influenced by
Particularly, we examined which meadow attributes (i.e., seagrass leaf area and density, cover and richness of associated algae, and biomass of leaf epiphytes) and envi- ronmental
10.3390/agriculture12122053/s1, Table S1 Planthoppers and leafhoppers captured during blow-vac sampling; Figure S1: Species richness, abundance and density of herbivores (all
