PAPER • OPEN ACCESS
Analysis of Deterioration in a Plasma Focus
Device
To cite this article: Daniel Zanelli et al 2018 J. Phys.: Conf. Ser. 1043 012049
View the article online for updates and enhancements.
Related content
A Method to Obtain Higher Current Density in the Plasma Focus
Masato Itoh, Kenichi Hatori and Katsumi Hirano
-Morphological and structural effects on tungsten targets produced by fusion plasma pulses from a table top plasma focus
M.J. Inestrosa-Izurieta, E. Ramos-Moore and L. Soto
-Reliability analysis on a shell and tube heat exchanger
S Lingeswara, R Omar and T I Mohd Ghazi
-Analysis of Deterioration in a Plasma Focus Device
Daniel Zanelli1,∗, Enrique L´opez1, Cristian Pavez2,3,4, Jos´e Pedreros3, Jalaj Jain3,5, Gonzalo Avaria2,3,4, Jos´e Moreno2,3,4, Biswajit Bora2,3,4, Sergio Davis2,3,4 and Leopoldo Soto2,3,4,∗
1 Facultad de Ciencias F´ısicas y Matem´aticas, Universidad de Chile 2 Comisi´on Chilena de Energ´ıa Nuclear, Casilla 188-D, Santiago Chile
3 Center for Research and Applications in Plasma Physics and Pulsed Power P4, Chile 4 Universidad Andres Bello, Departamento de Ciencias F´ısicas, Rep´ublica 220, Santiago, Chile 5 Universidad de Talca, Chile
∗email: [email protected], [email protected]
Abstract. The Plasma Focus (PF) is a kind of dense transient plasmas in with high-pulsed voltage. To produce devices for eld application it is necessary to obtain PF equipment able to operate for a long period of time. Thus, a reliability analysis is indispensable. In this work a reliability analysis program for plasma focus devices is presented. The program considers a criticality analysis using Failure Modes and Effects Criticality Analysis (FMECA) to identify the most important failure modes of the system. Said failure modes are studied operating the Plasma Focus for many cycles, obtaining from them the characteristic curves ofV(t) and ˙I(t). Feature Extraction (FE) techniques are applied to obtain a list of parameters that correlate to the degrading process. Furthermore, Machine Learning tools are used to learn from the obtained data, linking the changes in these parameters during its life cycle to the decay of the system in hope for future implementation of a predictive maintenance system and a reference for data analysis and prediction in PFs. The study was applied to a portable plasma focus device operated at 2 joules of stored energy.
1. Introduction
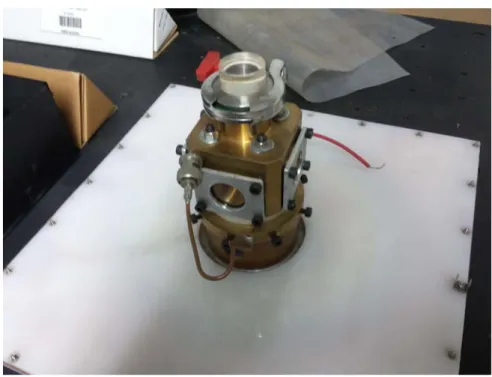
Figure 1. Photograph of PF-2J
most critical failure mode using Feature Extraction techniques to compare a linear model and a nonlinear Neural Network (NN) model.
1.1. The PF-2J Device
A portable plasma focus operating at few joules for field applications was designed and constructed at CCHEN. The device, PF-2J, including the capacitor, spark-gap, discharge chamber and power supply is portable in a hand luggage with a total weight of less than 1.5kg. The capacitor has 120nF. The measured total external inductance is 40nH. The total impedance of the generator is in the order of 0.58Ω. The device operates from 6 to 8kV
charging voltage (i.e. ∼2−4J), achieving 9 to 13kA in 120ns. Figure 1 shows a photograph of the PF-2J.
2. Failure Modes and Effects Criticality Analysis
When performing the analysis, a series of key elements were considered, with their respective failure modes: the severity that this failure mode entails, the detectability of the failure and its probability of occurrence.
Each of these elements are assigned a value between 0 and 10 to describe the failure mode. Later a criticality factor is determined by the multiplication of these values. The results of this preliminary analysis is shown in table 1.
From this table a tendency of certain failure modes to be much more critical than others can clearly be seen. Specifically for the Insulator, the deposition of a conductive film around it has become the most critical failure mode, as well as the most frequent cause of failure for most PF equipments.
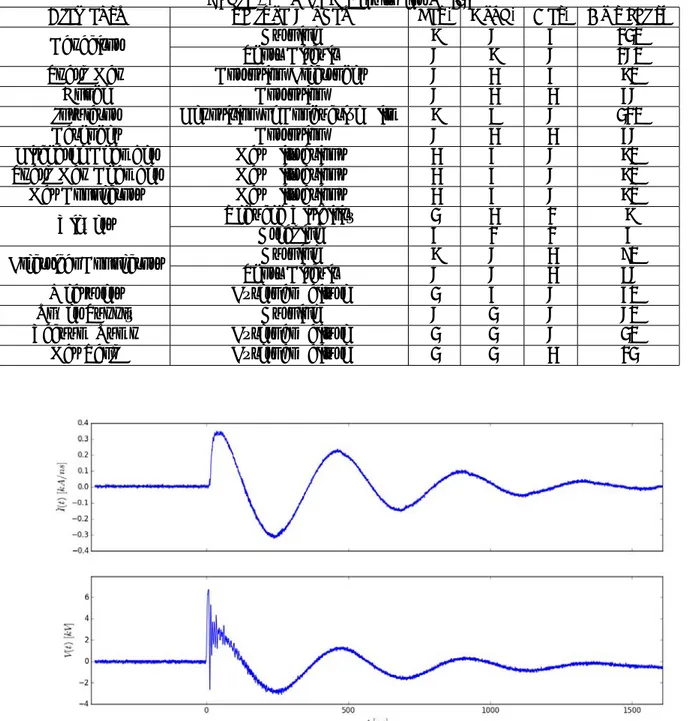
Table 1. FMECA Results for PF-2J
Elements Failure Modes Sev. Prob. Det. Criticality
Capacitor Burning 6 5 4 120
Short Circuit 5 6 5 150 Spark Gap Corrosion Electrodes 5 3 4 60
Anode Corrosion 5 3 3 45
Insulator Deposition of Conductive Film 6 7 5 210 Cathodes Corrosion 5 3 3 45 Discharge Chamber Gas Filtrations 3 4 5 60 Spark Gap Chamber Gas Filtrations 3 4 5 60 Gas Connectors Gas Filtrations 3 4 5 60 Viewers Reduced Visibility 2 3 1 6
Breaking 4 1 1 4
Electrical Connectors Burning 6 5 3 90 Short Circuit 5 5 3 75 Measurers External Failure 2 4 5 40 Power Supply Burning 5 2 5 50 Vacuum Pump External Failure 2 2 5 20 Gas Tank External Failure 2 2 3 12
Figure 2. Caracteristic Signals of PF-2J in a shot with absence of z-pinch
3. Caracteristic Signals and Feature Extraction
Figure 3. Caracteristic Signals of PF-2J in a shot with z-pinch at 95[ns]
For this reason, another program has been developed in python that analyzes the signals and extracts parameters that describe it in several ways. Here comes the F eature Extraction
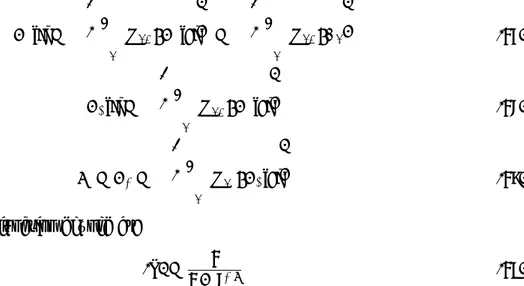
concept, as it is presented in [16], where signal data analysis is performed. In this case, the chosen features are described in equations 1 to 4, wherenj is thej element of the function, uis the mean, σ is the standard deviation andN is the number of elements in the function.
Kurtosis=
N
j=1(nj−u)4
(N−1)σ4 (1)
Clearance Indicator= max|n|
1 N
N
j=1(nj)2
(2)
Shape Indicator=
1 N
N
j=1(nj)2 1
N
N
j=1|nj|
(3)
ClearanceIndicator= max|n|
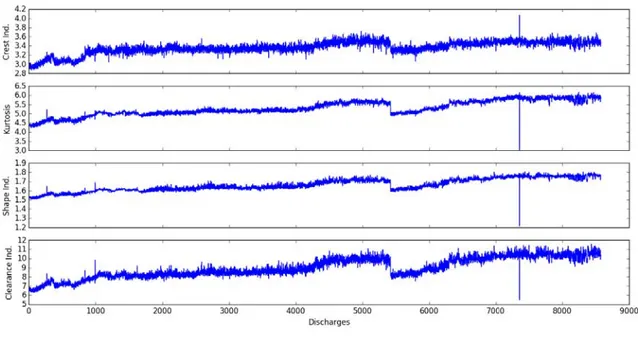
(N1 Nj=1|nj|)2 (4) The results of the evolution of the mentioned features as a function of the number of discharges are shown below. In the figure 4 the values of Kurtosis, Crest Indicator, Clearance Indicator and Shape Indicator for ˙I(t) are shown, in the figure 5 the same features for theV(t) signal are shown.
Figure 4. Feature Extraction of ˙I(t)
Figure 5. Feature Extraction of V(t)
ΔFx= F(Nx)−F(N = 1000)
4. Degradation Models
According to the data that arise from the experiment, relationships can be established between the evolutions of the different characteristic features over time with the advance in the life cycle of the equipment.
To approach the model that allows to correlate these states, an analytical relationship can be established between a multidimensional space, the features, towards a one-dimensional space, the wear and tear. Hence it can be denoted −→F to the vector that contains all features after normalization. It is crucial to normalize the features to a point of reference so that the model can be applied to multiple experiments.
If a relationship exists between the change in features and the wear of the equipment, it can be assumed that there is a function Y such that:
Y(·) :n→ |Y(−→F) =N (6)
WhereN is the amount of discharges that the insulator of the equipment has endured until an arbitrary time.
4.1. Estimating N With a Linear Combination
The first approach to estimate this function could be to opt for linear behavior. Although there is a loss of information given by the approximation of the curves 4 and 5 to a linear behavior, the fact that the phenomenon is seen in several dimensions allows for eliminating sources of noise, while maintaining a simple and direct approach.
For this, the noise of the curvesFi(N) is reduced by using theSignal library of python using the function signal.lf ilter() and then a linear interpolation in order to obtain an analytical resolution for the estimation of N, for each of theFi. That is to say:
−
Where yi = mi cdotFi +ni represents the equation of the interpolated line for the inverse graphs of Fi(N).
This way, a linear estimation of the number of discharges made for each parameter can be obtained. However, now there are many estimates for the same result. Considering that it is possible to make a global estimate ofN as a linear combination of the estimates for each feature:
Nest=C1·N1est+C2·N2est+C3·N3est+...+Cn·Nnest Nest =
i
Ci·Niest (8)
In this equation all theNiest are known for each of the n features and N discharges, so the coefficients that best represent reality can be found, contrasting them with the real number of shots corresponding to the feature vector. To find the coefficients Ci of each of these features, a crucial problem occurs in the change of dimensionality, because n corresponds to the total number of features and N to the total number of discharges , there are n ∼10 variables and
1 =C1·N1est(1) +C2·N2est(1) +...+Cn·Nnest(1)
And the same for the nextnequations:
n+ 1 =C1·N1est(n+ 1) +C2·N2est(n+ 1) +...+Cn·Nnest(n+ 1)
This wayN/nlinear systems can be solved to obtain thencoefficientsCi,N/ntimes. These systems can be expressed in a matrix form for simplicity:
⎡
This way the number of discharges made by the equipments can be estimated through a linear combination of features.
Nest =
i
Ci·Fi (13)
Using the experimental data, the predictions ofNestcan be found by solving the linear system for the features presented in 4 and 5, obtaining an estimate ofN for each set of features as shown in figure 6.
4.2. Estimating N With a Neural Network
Considering that a linear analysis is simple, fast and of good results, it is an analysis that can be too basic for such a complex problem. We are not only extrapolating the data getting away from the real spectrum once, but twice, thanks to the estimates of Niest and Ci.
Which is why a model of neural networks is proposed. It allows to iteratively relate the collected data, in order to approximate the ideal functionY(−→F). In this study a neural network of 4 layers is used, 2 visible and 2 hidden, as shown in the figure 7.
Figure 6. Estimates of N with Linear Combination. Note that the discontinuity at N ≈5500 present in all features (figures 4 and 5) is due to the disassembly of the spark-gap, nevetheless it returns to the trend.
Figure 7. Diagram of Neural Network Used
For simplicity, the number of nodes in layers 1 and 2 was chosen as half of nodes in the previous layer, thus ensuring a smooth transition in dimensional reduction. Therefore the dimensions of the matrices W0,W1 yW2 are (n×n2), (n2 ×n4) and (n4 ×1), respectively.
This neural network consists of a basicPerceptron of two hidden layers, where each neuron of the hidden layers acts according to the sigmoid function of the linear combination of each Fi
L1[i] =
σ
With the sigmoid function defined as:
σ
(x) = 11 +e−x (17)
The neural networks initially operate using matrices of weights generated at random, then the error is calculated according to the prediction made in contrast to the actual value provided by the training data. This error is propagated from the last layer to each of the nodes, allowing to know what the impact of each weight to the final error using thebackpropagation technique. This technique along with many neural network operations are extensively detailed in [17].
With this neural network an analysis can be made to the data to obtain an estimate ofN, as in the linear combination analysis. Using the same parameters studied in the previous model, the neural network is trained by associating the series of features with a value of N.
It should be noted that the data was delivered to the neural network in a random order, without losing the correspondence between a series of values −→F and the N associated to each. This ensures that learning is not distorted by the chronological order of the data, resulting in the graph shown in figure 8
5. Conclusion
From this analysis it can be said that by observing the characteristic signals emitted during a regular discharge of a PF equipment, certain descriptive features can be obtained and aid in determining the current state of the equipment.
Furthermore, it can be concluded that rough predictions can be made about the discharges made by observing certain key parameters. In particular, Kurtosis, Shape Indicator, Clearance Indicator and Crest Indicator of the characteristic signals V(t) and ˙I(t). Furthermore the actual state of degradation of the PF equipment can be estimated through linear combination and neural network approaches.
Considering that the shape indicator, clearance indicator, kurtosis and crest indicator increase as the experiment evolves, this can be characterized as one phenomenon: the damping of the oscilation is greater. This explains the evolution of these parameters simultaneously. On the other hand, it is a good option to rely on a range of parameters that make evidence of the same phenomenon since they ensure that it is a global trend and not a corruption of the data.
In such a problem it can be seen from the figures 6 and 8 that a nonlinear neural network approach is much more suitable for determining a function that reduces the dimensionality spectrum, as is Y(−→F).
Describing the overall performance and deterioration is crucial to arrive at better designs and best practices in plasma focus devices. Although this represents an initial model for un-derstanding the degradation of the PF-2J, future research is important to understand the wear phenomenon in plasma focus devices and similar equipment.
Acknowledgement
The work is supported by IAEA CRP contract 20370 and by grant ACT-1115, CONICYT, Chile.
References
[1] Leopoldo Soto, Plasma Physics and Controlled Fusion 47, A361 (2005) New Trends and Future Perspectives on Plasma Focus Research
[2] Ariel Tarife˜no, Cristian Pavez, Jos´e Moreno and Leopoldo Soto, IEEE Trans. Plasma Science, 39, 756 (2011) Dynamics and Density Measurements in a Small Plasma Focus of Tens of Joules Emitting Neutrons [3] P. Silva, J. Moreno, L. Soto, L. Birstein, R. Mayer, W. Kies, Applied Physics Letters 83, 3269 (2003) Neutron
Emission from a Fast Plasma Focus of 400 Joules
[4] Leopoldo Soto, Patricio Silva, Jos´e Moreno Moreno, Marcelo Zambra, Walter Kies, Roberto E. Mayer, Alejandro Clausse, Luis Altamirano, Cristian Pavez, and Luis Huerta J. Phys. D: App. Phys. 41, 205215 (2008). Demonstration of neutron production in a table top pinch plasma focus device operated at only tens of joules.
[5] Leopoldo Soto, Cristian Pav´ez, Jos´e Moreno, Luis Altamirano, Luis Huerta, Mario Barbaglia, Alejandro Clausse, and Roberto E. Mayer, Physics of Plasmas 24, 082703 (2017) Evidence of nuclear fusion neutrons in an extremely small plasma focus device operating at 0.1 Joules
[6] Mario Barbaglia, Horacio Bruzzone, H. Acu˜na, Leopoldo Soto and Alejandro Clausse, Plasma Physics and Controlled Fusion 51, 045001 (2009) Experimental study of the hard x-ray emissions in a Plasma Focus of hundreds of Joules
[7] Cristian Pavez and Leopoldo Soto, IEEE Trans. Plasma Science, 38, 1132 (2010) Demonstration of x-ray Emission from an ultraminiature pinch plasma focus discharge operating at 0.1 J. Nanofocus
[8] C Pavez, M Zambra, F Veloso, J Moreno and L Soto, Journal of Physics: Conference Series 511, 012028 (2014) Potentiality of a table top plasma focus as X-ray source: Radiographic applications
[10] Leopoldo Soto, Cristian Pavez, Fermin Castillo, Felipe Veloso, Jos´e Moreno, and S. K. H. Auluck, Physics of Plasmas 21, 072702 (2014) Filamentary structures in dense plasma focus: current filaments or vortex filaments
[11] C. Pavez, J. Pedreros, A. Tarife˜no Saldivia and L. Soto, Physics of Plasmas 22, 040705 (2015) Observations of plasma jets in a table top plasma focus discharge
[12] M.J. Inestrosa-Izurieta, E. Ramos-Moore and L. Soto, Nuclear Fusion 55, 093011 (2015) Morphological and structural effects on tungsten targets produced by fusion plasma pulses from a table top plasma focus [13] J. Jain, J. Moreno, R. Andaur, R. Armisen, D. Morales, K. Marcelain, G. Avaria, B. Bora, S. Davis, C.
Pavez, and L. Soto, AIP Advances 7, 085121 (2017) Hundred joules plasma focus device as a potential pulsed source for in vitro cancer cell irradiation
[14] Leopoldo Soto, Cristian Pavez, Ariel Tarife˜no, Jos´e Moreno and Felipe Veloso, Plasma Sources Sci. and Technol. 19, 055017 (2010) Studies on scalability and scaling laws for the plasma focus: similarities and differences in devices from 1MJ to 0.1J
[15] L. Soto, C. Pavez, J. Moreno, J. Pedreros and L. Altamirano, Journal of Physics: Conference Series 511, 012032 (2014) Non-radioactive Source for Field Applications Based in a Plasma Focus of 2J: Pinch evidence
[16] Kwok L. Tsui, Nan Chen, Qiang Zhou, Yizhen Hai, Wenbin Wang. 2015. Mathematical Problems in Engineering Volume 2015, Article ID 7931612015. Prognostics and Health Management: A Review on Data Driven Approaches
![Figure 3. Caracteristic Signals of PF-2J in a shot with z-pinch at 95[ns]](https://thumb-us.123doks.com/thumbv2/123dok_es/3663801.636760/5.892.164.772.201.520/figure-caracteristic-signals-pf-j-shot-pinch-ns.webp)