TítuloDoes debt predict growth? An empirical analysis of the relationship between total debt and economic output
25
0
0
Texto completo
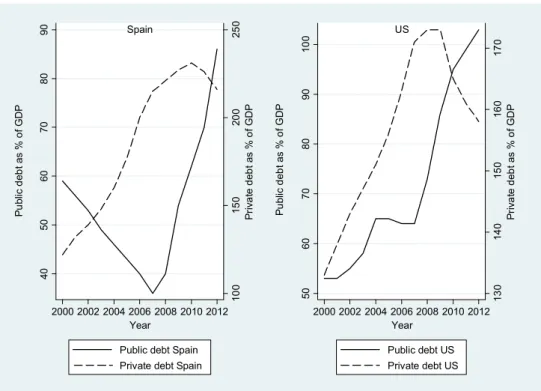
(2) Vanlaer, Marneffe, Vereeck, Van Overtveldt ● Does debt predict growth?. 1. Introduction Scholars and policy makers agree in general that debt, both public and private, has played an important role in the build up to the recent global financial crisis (e.g. Reinhart and Rogoff, 2010, Mian and Sufi, 2014). An increasing number of researchers assert that the high levels of debt commonly found in developed economies, play an important role in the subsequent slow recovery (e.g., Reinhart, Reinhart and Rogoff, 2012 and Chatterjee, 2013). One important strand of research looks into the role of public debt in destabilizing an economy. When there are increasing doubts about the fiscal sustainability of a country, households and corporations anticipate future elevated taxes, which results in reduced consumption and investment1. Subsequently, as the risk of a default increases, government debt holders will demand higher interest rates, which makes it even harder for a government to service its debt. This point of view has dominated public policy – and research – in the immediate aftermath of the crisis. An excellent illustration is the preeminence of austerity measures to deal with the outfall of the global financial crisis, both in Europe and in the United States and advocated by international institutions such as the IMF (e.g. IMF, 2010). Only in the last few years, research has looked into the role of private debt, or credit2, on economic growth (e.g. Taylor and Corrado, 2012). Previously, the narrative of hyperrational private households and companies who make decisions in their own interest that also benefit society as a whole, had prevailed. Moreover, as net world debt is zero, the consensus view was that losses to creditors are automatically cancelled out by gains to debtors. The fallout of the collapse in house prices in the United States in 2007 clearly proved this assumption to be erroneous. Little research, however, has been pursued on the impact of the total level of debt3 on an economy. Nevertheless, public debt and private credit are interlinked. One example is provided by the recent bailouts of the financial sector in Spain. As shown in Figure 1 below, simply focusing on the level of public debt-to-GDP would erroneously give the impression that Spain did not have a problem of excessive debt in the run-up to the global financial crisis, as it strictly adhered to the Maastricht criterion of public debt levels of below 60%. Simultaneously however, a large construction bubble was building up, as private debt levels soared from around 125% of GDP at the start of the decade to more than 220% when the crisis struck in 2007-2008. Hence, if in case of failure of the private sector the public sector steps in, it can be argued that this amounts to an implicit government guarantee, making private debt indistinguishable from public debt (Bhandari, Haque and Turnovsky, 1990). The recent financial crisis has indeed shown, both in the United States and in Europe, the willingness of the sovereign to stand behind its banking sector. Investors considered too-big-to-fail banks as creditworthy as the government of its host country. These financial institutions could borrow at near identical rates as the sovereign, which made their debt very similar to sovereign debt (see e.g. Schich and Lindh, 2012). Similarly, a narrow focus on the level of public debt would suggest that the US economy is in dire straits as its public debt-to-GDP levels skyrocketed from 53% in. 1. This line of thinking is heavily influenced by the Ricardian equivalence theorem which states that consumers take the budgetary constraints of the government into account when making consumption decisions (Barro, 1996). Consequently, higher budget deficits now result in higher taxation in the future. Forward looking consumers anticipate this and hence increase their savings to pay for these higher taxes. 2. In the remainder of this paper, private debt and credit will be used interchangeably.. 3. In this article, we define the total level of debt in an economy as the sum of gross general government debt and private credit to households and non-financial companies. We exclude interbank lending in our analysis.. 80.
(3) European Journal of Government and Economics 4(2). 2000 to close to 103% in 2012. On the other hand, American households and companies managed to deleverage after the crisis – albeit by a relatively small amount – which is likely to be beneficial for the long run sustainability of its economy.. 250. US 170. 100. Spain. 150 160 Private debt as % of GDP. 80. 140. 70. 130. 50. 100. 40. 60. Public debt as % of GDP. 150 200 Private debt as % of GDP. 70 60 50. Public debt as % of GDP. 90. 80. 90. Figure 1 - Evolution of public and private debt: examples. 2000 2002 2004 2006 2008 2010 2012 Year. 2000 2002 2004 2006 2008 2010 2012 Year. Public debt Spain. Public debt US. Private debt Spain. Private debt US. At a more fundamental level, Schmidt (1943) asserted that public and private debt are essentially equivalent. An argument which was further elaborated by Buchanan (1958). The latter challenged the dominant theory on the distinction between public and private debt which hinges on the claim that private debt repayment represents a reduction in private net worth of the individual, but that public debt repayment does not constitute a reduction in the cumulative wealth of the community. However, when the taxpayer is taxed for servicing the public debt, this reduces his net worth, which is quite similar to private debt – and interest – repayments. This reduction in net worth must be offset, not against the increase in net worth enjoyed by the bondholder, but against the productivity of the public investments which are financed by the debt. Indeed, the increase in net worth of the bondholder will take place, regardless of the productivity of the public project. It follows that the taxpayer (i.e. the public borrower) is at no time in a different position from the private borrower. If the latter invests foolishly, his real income is reduced when interest payments are due. Similarly, if the state uses borrowed funds in an ill-advised way, this reduces the aggregate wealth of the community (Bhatt, 1959). Backhaus and Wagner (2006) make a similar claim, stating that “public debt is just a particular form of private debt, where the borrower is especially powerful”. Whereas a private citizen, responding to an unexpected drop in income, might borrow to smooth out this decline in spending power, so might the sovereign increase its borrowing when confronted with falling revenues, for example due to a recession. Both for the sovereign and the private citizen, debt does not alter its net worth; it simply affects the timing of expenditure. Public and private debt are not only interlinked and should therefore be examined simultaneously, they are also often interchangeable and should in many cases thus be aggregated to fully appreciate the extent to which debt has an impact on the economy. Tuition fees for higher education exemplify this reasoning. A college. 81.
(4) Vanlaer, Marneffe, Vereeck, Van Overtveldt ● Does debt predict growth?. education entails certain costs (e.g. paying salaries to teachers, building the necessary infrastructure). Whether these costs are borne by the state, by providing free higher education, or by the students by paying full cost fees, does not change this fact4. So, it may follow that either the government has to take on debt in order to finance higher education, or that the individual has to take on a student loan to pay for school. A similar argument can be made for the provision of health care, which can be arranged by the state, e.g. in the form of single-payer healthcare, or via private insurers. Likewise, governments can choose to outsource the exploitation of public infrastructure, such as toll roads, to private partners in exchange for co-financing of the initial investment. In essence, these are basically transfers on the same side of a consolidated balance sheet of the society. Arguments on who – the public or the private sector - should pay may depend on cost efficiency5 or ideology6. However, they do not alter the overall need for financing these projects and services. Public debt and private credit are therefore communicating vessels and should not be analysed separately. Focusing on only one is likely to yield a distorted view of the level indebtedness in and its impact on an economy. Therefore, this paper studies the link between the total level of debt-to-GDP, and changes in that level, and economic growth. We analyse whether we can predict the future level of growth, simply by looking at the total level of debt, or increases in that debt level.. 2. Review of literature The debate on the relationship between public debt and economic growth was revived by Reinhart and Rogoff (2010), which was part of a much larger empirical analysis they performed in their book This time is different: eight centuries of financial folly (2009). Their methods are temptingly straightforward. Reinhart and Rogoff group country-years in four categories by public debt-to-GDP ratios: 0-30 percent, 30-60 percent, 60-90 percent, and more than 90 percent. Next, they compare real GDP growth rates across these different groups. They find that this relationship is rather weak for public debt-to-GDP ratios below a threshold of 90%. For debt levels above 90%, however, median growth rates go down by around one percent and average growth falls even more. This has subsequently been referred to as the nonlinear relationship between public debt and economic growth (Minea and Parent, 2012). Afterwards, in a critical attempt to replicate the results of Reinhart and Rogoff’s 2009 paper, Herndon, Ash and Pollin (2014) uncovered “data omissions, questionable methods of weighting and elementary coding errors”. They assert that, when these errors are corrected, average growth at public debt levels above the 90% threshold does not vary dramatically from average growth at lower debt levels. In a study by Woo and Kumar (2015), the impact of the initial debt-to-GDP level on subsequent GDP growth was explored. They authors find that a 10 percentage point increase in the initial public debt level reduces GDP per capita by around 0.2 percentage points a year.. 4. Of course, one can argue that a private institution is better managed than a college that is run by the state and that thus the total cost for society is lower in the former case, but that discussion is beyond the scope of this paper.. 5. In some instances, it may be more efficient if the state pays for a particular service (e.g. health care), while in – many - other case the private market produces more efficient outcomes (e.g. telecoms services).. 6. Some people simple prefer a smaller or a larger state than others.. 82.
(5) European Journal of Government and Economics 4(2). Baum, Checherita-Westphal, and Rother (2013) analysed the impact of public debt on GDP in the EMU by using a dynamic threshold panel methodology. They identify an inverse u-shaped relationship between public debt and growth as their findings suggest that the short-run impact of debt is positive, decreases to zero at a public debt/GDP ratio of around 67% and is significantly negative at debt ratios above 90%. Critics of the original Reinhart and Rogoff (2009) paper reply that, while there may very well be a negative relationship between public debt and economic growth, the effect works in the opposite direction to what the supporters of austerity claim. It is low growth that causes the state revenues to fall and public expenditures to rise, thus resulting in a higher level of public debt. Lof and Malinen (2014) tried to tackle the issue of reverse causality by using panel vector autoregressions that represent the dynamic relationship between GDP and public debt, decomposing cause and effect. They indeed conclude that the negative correlation between both variables is mainly driven by the impact of economic growth on sovereign debt, not the other way around. A recent paper by three economists at the IMF research department (Pescatori, Sandri and Simon, 2014) refuted the existence of debt thresholds after which economic growth significantly deteriorates. They used a novel empirical approach to determine the relationship between debt thresholds and growth prospects. More specifically, they take a sample of all episodes where public debt increases above a particular threshold and calculate real GDP growth per capita over the following h years, varying h from 1, 5, 10 to 15. Although their method is quite similar to the one applied by Reinhart and Rogoff (2012), it differs in two crucial aspects. Firstly, the range of debt thresholds being analysed is much broader than the 90 percent threshold on which the Reinhart and Rogoff paper focuses. Secondly, economic growth over a particular time span is analysed, regardless of the debt outcome. In contrast, Reinhart and Rogoff only consider the period when debt persists above a certain threshold. Taylor (2012) illustrated the importance of private credit in developed economies. He argues that past growth in private debt contains predictive information about the likelihood of a crisis occurring in the future. Moreover, he finds that the recession after a credit boom is more severe than a “normal” recession. Jorda, Schularick and Taylor (2013) built on this work by analyzing the co-evolution of sovereign debt and credit in developed countries. They find that the risks to economic and financial stability mainly come from booms in private debt rather than increases in public debt. Nevertheless, when a country enters a crisis period with an already elevated level of public debt, this intensifies the crisis, presumably by the limited ability to introduce fiscal stimulus to uphold aggregate demand. A paper by Randveer, Uusküla and Kulu (2011) researched the link between economic recovery after a crisis and growth of credit before a crisis. They find, quite counterintuitively, that rapid credit expansion before a crisis is related with higher economic growth after the crisis. This contrasts with the widespread belief that, after a crisis and especially after a balance sheet recession like the one we have recently experienced, household debt overhang and the subsequent process of deleveraging acts as a serious drag on economic recovery. That is also precisely what Gärtner (2013) found in her study of the Great Depression. Debt overhang of households was indeed an important factor in holding back the economic recovery after the very severe drop in output that followed the stock market crash of October, 1929. In their widely praised book House of Debt (2014), Atif Mian and Amir Sufi provided compelling evidence for the case that the buildup of household debt was the main culprit for the recent recession. Additionally, when they analyse previous economic. 83.
(6) Vanlaer, Marneffe, Vereeck, Van Overtveldt ● Does debt predict growth?. downturns, the increase in consumer debt often plays a very important role. They conclude that the bigger the increase in debt, the harder the fall in spending. Cecchetti, Mohanty and Zampolli (2011) analysed government debt, corporate debt and household debt and find that each of these three types of debt becomes a drag on growth when it reaches a level above 85-90% of GDP. They conclude that debt improves welfare but can be damaging to the economy when levels are very high. As mentioned, the initial response to the global financial crisis was to focus on excessive government debt. Afterwards, the focus shifted to private credit. Our study aims to further the literature by looking at the overall debt level in an economy. This paper provides empirical evidence on the relationship between total debt and economic growth. We explore whether there is a specific debt threshold after which growth plummets. Section 3 describes the data and methodology used in our analysis. In section 4, we provide empirical evidence on the link between total debt levels and growth for our panel of 26 OECD countries from 1961-2012 in. Section 5, analyses changes in total debt-to-GDP and real GDP growth. In the subsequent section, we discuss our main findings. Finally, section 7 presents the conclusions.. 3. Data and methodology We have gathered data on public debt levels from a comprehensive database on gross government debt, which is compiled by the IMF Fiscal Affairs Department7. Data on private debt comes from a recent BIS database8 on credit to the private non-financial sector. We acquire GDP data from the AMECO database of the European Commission. Our dataset comprises annual data on 26 developed economies, over the period 1961-2012. Table A in the Appendix provides the summary statistics for public, private and total debt-to-GDP levels, yearly increases in total debt-to-GDP levels and real GDP per capita growth rates. In our sample, the average total debt-to-GDP level is 168%, the average yearly increase in debt is 3.65% and average real growth equals 2.48%. However, these averages disguise large discrepancies between countries. Whereas countries like Turkey and Mexico have average total debt-to-GDP levels of around 70%, countries such as Japan and Luxembourg9 have an average debt level which is several times larger (363% and 257% respectively). We need to discuss several methodological issues when examining the relationship between debt and growth. Firstly, it seems highly implausible that there is one common debt threshold after which growth plummets. If there exists a “dangerous” debt threshold, this will most likely vary across countries and across time, and will be dependent on numerous other factors (e.g. potential growth rate10, willingness to save of the private sector). Another issue pertains to the causality between debt and growth. Rather than being the cause, high debt may be the result of anaemic growth. If it is sluggish growth that causes high debt, it is less probable that a specific threshold is. 7. See Horton et al. (2010) for a complete description of the database, which can be found online on www.imf.org/external/datamapper/index.php?db=DEBT.. 8. See Dembiermont, Drehmann and Muksakunratana (2013) for a detailed description of the database: http://www.bis.org/statistics/credtopriv.htm. 9. Luxembourg is a particular case due to its heavy reliance on financial services, resulting in a very high level of private debt. 10. As Summers (2014) has argued repeatedly in his discussion of secular stagnation, in a world with economic output chronically below potential, debt-financed public projects might be needed to generate growth levels which are consistent with full employment and stable inflation.. 84.
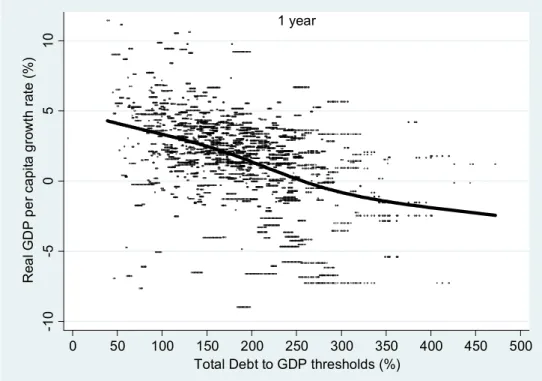
(7) European Journal of Government and Economics 4(2). discerned. Hence, if such a threshold is found, the likelihood that it is driven by a causal effect of debt on growth is relatively high. Moreover, elevated debt levels might conceal an omitted variable, a common factor both increasing debt and reducing growth (e.g. a financial crisis or a war). This applies particularly when analyzing the short-term relationship between debt and growth, since a recession almost mechanically results in a higher debt ratio due to the denominator shrinking. One way to address the issue of causality is by adopting instrumental techniques. For example, Panizza and Presbitero (2014) use an instrument variable that takes into account valuation effects resulting from the interplay between exchange rate volatility and foreign currency debt. They find no evidence that debt has a causal effect on growth. Next to the short-term relationship between debt and growth, which is the focus in most of the literature, we consider the long-term link. More concretely, we analyse the long-term relationship between today’s level of total debt to GDP, bt, and subsequent GDP growth in the next h-years, git (h) = yt+h/yt. This longer-term horizon allows for tempering the effects of reverse causality that a brief recession or boom might have on short-term economic growth. We apply the framework provided by Pescatori, Sandri and Simon (2014). Our analysis starts by taking a sample of all country episodes11 where total debt rose above a threshold τ. Next, we look at real GDP per capita growth over the next h years, where h ϵ [1,5,10,15]. Countries can have multiple episodes, but not overlapping ones. We consider the start of a rising debt episode to be the first year in which the total debt level exceeds the threshold τ, conditional on the level being below the threshold in the previous year. To put it more formally, for a country i and a threshold τ, the start of an episode has to meet the following conditions:. bit ≥ τ, bit-1 < τ and ∄ j ϵ [1,…,h] s.t. bit-j ≥ τ, bit-j-1 < τ. There are several features of this model which are important to note. Firstly, by analyzing economic performance over a given period regardless of the debt outcome, we avoid the truncation problem which arises when we only look at the period when debt remains above a certain level, in effect solely selecting ‘failures’. In our analysis, we admit countries that succeed in reducing total debt levels after surpassing a particular debt threshold along with the ‘failures’, i.e. countries whose debt level remains elevated. Secondly, we allow each country to only have a limited number of episodes, due to the fact that we rule out overlapping episodes and by requiring that an episode starts when total debt exceeds the threshold from below. When calculating averages, the episodes are pooled together and weighted equally12. Finally, in contrast to the growth regressions adopted in most other papers, our methodology does not impose a linear relationship between debt and economic growth.. 4. Total debt levels and economic growth 4.1. Short-term (1 year) Our analysis starts with the short-term relationship between the total debt level and economic growth. In Figure 2, we present the average real GDP per capita growth rate in the year after the total debt level exceeds a certain threshold, i.e. h=1. More. 11. A country episode is a combination of h consecutive country years (cf. supra).. 12. The methodology adopted by Reinhart and Rogoff (2010) resulted in several countries having a lot more observations than other countries. Alternative weighting methods can subsequently bring about significantly different conclusions.. 85.
(8) Vanlaer, Marneffe, Vereeck, Van Overtveldt ● Does debt predict growth?. precisely, we show a scatterplot of all the observations, plotting economic growth against total debt-to-GDP. We also include a locally fitted regression function13. We can observe that there are countries with higher debt which experience sound growth rates. Reversely, there are countries with lower debt levels and that display limited or even negative economic growth14. In general, however, a higher level of debt leads to lower economic growth, but this relationship becomes less pronounced at very high total debt levels. In addition, a Spearman's correlation was calculated to determine the relationship between debt and growth. It showed there was moderate, negative monotonic correlation between the two variables (ρ = 0.42). Figure 2 - Total debt and short-term economic growth. -10. Real GDP per capita growth rate (%) -5 0 5 10. 1 year. 0. 50. 100. 150 200 250 300 350 Total Debt to GDP thresholds (%). 400. 450. 500. 4.2. Medium- and longer-term (5, 10 and 15 years) However, it would be ill-advised to draw conclusions about the link between total debt and economic growth simply by analysing the year after a particular debt threshold is exceeded. The reason for this is straightforward; instead of increased debt leading to lower growth, the relation could run the other way, i.e. lower growth resulting in higher debt levels. This argument has been extensively discussed by critics of the original Reinhart and Rogoff paper (2009) (see e.g. Herndon, Ash and Pollin, 2013 and Pescatori, Sandri and Simon, 2014). When growth significantly slows down, and the economy enters into a recession, government revenues decline, e.g. due to a fall in personal taxes and income taxes. Similarly, governement expenditures increase, as more people rely for instance on unemployment insurance. Absent severe cuts in spending on other policy areas –. 13. The locally smoothed regression function is estimated with the general additive model with integrated smoothness estimation using the gamfit package in Stata. 14. Our methodology can produce multiple observations for one country-year. For example, if a country’s total debt level jumps from 100% to 115% in one year, multiple thresholds (e.g. 102%, 104%, 106%, etc.) will be exceeded.. 86.
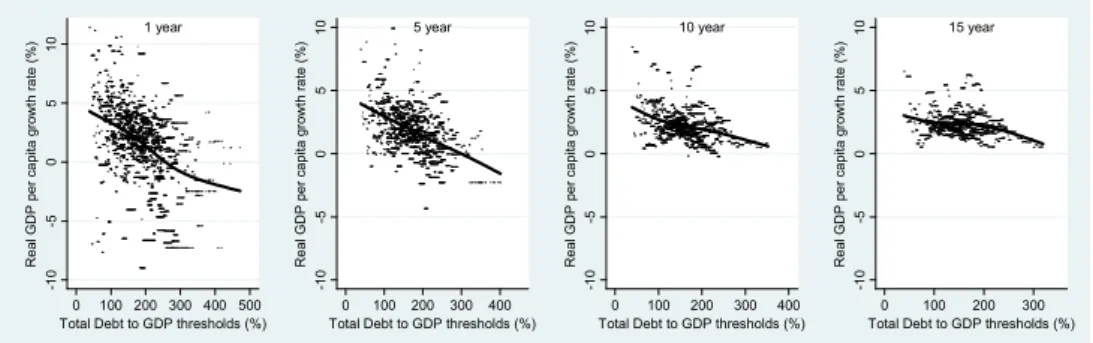
(9) European Journal of Government and Economics 4(2). which would deepen the recession – this results in a larger budget deficit and consequently a higher level of government debt. Correspondingly, job losses caused by the recession render households less able to service their debt, which in the short run makes it very hard to deleverage. Some households will even have to take on additional loans in order to make ends meet. In summary, when economic growth slows down, or even becomes negative, the debt-to-GDP ratio almost mechanically increases; debt (i.e. the numerator) soars due to lower revenues and higher expenditures as GDP (i.e. the denominator) shrinks. We try to eliminate the bias which potentially arises from reverse causality as well as mitigate the effects of outliers by extending the horizon of our analysis. If high levels of total debt in an economy significantly hold back growth over the medium to long term, we would foresee that growth is not only supressed in the first year that debt surpasses the threshold, but also in the ensuing years. Figure 3 shows economic growth over 5, 10 and 15 years respectively after a certain debt threshold has been reached15. To complete the picture, we have added the results from our previous analysis, i.e. short-term growth. When looking at economic growth over a 5-year horizon, the result of our previous analysis is confirmed; more debt results in lower growth. Although growth performance improves noticably in the longer run, higher debt levels are still related to a lower growth rate. This is confirmed by Spearman’s rank correlation coefficient, which declines from -0.45 for 5-year growth to -0.20 for growth over a 15-year horizon, which is a rather weak correlation. Additionally, we compared the regression coefficients among these four groups to test the null hypothesis:. H0: B1 = B2 = B3 = B4 where B1 is the regression for 1-year growth, B2 for 5-year growth, B3 for 10-year growth, and B4 for 15-year growth. Our analysis reveals that the null hypothesis can be rejected (F=105.07, p = 0.0000). This means that the regression coefficients between debt and growth do significantly differ across the 4 groups (1 year, 5 year, 10 year, 15 year). We also tested the regression coefficients between two groups pairwise (e.g. comparing 10-year growth with 15-year growth). All regression coefficients significantly differ from each other (p = 0.0000).. 0 100 200 300 400 500 Total Debt to GDP thresholds (%). 0 100 200 300 400 Total Debt to GDP thresholds (%). Real GDP per capita growth rate (%) -5 0 5 10. 15 year. -10. 10 year. -10. Real GDP per capita growth rate (%) -5 0 5 10. 5 year. -10. -10. Real GDP per capita growth rate (%) -5 0 5 10. 1 year. Real GDP per capita growth rate (%) -5 0 5 10. Figure 3 - Total debt and medium- to long-term economic growth. 0 100 200 300 400 Total Debt to GDP thresholds (%). 0 100 200 300 Total Debt to GDP thresholds (%). As a robustness test, we have rerun our analysis on a homogenous set of data. Whereas we varied our exclusion window in Figure 3 in correspondence with the period over which we calculate the average growth rate (e.g. the exclusion window for h=1is 2012 and for h=15 is 1998), in Figure 4 the exclusion window is the same for each curve, i.e. 1998. In other words, each of the four graphs looks at the exact same debt episodes; only the period over which economic growth is averaged,. 15. The exclusion window for the different horizons depends on the level of h, i.e. for h=1/5/10/15 we look at episodes until 2012/2007/2002/1997.. 87.
(10) Vanlaer, Marneffe, Vereeck, Van Overtveldt ● Does debt predict growth?. varies. The results are strikingly similar, with Spearman’s rank correlation varying from -0.40 to -0.20.. 0 100 200 300 Total Debt to GDP thresholds (%). 0 100 200 300 Total Debt to GDP thresholds (%). Real GDP per capita growth rate (%) -5 0 5 10. 15 year. -10. 10 year. -10. Real GDP per capita growth rate (%) -5 0 5 10. 5 year. -10. -10. Real GDP per capita growth rate (%) -5 0 5 10. 1 year. Real GDP per capita growth rate (%) -5 0 5 10. Figure 4 - Total debt and medium- to long-term economic growth (homogenous dataset). 0 100 200 300 Total Debt to GDP thresholds (%). 0 100 200 300 Total Debt to GDP thresholds (%). Of course, our study could be influenced by outliers. For example, several episodes of very low growth might skew our results. Therefore, in Figure 5 we repeat our analysis, but eliminate the observations with 2.5% lowest and 2.5% highest growth levels16. Our previous results remain unaltered. In the short term, there is a relatively strong negative correlation between debt and growth, but this correlation attenuates when growth over a longer period is taken into consideration.. 0 100 200 300 400 500 Total Debt to GDP thresholds (%). 0 100 200 300 400 Total Debt to GDP thresholds (%). Real GDP per capita growth rate (%) -5 0 5 10. 15 year. -10. Real GDP per capita growth rate (%) -5 0 5 10. 10 year. -10. Real GDP per capita growth rate (%) -5 0 5 10. 5 year. -10. 1 year. -10. Real GDP per capita growth rate (%) -5 0 5 10. Figure 5 - Total debt and medium- to long-term economic growth (outliers removed). 0 100 200 300 400 Total Debt to GDP thresholds (%). 0 100 200 300 Total Debt to GDP thresholds (%). Comparing the impact of public debt and private debt levels is beyond the scope of this paper. Nevertheless, it is interesting to note that the general relationship between total debt and growth – relatively strong negative correlation in the short term, much less so on the long term – also holds for public and private debt, as can be seen in Figure 6. However, the strength of the negative relationship with growth is more pronounced for private debt than for public debt.. 16. We get similar results if we eliminate only the 1.25% highest and lowest values or if we eliminate the 5% highest and lowest values.. 88.
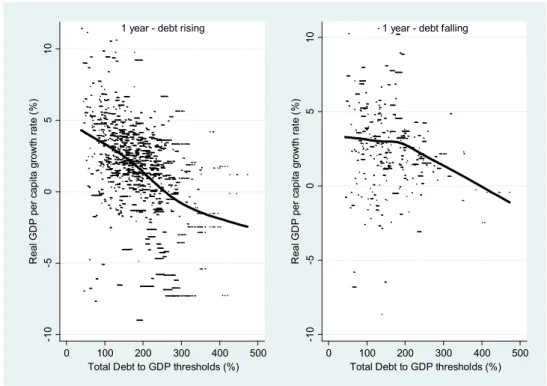
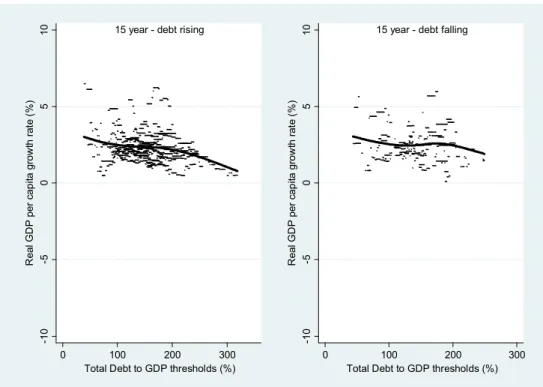
(11) European Journal of Government and Economics 4(2). 10 year. 15 year. -10. Real GDP per capita growth rate (%) -5 0 5 10. Real GDP per capita growth rate (%) -5 0 5 10 -10. 5 year. -10. Real GDP per capita growth rate (%) -5 0 5 10 -10. 1 year. Real GDP per capita growth rate (%) -5 0 5 10. Figure 6 - Public debt & private debt levels and medium- to long-term economic growth. 10 year. 15 year. 0 100 200 300 400 Private Debt to GDP thresholds (%). 0 100 200 Private Debt to GDP thresholds (%). -10. -10. 0 100 200 300 400 Private Debt to GDP thresholds (%). Real GDP per capita growth rate (%) -5 0 5 10. 5 year. Real GDP per capita growth rate (%) -5 0 5 10. 1 year. Real GDP per capita growth rate (%) -5 0 5 10. 0 50 100 150 Public Debt to GDP thresholds (%). -10. 0 50 100 150 Public Debt to GDP thresholds (%). Real GDP per capita growth rate (%) -5 0 5 10. 0 50 100 150 200 Public Debt to GDP thresholds (%). -10. 0 50 100 150 200 250 Public Debt to GDP thresholds (%). 0 100 200 Private Debt to GDP thresholds (%). 4.3. Debt trajectory Hitherto, our analysis has focused solely on episodes where the total debt level has exceeded a threshold. Now, we look at the impact of decreasing total debt levels on economic growth. Therefore, we study all episodes where the total debt level declines below a given threshold:. bit ≤ τ, bit-1 ˃ τ and ∄ j ϵ [1,…,h] s.t. bit-j ≤ τ, bit-j-1 ˃ τ. In Figure 7, we compare short-term economic growth (h=1) in these episodes with the ones identified in Figure 2. We can observe that the trajectory of growth performance is quite similar between countries that exceed or fall below a debt threshold. Yet countries on a declining debt path have slightly higher growth rates at high debt levels compared to those on an increasing path. In other words, high levels of debt are negatively associated with growth, but if these high debt levels are falling, growth performance improves slightly. In addition, when debt is falling, there appears to be no impact on growth until debt levels reach 200% of GDP, after which real GDP growth steadily deteriorates.. 89.
(12) Vanlaer, Marneffe, Vereeck, Van Overtveldt ● Does debt predict growth?. Figure 7 - Debt trajectory and short-term economic growth 1 year - debt falling. -10. -10. Real GDP per capita growth rate (%) -5 0 5. Real GDP per capita growth rate (%) -5 0 5. 10. 10. 1 year - debt rising. 0. 100 200 300 400 Total Debt to GDP thresholds (%). 500. 0. 100 200 300 400 Total Debt to GDP thresholds (%). 500. Figure 8 presents the results for h=15.17 We now find that the evolution of economic growth is very similar for countries with increasing and decreasing debt levels. Higher levels of debt are still correlated with somewhat lower growth, but there is no impact on economic performance stemming from the increase or decrease of debt levels.. 17. We get similar results for h=5 and h=10.. 90.
(13) European Journal of Government and Economics 4(2). Figure 8 - Debt trajectory and long-term economic growth. Real GDP per capita growth rate (%) -5 0 5. 10. 15 year - debt falling. -10. -10. Real GDP per capita growth rate (%) -5 0 5. 10. 15 year - debt rising. 0. 100 200 300 Total Debt to GDP thresholds (%). 0. 100 200 Total Debt to GDP thresholds (%). 300. 5. Changes in total debt levels and economic growth 5.1 General In our previous analysis, we have found that in the short term, high total debt levels in an economy are correlated to lower economic growth, but the effect becomes less pronounced in the the medium and long run. Moreover, we have concluded that the debt trajectory has little to no impact on growth. In this section, we evaluate whether changes in debt levels have a significant impact on GDP per capita growth. Heretofore, we have looked at the stock of debt; we will now scrutinize debt flows.. 5.2 Short-term (1 year) In Figure 9, we plot the average growth rate of countries the year after they reached a particular change in total debt level θ, that is18:. bit – bit-1 = θ. The graph does show that a rapid accumulation of debt is correlated with lower economic growth, but the relationship is rather weak. This is also confirmed by Spearman’s rank correlation coefficient, which is only -0.08.. 18. The reason why we use “=” in this part of our analysis instead of “≥” is twofold. Firstly, we have positive as well as negative values for θ, which renders the notion of “exceeding a certain threshold” less straightforward to interpret. Secondly, if we would use “≥”, then exceeding a threshold of e.g. 1% would imply that we use all observations not just where there is a debt increase of 1%, but also where debt increases by 2%, 3%, 4%, etc. This way, certain thresholds would have hundreds of observations, which would make our analysis rather meaningless.. 91.
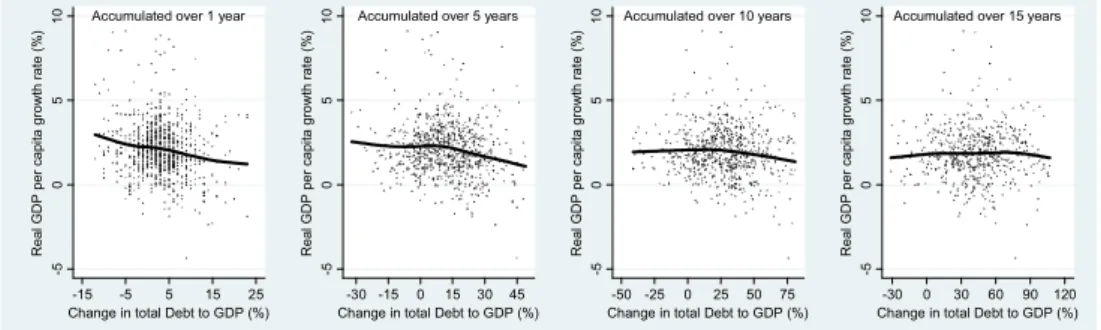
(14) Vanlaer, Marneffe, Vereeck, Van Overtveldt ● Does debt predict growth?. Figure 9 - Change in total debt and short-term economic growth. -10. Real GDP per capita growth rate (%) -5 0 5 10. Accumulated over 1 year. -20. -10. 0 10 Change in total Debt to GDP (%). 20. 30. We now extend our analysis in two ways. Firstly, we look at changes in total debtto-GDP levels over multiple years d, with d ϵ [1,5,10,15]. Secondly, we study the growth performance of countries over the medium to long term h, with h ϵ [1,5,10,15]:. bit – bit-d = θ and ∄ j ϵ [1,…,h] s.t. bit-j – bit-d-j = θ. Figure 10 shows short-term economic growth (h=1) and debt accumulated over 1, 5, 10 and 15 years (i.e. d=1,5,10,15).. -20 -10 0 10 20 30 Change in total Debt to GDP (%). -25 0 25 50 75 Change in total Debt to GDP (%). Real GDP per capita growth rate (%) -5 0 5 10. Accumulated over 15 years. -10. Accumulated over 10 years. -10. Real GDP per capita growth rate (%) -5 0 5 10. Accumulated over 5 years. -10. -10. Real GDP per capita growth rate (%) -5 0 5 10. Accumulated over 1 year. Real GDP per capita growth rate (%) -5 0 5 10. Figure 10 - Growth performance over 1 year with debt accumulation over 1-15 year (h=1 and d=1,5,10,15). -50 -25 0 25 50 75 100 Change in total Debt to GDP (%). -50 0 50 100 150 Change in total Debt to GDP (%). Firstly, the graphs show that a rapid accumulation of debt is associated with lower growth. All four curves have a negative slope. It can be observed that this correlation is not particularly strong, as shown by Spearman’s rank correlation coefficient, which never exceeds -0.17. Secondly, the period of time over which debt has been built up matters. Logically, an increase in the total debt-to-GDP level of 20% over 1 year is more negatively correlated to growth than a 15 year building up period. Thirdly, whereas deleveraging (i.e. negative values of changes in total debt-to-GDP levels) does not appear to impact growth, economic performance starts to deteriorate as debt accumulates (i.e. positive values of changes in total debt-to-GDP levels). This holds for all four curves. The threshold for which growth. 92.
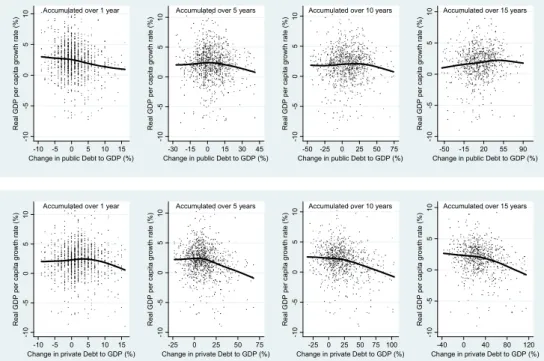
(15) European Journal of Government and Economics 4(2). starts to slow down, increases as the period over which debt is accumulated is extended. For example, economic performance remains quite constant for d=5 until a 25% increase in debt. For d=15, an increase in debt of 50% must be reached before we see a negative impact on growth. Finally, all regression coefficients were compared and found to be significantly different across the four groups (p = 0.0000). Again, our analysis does not change if we exclude the 2.5 lowest and 2.5% highest values of growth, as shown in Appendix C. When comparing the difference between public and private debt, it is noteworthy that private debt again has the strongest negative correlation with economic growth, as can be seen in Figure 11.. Real GDP per capita growth rate (%) -5 0 5 10. Accumulated over 15 years. -10. Real GDP per capita growth rate (%) -5 0 5 10. Accumulated over 10 years. -10. Real GDP per capita growth rate (%) -5 0 5 10. Accumulated over 5 years. -10. Accumulated over 1 year. -10. Real GDP per capita growth rate (%) -5 0 5 10. Figure 11 - Growth performance over 1 year with debt accumulation over 1-15 year (h=1 and d=1,5,10,15) – Public & private debt. Accumulated over 10 years. Accumulated over 15 years. -10 -5 0 5 10 15 Change in private Debt to GDP (%). -25 0 25 50 75 100 Change in private Debt to GDP (%). -10. -10. -25 0 25 50 75 Change in private Debt to GDP (%). Real GDP per capita growth rate (%) -5 0 5 10. Accumulated over 5 years. Real GDP per capita growth rate (%) -5 0 5 10. Accumulated over 1 year. Real GDP per capita growth rate (%) -5 0 5 10. -50 -15 20 55 90 Change in public Debt to GDP (%). -10. -50 -25 0 25 50 75 Change in public Debt to GDP (%). Real GDP per capita growth rate (%) -5 0 5 10. -30 -15 0 15 30 45 Change in public Debt to GDP (%). -10. -10 -5 0 5 10 15 Change in public Debt to GDP (%). -40 0 40 80 120 Change in private Debt to GDP (%). 5.3. Medium-term (5 years) From the analysis so far, we cannot conclude that the causal direction runs from the accumulation of debt to sluggish growth. As argued, a period of low growth may result into a rapid build-up of debt. In addition, an increase in debt in the order of magnitude of over 10% in one year is very likely to be accompanied by a severe crisis, which in itself slows down growth. Therefore, we will analyse the link between debt accumulation and medium- to long-term growth. In Figure 12, we provide the results for economic growth over 5 years (h=5) after reaching a threshold change in total debt levels, that has been accumulated over 1, 5, 10 and 15 years (i.e. d=1,5,10,15) respectively.. 93.
(16) Vanlaer, Marneffe, Vereeck, Van Overtveldt ● Does debt predict growth?. -15 -5 5 15 25 Change in total Debt to GDP (%). -30 -15 0 15 30 45 Change in total Debt to GDP (%). Real GDP per capita growth rate (%) 0 5 10. Accumulated over 15 years. -5. Real GDP per capita growth rate (%) 0 5 10. Accumulated over 10 years. -5. Real GDP per capita growth rate (%) 0 5 10. Accumulated over 5 years. -5. Accumulated over 1 year. -5. Real GDP per capita growth rate (%) 0 5 10. Figure 12 - Growth performance over 5 year with debt accumulation over 1-15 year (h=5 and d=1,5,10,15). -50 -25 0 25 50 75 Change in total Debt to GDP (%). -30 0 30 60 90 120 Change in total Debt to GDP (%). Again, we find that the period over which debt is accumulated is relevant. The shorter this period, the more negative the economic growth. However, this relationship is much less strong in the medium term than in the short term. When debt has been built up over 10 or 15 years, the relationship becomes practically non-existent19.This is supported by Spearman’s rank correlation, which is a mere 0.06 for d=10 and 0.03 for d=15 and fails to be statistically significant (p=0.09 and 0.49 respectively). Hence, there appears to be no negative impact of a large increase in debt compared to a smaller increase in debt, when debt is built up over an extended period. These outcomes do not change when we exclude outliers, as shown in Appendix D. There is a clear difference between public and private debt. Accumulation of public debt is not negatively correlated with medium-term growth; Spearman’s rank correlation is positive and ranging between 0.10 and 0.20. In contrast, a negative relationship between private debt accumulation and medium-term growth is observed and verified by Spearman’s rank correlation, which ranges between -0.16 and -0.22.. -10 -5 0 5 10 15 Change in public Debt to GDP (%). 19. -30 -15 0 15 30 45 Change in public Debt to GDP (%). -50 -25 0 25 50 75 Change in public Debt to GDP (%). Real GDP per capita growth rate (%) 0 5 10. Accumulated over 15 years. -5. Real GDP per capita growth rate (%) 0 5 10. Accumulated over 10 years. -5. Real GDP per capita growth rate (%) 0 5 10. Accumulated over 5 years. -5. Accumulated over 1 year. -5. Real GDP per capita growth rate (%) 0 5 10. Figure 13 - Growth performance over 5 years with debt accumulation over 1-15 year (h=1 and d=1,5,10,15) – Public & private debt. -50 -25 0 25 50 75 Change in public Debt to GDP (%). The null hypothesis that both coefficients are the same also could not be rejected (p=0.09).. 94.
(17) -10 -5 0 5 10 15 Change in private Debt to GDP (%). -30 -15 0 15 30 45 Change in private Debt to GDP (%). Real GDP per capita growth rate (%) 0 5 10. Accumulated over 15 years. -5. Real GDP per capita growth rate (%) 0 5 10. Accumulated over 10 years. -5. Real GDP per capita growth rate (%) 0 5 10. Accumulated over 5 years. -5. Accumulated over 1 year. -5. Real GDP per capita growth rate (%) 0 5 10. European Journal of Government and Economics 4(2). -50 -25 0 25 50 75 Change in private Debt to GDP (%). -30 0 30 60 90 Change in private Debt to GDP (%). 5.4. Long-term (15 years) Finally, Figure 14 presents the results of our analysis on growth performance over a 15 year horizon (h=15) 20 and debt accumulating over 1, 5, 10 and 15 years (d=1,5,10,15). We find that countries experiencing a significant increase in their total debt level do not record worse economic performances over the longer term than countries with a constant or declining total debt level. If anything, there is a slightly positive relationship between debt accumulation and longer term growth; Spearman’s rank correlation is positive for all four curves and ranges between 0.01 and 0.13. Appendix H demonstrates that we get similar results once extreme values are removed. Moreover, we compared the regression coefficients among the four groups. They do not siffer significantly (F=1.36, p=0.2540), which means that the period over which debt is accumulated is not relevant. The regression coefficients between two groups were also compared pairwise (e.g. comparing debt accumulation over 1 year with debt accumulation over 10 years). The null hypothesis could not be rejected for any comparison.. -15 -5 5 15 25 Change in total Debt to GDP (%). -50 -25 0 25 50 Change in total Debt to GDP (%). Real GDP per capita growth rate (%) 0 5 10. Accumulated over 15 years. -5. Real GDP per capita growth rate (%) 0 5 10. Accumulated over 10 years. -5. Real GDP per capita growth rate (%) 0 5 10. Accumulated over 5 years. -5. Accumulated over 1 year. -5. Real GDP per capita growth rate (%) 0 5 10. Figure 14 - Growth performance over 15 year with debt accumulation over 1-15 year (h=15 and d=1,15). -25 0 25 50 75 Change in total Debt to GDP (%). -30 0 30 60 90 Change in total Debt to GDP (%). Figure 15 shows that there is hardly any difference in the correlation between debt and long-term growth between public debt and private debt, with the only exception being public debt accumulated over 1 year.. 20. The analysis for economic growth over a 10 year period yields similar results, as can be seen from Appendices E-G.. 95.
(18) Vanlaer, Marneffe, Vereeck, Van Overtveldt ● Does debt predict growth?. Real GDP per capita growth rate (%) 0 5 10. Accumulated over 15 years. -5. Real GDP per capita growth rate (%) 0 5 10. Accumulated over 10 years. -5. Real GDP per capita growth rate (%) 0 5 10. Accumulated over 5 years. -5. Accumulated over 1 year. -5. Real GDP per capita growth rate (%) 0 5 10. Figure 15 - Growth performance over 15 years with debt accumulation over 1-15 year (h=15 and d=1,5,10,15) – Public & private debt. Accumulated over 1 year. Accumulated over 5 years. Accumulated over 10 years. Accumulated over 15 years. -30 -15 0 15 30 45 Change in private Debt to GDP (%). -25 0 25 50 75 Change in private Debt to GDP (%). -5. -5. -5. -5 -10 -5 0 5 10 15 Change in private Debt to GDP (%). Real GDP per capita growth rate (%) 0 5 10. -30 0 30 60 90 Change in public Debt to GDP (%). Real GDP per capita growth rate (%) 0 5 10. -25 0 25 50 75 Change in public Debt to GDP (%). Real GDP per capita growth rate (%) 0 5 10. -30 -15 0 15 30 45 Change in public Debt to GDP (%). Real GDP per capita growth rate (%) 0 5 10. -10 -5 0 5 10 15 Change in public Debt to GDP (%). -30 0 30 60 90 Change in private Debt to GDP (%). 6. Discussion of results Although the recent global financial crisis has produced a vast amount of research on the impact of public debt on economic growth and increasingly also on the role of private credit, the total levels of indebtedness of an economy have largely been ignored. Our paper for the first time attempts to fill that void by analysing the link between total debt-to-GDP levels and economic growth for a panel of 26 OECD countries between 1961 and 2012. We investigate whether we can predict the future level of growth, simply by looking at the total level of debt, or increases in that debt level. We found little evidence to support the hypothesis that there is a critical threshold of the total debt-to-GDP ratio above which economic growth plummets. Rather, growth performance worsens gradually as debt levels rise. In addition, this relationship is more pronounced for short-term growth than for medium- to longterm growth. It follows that the causal direction most likely runs from low growth to higher debt levels, not the other way around. Another explanation is that, on average, the return on the investments financed by this debt compensates their cost. For example, companies take on more debt to improve their machinery, which raises their debt level in the short run. However, in the longer run, this results in higher productivity and consequently higher profits, with the increase in profits offsetting the interest payments on the debt. A similar argument can be made for public investments that increase public debt-to-GDP in the short run, but improves the long-term economic potential of a country. One can also argue that it is not so much the level of debt, or increases in that level, which matters. Rather, the cost of servicing debt, i.e. bond yields on both corporate and government debt21, plays a far more important role. At lower interest. 21. We assume that low levels of corporate and government bond yields are also translated into lower levels of interest on consumer loans.. 96.
(19) European Journal of Government and Economics 4(2). rates, it will be easier to service debt. Simultaneously, certain investment projects become profitable due to the lower cost of financing it, which results in higher growth. Of course, there is a feedback loop between the level of debt and the level of interest paid on it, but, ceteris paribus, a lower yields on bonds improves investments prospects and hence economic growth. We have also looked at the impact of the pace of debt accumulation on subsequent economic growth. We find that rapid debt accumulation is negatively related to economic growth over the short term, but that this effect is less pronounced over the medium term and is non-existent over the long term. This could be explained by the fact that countries experiencing a fast rising debt level are typically hit by an exogenous shock, which causes the public and private sector to take on more debt in the short term, without significantly altering the long-term fundamentals of the country. In our analysis, we have applied a non-parametric method to demonstrate the correlation between debt and growth. The appeal of this method is that the results can be interpreted rather intuitively. However, further research is warranted to identify the complex structural relationship between total debt levels and GDP growth. Another area for future research is to decompose the aggregate level of debt in an economy in its composing parts and debt holders to find out what type of debt has significant impact on economic growth. For example, public debt can be disaggregated into internal and external debt, private debt into mortgage debt, credit card debt and others. This way, the impact of borrowing in a foreign currency, both for the public and private sector, can be studied.. 7. Conclusions In summary, this paper has two main contributions. The first is that the current emphasis on public debt is too narrow and that private debt should be included in analysing the level of indebtedness of an economy. As public and private debt in many cases are interchangeable, it is the effect of aggregated debt on growth that should be explored. Second, it shows that there is no critical total debt-to-GDP ratio after which medium-term economic performance significantly worsens. Hence, the excessive focus on a target value such of the debt-to-GDP ratio is misguided. There are other, more important factors which determine the impact of debt and growth, such as bond yields. An abstract level of debt does not have predictive power for the outlook of growth. Although we find some evidence that, in the short term, higher debt levels are associated with lower growth, the relationship weakens significantly when we expand the time horizon. This supports the hypothesis that it is lower growth which leads to more debt and not vice versa. Similarly, we find that the pace of debt accumulation negatively correlates to short-term economic growth and that this relationship weakens for medium-term growth. For long-term growth, the speed at which debt is building up does not substantially alter longer-term growth prospects. Of course, our results do not imply that a country or the private sector can pile on large amounts of debt without careful analysis of the projects financed by this debt accumulation. Our research simply suggests that historically, on average, government debt and private credit are mainly used in such a way that is conducive to economic growth.. 97.
(20) Vanlaer, Marneffe, Vereeck, Van Overtveldt ● Does debt predict growth?. References Backhaus, Jürgen and Richard E. Wagner (2006) Handbook of public finance. New York: Springer Science & Business Media. Barro, Robert J. (1996) 'Reflections on Ricardian Equivalence', National Bureau of Economic Research Working Papers No. w5502. Baum, Anja, Christina Checherita-Westphal and Philipp Rother (2013) 'Debt and growth: New evidence for the euro area', Journal of International Money and Finance 32: 809-821. Bhandari, Jagdeep S., Nadeem Ul Haque and Stephen J. Turnovsky (1990) 'Growth, external debt, and sovereign risk in a small open economy', Staff PapersInternational Monetary Fund Staff Papers: 388-417. Bhatt, Makesh (1959) 'Orthodoxy: Old vs New', The Economic Weekly 11(22): 717718. Buchanan, James M. (1958) Public Principles Of Public Debt A Defense and Restatement. Cecchetti, Stephen G., Madhusudan S. Mohanty and Fabrizio Zampolli (2011) 'The real effects of debt', Bank for International Settlements, Monetary and Economic Department Working Papers No. 352. Chatterjee, Satyaijit (2013) 'Debt overhang: why recovery from a financial crisis can be slow', Business Review Q2: 1-9. Dembiermont, Christian, Mathias Drehmann and Siriporn Muksakunratana (2013) 'How Much Does The Private Sector Really Borrow? A New Database For Total Credit to the Private Non-financial Sector', BIS Quarterly Review March. Gärtner, Kaharina (2013) 'Household Debt and Economic Recovery Evidence From The US Great Depression', European Historical Economics Society Working Papers No. 36. Herndon, Thomas, Michael Ash and Robert Pollin (2014) 'Does high public debt consistently stifle economic growth? A critique of Reinhart and Rogoff', Cambridge Journal of Economics 38(2): 257-279. Horton, Mark. A., Ali S.M. Abbas, Nazim Belhocine and Asmaa A. El-Ganainy (2010) 'A Historical Public Debt Database', IMF Working Paper No. 10/245. International Monetary Fund (2010) World Economic Outlook: Rebalancing Growth. Washington (April). Jordà, Oscar, Moritz HP Schularick and Alan M. & Taylor (2013) 'Sovereigns versus banks: credit, crises and consequences', National Bureau of Economic Research Working Papers No. w19506. Lof, Matthijs and Tuomas Malinen (2014) 'Does sovereign debt weaken economic growth? A Panel VAR analysis', Economics Letters 122(3): 403-407. Mian, Atif and Amir Sufi (2014) House of Debt - How They (and You) Caused the Great Recession, and how We Can Prevent it from Happening Again. Chicago: University of Chicago Press. Minea, Alexandru and Antoine Parent (2012) 'Is high public debt always harmful to economic growth? Reinhart and Rogoff and some complex nonlinearities', CERDI working papers, No. 2012-18. Panizza, Ugo and Andrea F. Presbitero (2014) 'Public Debt and Economic Growth: Is There a causal effect?', Journal of Macroeconomics 41: 21-41. Pescatori, Andrea, Damiano Sandri and John Simon (2014) 'Debt and Growth: Is There a Magic Threshold?', IMF Working Papers No. 14/34.. 98.
(21) European Journal of Government and Economics 4(2). Randveer, Martti, Liina Kulu and Lenno Uusküla (2011) 'The impact of private debt on economic growth', Eesti Pank Working Papers No. 10/2011. Reinhart, Carmen. M and Kenneth Rogoff (2009) This time is different: eight centuries of financial folly. Princeton: Princeton University Press. Reinhart, Carmen. M and Kenneth Rogoff (2010) 'Growth in a Time of Debt', American Economic Review 100(2): 573-578. Reinhart, Carmen. M., Vincent R. Reinhart and Kenneth Rogoff (2012) 'Public debt overhangs: advanced-economy episodes since 1800', The Journal of Economic Perspectives 26(3): 69-86. Schich, Sebastian and Sofia Lindh (2012) 'Implicit guarantees for bank debt.' OECD Journal: Financial Market Trends 2012(1): 45-63. Schmidt, Emerson P. (1943) 'Private versus Public Debt', American Economic Review 33(1): 119-121. Summers, Larry H. (2014) 'US economic prospects: Secular stagnation, hysteresis, and the zero lower bound', Business Economics 49(2): 65-73. Taylor, Alan M. and Caro Corrado (2012) 'The Great Leveraging', National Bureau for Economic Research Working Papers No. w18290. Woo, Jaejoon and Manmohan S. Kumar (2010) 'Public Debt and growth', Economica 82(328): 705–739.. 99.
(22) Vanlaer, Marneffe, Vereeck, Van Overtveldt ● Does debt predict growth?. Appendix Descriptive statistics. Country. Public Debt to GDP. Private Debt to GDP. Total Debt to GDP. Yearly increase in total debt. Real GDP per capita Growth. Australia. 23,81%. 103,66%. 128,36%. 2,11%. 2,05%. Austria. 44,86%. 96,39%. 142,33%. 3,76%. 2,57%. Belgium. 88,24%. 132,83%. 229,69%. 4,71%. 2,34%. Canada. 69,22%. 129,70%. 198,92%. 2,49%. 2,01%. Czech Republic. 25,58%. 69,27%. 94,85%. 1,40%. 1,82%. Denmark. 36,36%. 156,07%. 192,49%. 4,23%. 2,01%. Finland. 25,79%. 119,74%. 149,83%. 3,34%. 2,68%. France. 39,86%. 106,58%. 151,33%. 3,88%. 2,23%. Germany. 42,71%. 109,07%. 151,96%. 2,12%. 2,17%. Greece. 65,48%. 54,84%. 120,78%. 5,26%. 2,70%. Hungary. 80,91%. 86,14%. 165,86%. 5,42%. 1,95%. Ireland. 58,50%. 139,23%. 201,05%. 7,75%. 3,42%. Italy. 79,09%. 80,27%. 159,36%. 3,23%. 2,27%. Japan. 83,33%. 168,83%. 256,93%. 5,99%. 3,46%. Luxembourg. 8,25%. 351,04%. 363,05%. 15,47%. 2,74%. Mexico. 38,43%. 23,52%. 70,57%. 0,18%. 1,92%. Netherlands. 58,17%. 122,26%. 180,44%. 3,78%. 2,11%. Norway. 36,62%. 143,06%. 181,38%. 2,01%. 2,61%. Poland. 51,53%. 46,08%. 94,65%. 1,85%. 3,77%. Portugal. 45,00%. 137,92%. 182,92%. 5,87%. 3,08%. Spain. 36,18%. 124,02%. 164,03%. 4,82%. 2,74%. Sweden. 48,24%. 148,32%. 197,14%. 3,53%. 2,13%. Switzerland. 45,51%. 156,64%. 207,46%. 2,13%. 1,41%. Turkey. 36,78%. 26,85%. 70,08%. 1,53%. 4,27%. United Kingdom. 60,39%. 111,60%. 169,91%. 2,39%. 2,01%. United States. 55,25%. 116,43%. 172,02%. 2,41%. 2,06%. Average. 48,61%. 116,51%. 168,17%. 3,65%. 2,48%. 100.
(23) European Journal of Government and Economics 4(2). Database coverage. Country. Public Debt to GDP. Australia. 1961-2012. 1. 1961-2012. 1. 1961-2012. 2. Austria Belgium. Private Debt to GDP. Total Debt to GDP. 1961-2012. 1961-2012. 1. 1961-2012. 1961-2012. 1. 1961-2012. 1970-2012. 2. 1961-2012. 1961-2012 1970-2012. Real GDP per capita Growth. Canada. 1961-2012. 1961-2012. 1961-2012. 1961-2012. Czech Republic. 1993-2012. 1993-2012. 1993-2012. 1991-2012. Denmark. 1961-2012. 3. 1961-2012. 1961-2012. 3. 1961-2012. 1961-2012. 4. 1970-2012. 4. 1961-2012. 1961-2012. 5. 1970-2012. 5. 1961-2012. 1961-2012. 6. 1961-2012. 6. 1961-2012. 1961-2012. 7. 1961-2012. 7. 1961-2012. 8. 1992-2012. Finland France Germany Greece. 1970-2012 1970-2012 1961-2012 1961-2012. Hungary. 8. 1982-2012. 1989-2012. 1989-2012. Ireland. 1961-2012. 1971-2012. 1971-2012. 1961-2012. Italy. 1961-2012. 1961-2012. 1961-2012. 1961-2012. Japan. 1961-2012. 1964-2012. 1964-2012. 1961-2012. 9. 2003-2012. 2003-2012. 1961-2012. Luxembourg Mexico Netherlands Norway. 1974-2012 1961-2012. 10. 1961-2012 1961-2012. 12. 1980-2012 1961-2012 1961-2012. 1980-2012. 11. 1961-2012 1961-2012. 12. 1961-2012 1961-2012 1961-2012. Poland. 1986-2012. 1992-2012. 1992-2012. 1991-2012. Portugal. 1961-2012. 1961-2012. 1961-2012. 1961-2012. 1970-2012. 1970-2012. 1961-2012. Spain Sweden Switzerland. 1961-2012. 13. 1961-2012. 14. 1961-2012. 15. 1961-2012 1961-2012. 1961-2012. 14. 1961-2012. 1961-2012. 15. 1961-2012. Turkey. 1961-2012. 1986-2012. 1986-2012. 1961-2012. United Kingdom. 1963-2012. 1961-2012. 1963-2012. 1961-2012. United States. 1961-2012. 1961-2012. 1961-2012. 1961-2012. 1. 2. 3. 4. Missing data for 1965. Missing data for 1965, 1980, 1981 and 1989. Missing data for 1997. Missing 5 6 7 data for 1964-1966, 1979 and 1980. Missing data for 1978 and 1979. Missing data for 1976. Missing 8 9 10 data for 1976-1978. Missing data for 1993 and 1994. Missing data for 1990. Missing data for 196211 12 13 1964, 1969 and 1981. Missing data for 1981. Missing data for 1966, 1981 and 1982. Missing data 14 for 1963 and 1964. Missing data for 1965, 1966 and 2003 15 Missing data for 1964-1969. 101.
(24) Vanlaer, Marneffe, Vereeck, Van Overtveldt ● Does debt predict growth?. -20 -10 0 10 20 30 Change in total Debt to GDP (%). -25 0 25 50 75 Change in total Debt to GDP (%). Real GDP per capita growth rate (%) -5 0 5 10. Accumulated over 15 years. -10. Real GDP per capita growth rate (%) -5 0 5 10. Accumulated over 10 years. -10. Real GDP per capita growth rate (%) -5 0 5 10. Accumulated over 5 years. -10. Accumulated over 1 year. -10. Real GDP per capita growth rate (%) -5 0 5 10. Growth performance over 1 year with debt accumulation over 1-15 year (h=1 and d=1,5,10,15) – outliers removed. -50 -25 0 25 50 75 100 Change in total Debt to GDP (%). -50 0 50 100 150 Change in total Debt to GDP (%). -15 -5 5 15 25 Change in total Debt to GDP (%). -30 -15 0 15 30 45 Change in total Debt to GDP (%). Real GDP per capita growth rate (%) 0 5 10. Accumulated over 15 years. -5. Real GDP per capita growth rate (%) 0 5 10. Accumulated over 10 years. -5. Real GDP per capita growth rate (%) 0 5 10. Accumulated over 5 years. -5. Accumulated over 1 year. -5. Real GDP per capita growth rate (%) 0 5 10. Growth performance over 5 year with debt accumulation over 1-15 year (h=5 and d=1,5,10,15) – outliers removed. -50 -25 0 25 50 75 Change in total Debt to GDP (%). -30 0 30 60 90 120 Change in total Debt to GDP (%). -20 -10 0 10 20 Change in total Debt to GDP (%). -30 -15 0 15 30 45 Change in total Debt to GDP (%). Real GDP per capita growth rate (%) 0 5 10. Accumulated over 15 years. -5. Real GDP per capita growth rate (%) 0 5 10. Accumulated over 10 years. -5. Real GDP per capita growth rate (%) 0 5 10. Accumulated over 5 years. -5. Accumulated over 1 year. -5. Real GDP per capita growth rate (%) 0 5 10. Growth performance over 10 year with debt accumulation over 1-15 year (h=10 and d=1,5,10,15). -25 0 25 50 75 Change in total Debt to GDP (%). -30 0 30 60 90 Change in total Debt to GDP (%). -20 -10 0 10 20 Change in total Debt to GDP (%). -30 -15 0 15 30 45 Change in total Debt to GDP (%). 102. Real GDP per capita growth rate (%) 0 5 10. Accumulated over 15 years. -5. Real GDP per capita growth rate (%) 0 5 10. Accumulated over 10 years. -5. Real GDP per capita growth rate (%) 0 5 10. Accumulated over 5 years. -5. Accumulated over 1 year. -5. Real GDP per capita growth rate (%) 0 5 10. Growth performance over 10 year with debt accumulation over 1-15 year (h=10 and d=1,5,10,15) – outliers removed. -25 0 25 50 75 Change in total Debt to GDP (%). -30 0 30 60 90 Change in total Debt to GDP (%).
(25) European Journal of Government and Economics 4(2). Real GDP per capita growth rate (%) 0 5 10. (h=10. Accumulated over 15 years. -5. Real GDP per capita growth rate (%) 0 5 10. Accumulated over 10 years. -5. Real GDP per capita growth rate (%) 0 5 10. Accumulated over 5 years. -5. Accumulated over 1 year. -5. Real GDP per capita growth rate (%) 0 5 10. Growth performance over 10 years with debt accumulation over 1-15 year and d=1,5,10,15) – Public & private debt. Accumulated over 1 year. Accumulated over 5 years. Accumulated over 10 years. Accumulated over 15 years. -30 -15 0 15 30 45 Change in private Debt to GDP (%). -5. -5. -5. -5 -10 -5 0 5 10 15 Change in private Debt to GDP (%). Real GDP per capita growth rate (%) 0 5 10. -60 -30 0 30 60 90 Change in public Debt to GDP (%). Real GDP per capita growth rate (%) 0 5 10. -50 -25 0 25 50 75 Change in public Debt to GDP (%). Real GDP per capita growth rate (%) 0 5 10. -30 -15 0 15 30 45 Change in public Debt to GDP (%). Real GDP per capita growth rate (%) 0 5 10. -10 -5 0 5 10 15 Change in public Debt to GDP (%). -25 0 25 50 75 Change in private Debt to GDP (%). -25 0 25 50 75 Change in private Debt to GDP (%). -15 -5 5 15 25 Change in total Debt to GDP (%). -50 -25 0 25 50 Change in total Debt to GDP (%). 103. Real GDP per capita growth rate (%) 0 5 10. Accumulated over 15 years. -5. Real GDP per capita growth rate (%) 0 5 10. Accumulated over 10 years. -5. Real GDP per capita growth rate (%) 0 5 10. Accumulated over 5 years. -5. Accumulated over 1 year. -5. Real GDP per capita growth rate (%) 0 5 10. Growth performance over 15 year with debt accumulation over 1-15 year (h=15 and d=1,5,10,15) – outliers removed. -25 0 25 50 75 Change in total Debt to GDP (%). -30 0 30 60 90 Change in total Debt to GDP (%).
(26)
Figure

+7


Documento similar