Using specific test to access for initial teacher training
18
0
0
Texto completo
(2) Journal for Educators, Teachers and Trainers, Vol. 9 (1) ISSN 1989 – 9572 http://www.ugr.es/~jett/index.php. Using specific test to access for initial teacher training La utilización de pruebas específicas para acceder a la formación inicial del profesorado Laura Pérez Granados, Universidad de Málaga, España lpgranados@uma.es Abstract Over recent years Finland has led the way in international research and studies into teacher recruitment and training. The number of people wishing to do a degree in teaching far exceeds the number of places available, meaning that universities set very high standards when selecting students. Having an understanding of the entry procedure for the most exemplary teacher education courses in the world could help us to identify the keys to success when choosing the most suitable prospective teachers and also to find new ways of carrying out the university admissions process in Spain and in other countries in Europe. In this regard, we focus on the following aspects: What would happen if we applied Finnish standards to students just starting their teaching degrees? What type of knowledge and/or personal dispositions should be taken into account when selecting prospective teachers? This article aims to show the results attained after recreating the Finnish selection procedure for teaching degree students, in this case involving a sample of students from the Faculty of Education Sciences of the University of Malaga. The results show that none of the students in the sample responded positively to the different tests they undertook. Resumen En los últimos años Finlandia se ha convertido en el país que lidera los estudios e investigaciones internacionales en materia de selección y formación de docentes. El número de candidatos que pretenden acceder cada año a los estudios de magisterio sobrepasa en mucho la cantidad de plazas ofertadas, por lo que las universidades establecen unos criterios muy exigentes para la selección de sus estudiantes. Conocer cómo es el procedimiento de acceso a los estudios de formación docente más ejemplar del mundo puede ayudarnos a entender cuáles son las claves del éxito a la hora de elegir a los candidatos más idóneos y arrojar luz sobre posibles sugerencias y vías de avance para nuevos modelos de acceso a la universidad en España y en otros países de Europa. En este sentido, nos centramos en los siguientes interrogantes: ¿qué pasaría si aplicamos los estándares de Finlandia a los estudiantes que acaban de acceder a nuestras facultades de educación? ¿qué tipo de conocimientos y/o disposiciones personales son necesarios considerar a la hora de seleccionar a los candidatos? Este artículo pretende mostrar los resultados obtenidos tras conseguir recrear el procedimiento de selección que se lleva a cabo en Finlandia para admitir a los estudiantes de magisterio sobre una muestra de alumnos y alumnas de la Facultad de Ciencias de la Educación de la Universidad de Málaga. Los resultados muestran que ningún estudiante fue capaz de responder positivamente a las diferentes cuestiones planteadas. Keywords College admissions; Teacher qualifications; Teacher education; Higher education Palabras clave Acceso a la universidad; Competencias docentes; Formación de profesorado; Educación Superior. Journal for Educators, Teachers and Trainers JETT, Vol. 9 (1); ISSN: 1989-9572. 56.
(3) 1. Introducction Widespread dissatisfaction, both in Spain and around the world, with current educational systems and the pressures of the market economy have intensified concern for finding new forms of conceiving and understanding teaching and learning processes (Gimeno, 2008), questioning the quality of initial teacher training processes and discussing the procedures to reform their admissions process. At the current time, in which the policy governing admissions to higher studies in Spain is immersed in a process of change, the analysis of alternative pedagogical models is an essential requirement and, in this sense, proposing rigorous mechanisms to select candidates prior to the training process could constitute one of the most interesting aspects to raise the status and quality of future teachers. Spain, as a member of the European Union, forms part of the common strategies and challenges in educational policy aimed at increasing the quality of teaching and of teacher training. it should be noted that the main goals set out in the Strategic Framework for Education and Training in Europe (Europe, 2020) focus on improving initial and on going training for teachers in order to ensure teaching is an attractive professional option. Indeed a recent report by the European Commission (2012) on support for the teaching profession includes proposals for Member States which stress that “a key challenge for the European Union over forthcoming years is not simply to fill teacher vacancies, but rather to find the best candidates to fill them” (p. 28). As some authors have stated (Sahlberg, 2011; Jakku-Sihvonen & Niemi, 2011), selecting candidates for teacher training studies is an essential procedure in order to guarantee the success of students during their formative years, whilst also providing a suitable way to select prospective teachers who are committed not only academically but also ethically. In this regard Valle (2013) believes that “if there is one single determinant factor when a social group constructs an image of the prestige of a profession, it is that this group considers it to be difficult to enter this profession due to the high level of training and standards required” (p.14). Moreover, in order to improve the quality of teacher training and increase the social recognition of teachers, Imbernón (2013) believes it is necessary to improve the selection of prospective candidates for teacher training. These affirmations lead us to the following questions: Could we consider new models for access to initial teacher training which are more demanding than the one currently in place? Should education faculties set up specific tests to select students? 2. Selection before training Research into admissions procedures and selection of candidates for teacher training has become a highly acclaimed field of study in Finland. According to Simola (2005), the teaching profession in Finland has always been held in great esteem, which has led to teacher training programmes becoming highly demanded and to students with the best academic records in secondary education looking to enter the Education Faculties. Every year, only one in ten candidates in the admissions process gains entry to the teacher training programmes. Given the high number of applicants and the difficulty in selecting them, in 2007 the Ministry of Education decided to reform the admissions process for teacher training studies, adding a national exam to the candidate pre-selection stage. This meant that there was an initial nationwide test for all people wishing to access any speciality in the education field. The aim in this initial stage is to gauge the prospective teacher's understanding and ability to apply knowledge. In addition to this generalised, standardised exam, each university has autonomy to decide the selection criteria for its candidates and draws up the tests it considers necessary to admit the most suitable students. Although the selection procedure varies from university to university, most of them carry out individual interviews with each applicant in order to discuss the reasons behind their decision to choose a career in teaching. This final stage takes into account not only their academic and interpersonal skills, but also their commitment and motivation towards their future profession. Authors such as Räihä (2010) place importance on specific tests which pay attention to the motivation, aptitude and capability of youngsters to successfully navigate a. Journal for Educators, Teachers and Trainers JETT, Vol. 9 (1); ISSN: 1989-9572. 57.
(4) teaching degree, since such tests, despite their constraints, provide the most functional way of assessing the suitability of candidates. In Spain the situation is significantly different: the disappearance of the University Entrance Test (PAU) and the option to establish a new university admissions procedure are prominent in the debate over the changes currently taking place in our educational system. This proposal provides universities with a new way of dealing with admissions by giving them autonomy to design their own selection tests. However, as we await the implementation of these new measures, the PAU remains in force and continues to generate significant public discussion and controversy amongst youngsters, despite having been in place for almost forty years. This test is carried out nationally and is the same for all candidates, whatever degree course they wish to take. This is made up of a compulsory general stage and a voluntary specific stage. The exams which make up the PAU focus on testing the content worked on during secondary education, broken down by area of knowledge, without any relation to the future exercise of professional activity. In this transitory stage, as we await the implementation of the measures proposed by the government, it would be worthwhile asking what alternatives exist beyond our frontiers and what challenges need to be overcome in order to ensure the current process to reform university admissions in Spain achieves the highest quality possible. The aim of this article is to present the findings after taking the standards and criteria used to select students for access to the Faculty of Behavioural Sciences of the University of Helsinki and applying them to students wishing to undertake the Primary Education degree at the Faculty of Education Sciences of University of Malaga. The research work covers the following processes: definition of purpose, description of the method followed for data collection, sample selected, description of the procedure in carrying out the tests, assessment criteria for these tests, comparative results and conclusions of the analysis carried out. 3. The methodological approach In order to carry out this research, the methodology we use is inscribed in the current known as interpretive or qualitative, which, from the hermeneutics of Dilthey through to the social constructionism of Gergen, has covered the entire territory of Human and Social Sciences. With regards to the foundations of these basic epistemological assumptions, our interpretive methodological approach has focused on descriptive aspects, in particular through content analysis, which also led us to the selection and application of quantitative techniques. This methodological pluralism, considered by Cook and Reichard (2005) to be the most suitable to deal with the multiple needs of research and to achieve extensive knowledge of the object of study through mutual support, is called mixed or plurimodal, thanks to the use of techniques and strategies of both currents (qualitative and quantitative). In this regard, we should also indicate the comparative perspective as a common theme in this research, in accordance with the tasks proposed in the work plan. Authors such as Noah (1990) justify the comparative approach in education with these words: “knowing what is proposed and how it is developed in situations similar to those we experience is essential in order to establish a reasonable opinion on what to do in our country” (p.180). 3.1. Sample The initial research counted on 30 participants (N=30) from Year 1 of the Primary Education degree of the Faculty of Education Sciences of University of Malaga, academic year 2015-2016. The sample was chosen entirely at random, by taking the students with odd numbers on the class register (which totalled 67 students) and then continuing with the even numbers until all 30 places were taken. The sample was selected entirely at random to ensure objectivity in the choice of participants and avoid any unwanted skewing of results.. Journal for Educators, Teachers and Trainers JETT, Vol. 9 (1); ISSN: 1989-9572. 58.
(5) 3.2. Procedures used in the quantitative data analysis For analysis of the information, the descriptive statistics of central tendency (mean, median and mode), measures of position (quartiles Q1, Q2, Q3), absolute dispersion (standard deviation) and relative dispersion (coefficient of variation) have been estimated for the results attained by the candidates in both countries. 3.3. Instruments The instruments, procedures and assessment criteria applied were the same as those used in the admissions process for the University of Helsinki in 2011. Current affairs articles The test used three articles taken from the 2013 aptitude test for the Faculty of Behavioural Sciences of the University of Helsinki. These articles are not chosen based on any particular selection criteria but must simply be short (no more than one page long), deal with a question of current interest in the field of education and be published in the general press rather than in scientific reviews. Article 1 was titled: "Schooling for immigrants is likely to be more successful when teaching the mother tongue"; Article 2 was "Children are left uncared for when parents are consumed by work"; and Article 3 was “There's no magic wand for having a good time at school”. The interview and the assessment form Some of the questions which the assessors posed to the candidates were as follows: - Why would you like to be a teacher? Why have you chosen Primary Education as your speciality? - Were you involved in any associations, voluntary groups or other activities related to education or civil society before starting university? - What type of teacher would you like to be? Could you name your strengths and weaknesses as relate to the teaching profession? In Finland this interview is carried out by three teachers who pay attention to three fundamental aspects: 1) The suitability of the candidate for teacher training and the teaching profession. 2) His or her motivation towards the field of education. 3) His or her communication skills. Finally, to assess and score the test (presentation of the selected article and interview), the assessors counted on the same assessment form as used in the tests in Finland. This record sheet or assessment form is divided into four large sections, each of which is graded in line with an assessment scale from 1 to 5 (5 being the highest score). Each assessor will grade the candidate independently, noting down any remarks he or she considers appropriate, up to a maximum score of 20. In Finland the teams of assessors are made up of 3 teachers, meaning the maximum score which a candidate can reach is 60 points. The following formula or method is then applied to obtain the candidate's overall score 1 : y= 2x+30. This means that if a candidate achieves 60 points in the test, his or her final score will be 150. The minimum overall score which a candidate can therefore reach is 54 points, whilst the maximum score is 150. In our case, we formed 3 pairs of assessors to interview each candidate at the same time, with the maximum score, as is the case in Finland, being 20 points, meaning the. 1 This method is used to stress the importance of the aptitude test, since 40% of candidates are selected exclusively through this test.. Journal for Educators, Teachers and Trainers JETT, Vol. 9 (1); ISSN: 1989-9572. 59.
(6) total overall score which could be achieved was 40 points. The formula we applied for our maximum (40 points) to reach the 150 points of Finland is as follows: “y=3x+30”. 3.4. Procedure The candidates carried out the tests individually. The interviews took place every half an hour, meaning whilst one candidate read the text another was being interviewed by the assessors. The total time passed to complete the assessment sessions was two weeks. The assessor team counted on 4 teachers from the Department of Didactics and School Organisation of the University of Malaga. In the days prior to the interviews with the candidates, the teachers in charge of carrying out the assessment held a meeting to explain the procedure, clarify the text selection criteria and read the texts which would be given to the candidates in the test. This meeting was therefore used to harmonise the terms, concepts, procedures and criteria of the assessment. Once the assessors were duly informed of the entire process, students were given the schedule to start the tests. The test consists of two parts which are carried out in a single session. Half an hour before the start of the interview, the candidate is given three different articles to read. The candidate must choose one of these articles, which will then be presented to the assessors. Once the candidate has read the text, the interview begins. The candidate has 15 minutes to speak about the text, outlining its main ideas and indicating the reason why he or she chose it. Once this first part is complete, the interview focuses on the life history of the candidate, his or her interests, previous experience in the world of education, and the main reasons behind his or her wish to become a teacher. The estimated time for the two parts is 30 minutes. 3.5. Assessment criteria The record sheet for each candidate must be used to evaluate the four assessment sections (presentation of the text, motivation, aptitudes and interpersonal skills). Presentation of the text This initial criterion refers to the information collected in the first part of the test. In this first part, the candidate must talk about the text he or she has just read, fulfilling the following conditions: - The applicant presents an interesting point of view, describes the text in a clear manner and is capable of locating the key concepts or terms which appear in it. - The applicant can use the text as an opportunity to demonstrate his or her oral language skills and to use precise, rich spoken language. - The applicant is capable of justifying his or her point of view on the text in a coherent manner. The following outline represents the subdivisions of this first assessment criterion. The information these criteria contain represent, principally, the assessment scale score closest to 5. The assessor's overall score for the candidate should be based on the level of depth of each of these criteria.. Journal for Educators, Teachers and Trainers JETT, Vol. 9 (1); ISSN: 1989-9572. 60.
(7) PRESENTATION OF THE ARTICLE ORGANISATIONA Properly organise Locate concepts L ideas Describe the text. Wealth of language. LEXICAL. Wide variety of concepts. FUNCTIONAL No repetition of ideas. Message is coherent Ability to argue in favour of his or her point of view. Conveys the message of the text in a natural way. MATURITY AND Puts forward ideas Presents an interesting CREATIVITY and makes proposals point of view Relates the text to the reality of social and educational life. Figure 1. Assessment criteria in the presentation of the article Source: Own elaboration. Interview In this second part the assessment criteria focus on evaluating three fundamental aspects: the motivation of the candidate to be a teacher, aptitude, and communication skills. Motivation to be a teacher -. The applicant can justify his or her interest and enthusiasm for teaching in a realistic, credible and coherent manner. His or her previous work and life history show constant effort and interest towards social interaction tasks, including teaching. Planning and preparation focused on teaching. For example: the candidate can express his or her interest in teacher training, learning problems, teaching or education, and interest in the professional sector. The applicant's motivation is specifically targeted at his or her choice of speciality (primary education, infant education, etc.).. Teaching aptitude and attitude -. The applicant is interested in the teaching profession and can see him or herself as a teacher, and has consequently orientated his or her studies and life history to this end. His or her ideas are reasonable and can be feasibly implemented. He or she presents a realistic view of school life and the teaching profession. The applicant is capable of naming his or her strengths and weaknesses. The applicant must have a constructivist vision of him or herself and a realistic outlook on teaching.. Communication skills. Journal for Educators, Teachers and Trainers JETT, Vol. 9 (1); ISSN: 1989-9572. 61.
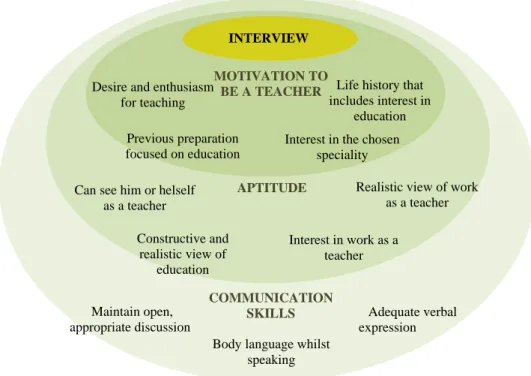
(8) -. During the interview, the applicant is capable of establishing an adequate, open discussion with the assessors and, where necessary, is able to continue the discussion and bring up new aspects. The applicant's verbal expression and body language is natural, smooth and clear.. The following outline, similar to the one above, represents all subdivisions of the criteria assessed in this second part of the test. In this case the assessor scores each subdivision independently from 1 to 5.. INTERVIEW MOTIVATION TO Desire and enthusiasm BE A TEACHER Life history that includes interest in for teaching education Previous preparation focused on education. º. Interest in the chosen speciality. APTITUDE. Can see him or helself as a teacher. Constructive and realistic view of education. Interest in work as a teacher. COMMUNICATION SKILLS. Maintain open, appropriate discussion. Realistic view of work as a teacher. Adequate verbal expression. Body language whilst speaking. Figure 2. Assessment criteria in the interview Source: own elaboration. 4. Description and analysis of results 4.1. Spain and Finland total scores The results attained by the Spanish sample are as follows:. Journal for Educators, Teachers and Trainers JETT, Vol. 9 (1); ISSN: 1989-9572. 62.
(9) Table 1. Frequency of results ordered by scores. Spain SPAIN SCORE 60 72 75 78 81 84 87 93 96 99 102 108 111 114 117 120 126 129. FREQUENCY 1 2 2 2 3 2 1 1 1 3 1 2 2 2 1 1 2 1. Source: Own elaboration We have also included the results attained by the Finnish candidates below: Table 2. Frequency of results ordered by scores. Finland FINLAND SCORE 132 134 136 138 140 142 146 148 150. FREQUENCY 2 6 3 11 12 6 1 5 2. Source: own elaboration. As can be seen, the scores for candidates in Spain are below the results attained in the same tests by students in Finland. In consequence, none of the candidates in Spain reached the minimum scores necessary to access teacher training studies. The minimum score attained by a candidate in Finland in 2011, and, in consequence, the score necessary to obtain access, was 132 points. The minimum score reached in Spain by one of the candidates (129 points) was 3 points below the minimum required in Finland for university admission. With regards to the difference between the minimum score attained in Spain (60 points) and the minimum demanded in Finland (132 points), it can be seen that there is a significant difference between the two countries, since candidates in Spain attained less than half of that achieved by candidates in Finland.. Journal for Educators, Teachers and Trainers JETT, Vol. 9 (1); ISSN: 1989-9572. 63.
(10) The following table provides a summary of the most relevant information on the scores obtained in both countries. It can be seen that the results are significantly different. The average score in Spain was 96 points, whilst in Finland the candidates achieved an average of 139.83 points. Moreover, the value which is most repeated amongst the Spanish candidates is 99, whilst in Finland the value most obtained by candidates is 140. Table 3. Results of the descriptive statistics in both countries Descriptive Statistics MEAN MEDIAN MODE Q1 Q2 Q3 Standard Deviation Coefficient of Variation. SPAIN 96 97.5 99 81 97.5 111 18.92 0.20. Source: own elaboration. FINLAND 139.83 140 140 138 140 142 4.65 0.03. As can be seen, deviation in Spain (18.92) is much higher than that attained in the scores in Finland (4.65). Moreover, the coefficient of variation for Finland indicates that the values are highly concentrated relative to the mean, i.e. the scores attained by the candidates are more homogeneous. In the case of Spain, the coefficient of variation is 0.20, indicating that the results obtained by the candidates are highly disperse, i.e. they are much higher or lower than the mean. These results initially indicate that the Spanish sample is made up of a much more generic group which is not specialised in education; the Finnish sample, on the other hand, involves a much more homogeneous group, within a reduced interval which shows a certain level of pedagogical specialisation. For further clarification of the overall scores obtained in Spain, the results of the candidates are presented below, grouped together by categories of the applied tests. This will allow us to carry out a more precise analysis in order to understand the distribution of the candidates' scores in each of the tests and to see the strengths and/or weaknesses of the Spanish students. 4.2. Presentation and analysis of the text Chart 1 shows the percentage of candidates in each of the values which could be used when rating this section. As can be seen, most candidates (36.67%) are below the mean score (3), i.e. between the values ≤ 2 and > 3. These scores include the candidate's ability to focus on the main point of the text and to suitably order its ideas and elements. 100 80 60 % Candidates. 36,67. 40. 26,67. 20. 20. 16,67. 0. 0. 1. 2. 3. 4. 5. Chart 1. Presentation and analysis of the text Source: own elaboration. Journal for Educators, Teachers and Trainers JETT, Vol. 9 (1); ISSN: 1989-9572. 64.
(11) 26.67% of the participants are between the values ≤ 3 and > 4; this part of the test evaluated the candidate's ability to relate the role of schools to the subject of the article and to coherently justify his or her point of view on the text. In general terms, it can be seen that most of the sample is distributed in the values between 1 and 3, it being significant that there are no candidates in the highest value. This group of candidates is characterised by taking just five minutes to finish this first part of the presentation of the text. They were not able to identify and organise the ideas in the text, nor did they show proper understanding of the concepts dealt with in the article and, moreover, failed to use the lexical resources or wealth of language necessary in a communication situation. We can see an example of a candidate who scored one point in the following fragment of interview. "Maybe… it's a recent phenomenon, now children are always left alone. Me too, I am always on my own… I mean, my parents don't work in the evening or anything but they are always out and I'm left alone whilst my sister is in the other room playing on the computer. You know, I've got cousins who are always on the computer and all they think about is buying new games and stuff like that… I think it's bad… I'm not sure… it does affect me… all children like to be with their parents, I think it's a little sad.. […]” (Candidate 3, Article 2) 4.3. Motivation Chart 2 shows the percentage of candidates in each of the values used when grading motivation to be a teacher. In general terms the data indicate that we are faced with a bimodal chart, in other words there is a group of unmotivated candidates (36.67%), between values ≤ 2 and > 3, and a highly motivated group (30%), between values ≤ 4 and > 5. In this regard, the first group of candidates, which is the most numerous, believe that it is important to have specific skills to work in teaching, even though their responses were full of stereotypes to express the reasons for their choice of study. We can see an example of a candidate given a score of 2 points: It has been my vocation since I was young, and because my parents also studied this degree… I saw that I enjoyed teaching and being with children and things like that. […] I don't believe that just anybody can teach children, well not properly anyway”. (Candidate 4) In the second group of candidates we find a life history which included a desire for teaching, resulting in enthusiasm for working with children of this school age, whilst most said that they had previous experience in social or school activities. 100 80 60. % Candidates. 36,67. 40. 26,67. 30. 20 6,67. 0 1. 0. 2. 3. 4. 5. Chart 2. Motivation. Source: own elaboration. Journal for Educators, Teachers and Trainers JETT, Vol. 9 (1); ISSN: 1989-9572. 65.
(12) As shown in the data, once again no candidate achieved the highest score in this section, since none of them presented a suitable combination of reasons which proved they were motivated to match their professional aspirations with effort, persistence and commitment. It should also be stated that only 6.67% of the candidates are found in this first value interval (≤ 1 and > 2) . 4.4. Teaching aptitude and attitude Chart 3 shows the distribution of the percentage of candidates in each of the values which grade aptitudes and attitudes showing that they see themselves as future teachers. As can be seen, most candidates (40%) are 1 standard deviation below the mean. These candidates, which are accumulated between values ≤ 2 and > 3, showed a degree of clarity when defining themselves as future professionals, even though they were somewhat hesitant when justifying their reasons for studying teaching and had some difficulty expressing a reasonable idea of the work of a teacher and the reality of school life. 100 90 80 70 60 50. % Candidates. 40. 40. 33,33. 30 20. 16,67. 10. 10. 0. 0 1. 2. 3. 4. 5. Chart 3. Aptitude and Attitude Source: own elaboration. As with the previous charts, we do not find any candidate in the upper range of scores. Moreover, in the lower value with 10% distribution we find candidates whose responses were stereotyped or superficial when seeing themselves as future teachers. Meanwhile, in the intermediate to upper values we see 16.67% of candidates in the range ≤ 4 and > 5; these candidates stressed the importance of a commitment to society in order to exercise the teaching profession. This is reflected in the following fragments taken from interviews for candidates who were given a score of 4 points for this criterion. “[…] I have always liked this graduate course because I see it as being highly social, allowing you to help others to learn. I would like to arouse a sense of dialogue in my pupils, meaning they would respect me but also trust me and speak to me as somebody who is close to them". (Candidate 17) "I have always felt concerned with helping others; I take part in organisations with children, where we go on trips with them. This is where I learned that working with children is what I like best. I believe I can help society by being a teacher. I think education in Spain is in a very bad state, and I would like to change our concept of teachers. I would like pupils to respect me just as I respect them, not because they see me as an institution but rather because our relationship is closer". (Candidate 28) Finally, in the mean value and 1 standard deviation above we find 33.33% of candidates, namely candidates who maintain a coherent discourse on the reality of schooling and are capable of expressing their virtues and defects when it comes to teaching.. Journal for Educators, Teachers and Trainers JETT, Vol. 9 (1); ISSN: 1989-9572. 66.
(13) 4.5. Communication Skills Chart 4 shows the distribution of the percentage of candidates who are in each of the values which grade communication skills during the interview. Similarly to the previous chart, we find most candidates in the values ≤ 2 and > 3, with a significant 46.67% of the total. The first conclusion reached is that most members of the group are below the mean and, in consequence, in the lower part of the chart. The candidates in this interval were not able to convey the message fluently, had difficulty maintaining order in their discourse, and used a language with excessive use of pet expressions and fillers. 100 90 80 70 60 50. 46,67. 40. % Candidates. 30. 30. 20. 16,67. 10. 3,33. 0 1. 3,33 2. 3. 4. 5. Chart 4. Communication Skills Source: own elaboration. We find 3.33% of candidates in the lower and upper ends of the chart and between values ≤ 1 and > 2, e =5, respectively. In this regard we are faced with the same distribution of candidates, which, in both cases, is very low; these candidates have serious difficulties expressing themselves and maintaining a fluid conversation with the assessors or, to the contrary, they are very good at communicating in a natural way and can maintain an open, effective discussion with the assessors which is characterised by the use of a richness of language. We have taken some expressions of a candidate who received a score of 5 points and indicated them below. “[…] I have a lot of doubts about how to organise the class and how to be a teacher. As a pupil I have often had to bite my tongue for fear of what the teacher's response would be. I have had teachers who have helped me be myself and express myself freely, always with politeness and respect; I would like my pupils to be able to speak to me". (Candidate 17) 30% of candidates are in the value range ≤ 3 and > 4; these are candidates who, despite having some difficulty using clear concepts when dealing with education, nevertheless had the ability to clarify or refine the information in line with the demands of the assessors. To move forward with this analysis, we obtained the results they had achieved in the University Entrance Test in order to transfer these scores to a normal distribution and know whether the selected candidates were within the mean of the students who had passed this year.. Journal for Educators, Teachers and Trainers JETT, Vol. 9 (1); ISSN: 1989-9572. 67.
(14) 0,45 0,4 0,35 0,3 0,25 Calificaciones PAU. 0,2 0,15 0,1 0,05 0 4. 5. 6. 7. 8. 9. 10. Chart 5. Distribution of candidates' results in the General Stage of the University Entrance Test Source: own elaboration. The mean of the results in the General Stage of the University Entrance Test for the sample of candidates was 6.99 points. As is well known, this score is obtained by dividing the sum of the different scores of each of the candidates by the digit which represents them overall. As can be seen in the chart, the "University Entrance Test marks" variable is distributed practically as a mean with a normal curve, since, in this case, only those candidates who passed the entrance test are taken into account, i.e. those who achieved a score of at least 4 in this test. This variable is distributed practically like the Gaussian bell curve, meaning that the results which the candidates achieved in this General Stage of the University Entrance Test are within the normal mean of the population. Given all the foregoing, we can state that the candidates selected for our study are even slightly above the mean of those who passed in Spain this year, since the average was 6.346. Moreover, in order to know the correlation existing between the results achieved in the University Entrance Test and those attained by our candidates in the Finland Aptitude Test, we calculated the Pearson correlation coefficient, the result of which was 0.02, indicating that the relation between both tests is nil. This would initially indicate that the tests demand different skills from the candidate. It should be remembered that the University Entrance Test focuses on measuring academic performance, whilst the pedagogical attitude and aptitude test in Finland stresses the importance of interpersonal and communication skills, the ability to analyse and comment on pedagogical texts, and the motivation of candidates with regards to the teaching profession. 5. Discussion of results The results show that none of the candidates in Spain were successful in the selection tests for students wishing to do a teaching degree in Finland. 5.1. Exposition, understanding and analysis of the selected text With regards to the abilities measured in this test, we can conclude that Spanish students show significant deficits in: -. Higher-order cognitive skills such as analysing, comparing, organising thoughts, defending positions and proposing alternatives. In this sense, the candidates do not have a critical attitude towards the issues presented in the article and were unable to use creative, innovative thinking in order to find solutions to complex problems which require more than just academic or theoretical knowledge for a successful resolution.. Journal for Educators, Teachers and Trainers JETT, Vol. 9 (1); ISSN: 1989-9572. 68.
(15) In general terms we can state that most candidates are concentrated in the lowest scores and have second-order skills, i.e. those which are related to the ability to recognise concepts, remember them, and understand the meaning of terms in a superficial manner. In this case, using current affairs articles which are related in some way to education offers candidates the opportunity to openly express their opinions on the subject and to analyse and diagnose the situation using all the resources, ideas and approaches developed throughout their academic, social and personal life. However, the scores for most candidates in this first part of the test are in the lower part of the chart, where the assessors were unable to obtain information on the personal richness of each candidate in terms of manipulating the concepts and the diversity of content in the article. 5.2. Why did they decide to become teachers? The importance of personal dispositions With regards to the skills considered in this test, Spanish students showed an important deficit in terms of the subjective dispositions which lead to them deciding to become teachers. However, in this aspect the results (see chart 2) on the motivation of the candidates to do a teaching degree show an irregular distribution characterised by two modes, i.e. our candidates are accumulated principally in two groups. The first group, and also the most numerous with 36.67% of candidates between the values ≤ 2 and > 3, display low motivation towards their professional future, showing a clear deficit when justifying why they had chosen this particular study option. Moreover, their responses were laden with stereotypes, as can be seen in one phrases most repeated amongst the candidates: <<I want to be a teacher because I like children>>. This phrase clearly indicates the superficial nature of the reasons which had led them to choose this option. There is a second group of candidates, located in the values ≤ 4 and > 5, in which we find a life history which included a constant desire for teaching, resulting in enthusiasm for working with children of this school age, whilst most said that they had previous experience in social or school activities. We believe that this final group could be suitable to select prospective teachers in Spain, indeed it is difficult to argue that the group of students who were unable even to explain why they chose this profession could be in any way successful. The results of our search for personal dispositions towards the teaching profession provided very disappointing results, since, as can be seen in the data on aptitudes and attitudes showing that candidates saw themselves as future teachers, most candidates are below the mean. These candidates, who make up 40% of the total, were bold when defining themselves as future professionals, but were unable to present a convincing approach with regards to the work of a teacher or to solving the problems of school life. It should also be mentioned that, as with the previous charts, there are no candidates in the upper end of the scores. 5.3. The relevance of communication skills in the interview As can be seen in our results, the majority of candidates are once again found in the values ≤ 2 and > 3. This means that our candidates were unable to convey the message in a fluent manner, with most of them stuttering and hesitating. When presenting their ideas, they found it difficult to maintain order in their discourse and generate a rapport with the listener, often speaking too quickly or in a monotonous tone. The image they portrayed was of a lack of naturalness with poor non-verbal communication. It is very disappointing that 46.67% of our interviewees are not able to maintain a fluent conversation about their school history, their motivations for choosing teaching as their future career or their concerns about school life and social realities. In this regard, candidates are not asked to memorise or reproduce data or theories, but rather to express themselves in a natural, coherent manner, putting forward arguments with rich spoken language which is delivered with appropriate tone, volume and rhythm, and to take care with postural aspects such as gestures, distance between them and the assessors, etc. Finally, it should be highlighted that in this analysis we find the same distribution of candidates in the upper and lower ends of our chart. We find that 3.33% of candidates, respectively, have. Journal for Educators, Teachers and Trainers JETT, Vol. 9 (1); ISSN: 1989-9572. 69.
(16) enormous difficulty maintaining a conversation with the assessors –answering in monosyllables and finishing the test in record time– whilst, on the other hand, we find candidates with good communication skills who were able to hold an open, effective discussion with the assessors whilst using a richness of spoken language. 5.4. Caution when interpreting the statistics We identify two elements to be taken into account when interpreting the results: the small size of the sample and the possible absence of motivation among the candidates selected for the test. With regards to the small sample size N=30 is the minimum number which has been determined to carry out simple statistical calculations whilst keeping error and reliability within acceptable limits. In our case, this decision was also supported by the fact that each of the candidates selected by a team of assessors had to be interviewed, meaning that increasing the sample size also meant it was necessary to increase the number of teams required for the test. Given the unwillingness of teachers to take charge of the work, and also in order to maintain the need to establish coherent criteria between assessors and follow the same dynamic as used in Finland, we finally opted to adjust the size of the sample. With regards to the motivational difference between the two samples In this regard, it is impossible for the sample selected amongst Spanish students to share the same desire and enthusiasm as the Finnish candidates, since our candidates do not receive any benefit from taking part in this research and, given that their professional and academic futures are not in doubt, they do not have the same motivation and interest. Whilst we tried to motivate the Spanish students, encouraging them to see the test as a part of the academic framework of the course which required commitment and concentration, their motivation can never be comparable to their Finnish counterparts, since these tests are prerequisites for admission to their university and course of choice. Moreover, it should be remembered that the candidates selected did not understand the dynamics of the test: all they knew was that they would have to read a text and then be interviewed, without knowing what type of text or interview awaited them. On the other hand, Finnish students have a clear concept of the selection procedure for each university and prepare conscientiously for it. Nevertheless, the results in terms of the differences between the two samples (Spain and Finland) are so significant, clear and overwhelming that it is possible to confidently state, beyond any possible sample errors, that the samples studied are significantly different relative to the variables studied in the different tests. The Spanish students do not reach the required knowledge, proficiency, pedagogical attitudes, communication skills or level of motivation required to be considered candidates who would be accepted at University of Helsinki. 6. Conclusions The purpose of these tests is to allow the Finnish institutions to gauge the suitability of candidates and their motivation and commitment to the studies they aspire to. It is perfectly normal in Finland for university education faculties to implement specific tests to select students for different specialities. This high level of competition in university admissions and the ability to attract the most motivated youngsters are among the fundamental reasons why teaching is so highly valued and respected (Sajavaara, 2003). Moreover, the stringent selection process and the training of high quality, committed, motivated students is one of the key factors behind the highly successful educational system in Finland. It should be stated that the maximum score obtained by our candidates is below the minimum score obtained by candidates in Finland in these same tests, clearly showing that the selection. Journal for Educators, Teachers and Trainers JETT, Vol. 9 (1); ISSN: 1989-9572. 70.
(17) of prospective teachers in Spain is governed by very different criteria. Indeed, it could be argued that an important deficit in the Spanish educational system is in the selection and training of teachers as required in a quality educational system. Our candidates show significant difficulties in responding to activities that require the use of skills such as discussion, transfer and creation, along with a lack of pedagogical sensitivity to relevant educational problems and motivation with regards to the requirements, conditions and expectations of teaching. The results attained by our candidates, based on the assessment criteria for such tests, highlight the shortcomings most of them have in terms of analysing the selected text in depth, which manifests itself through their limited command of its content and practically zero ability to transfer this content to the reality of social and school life. Moreover, the results evince the superficial nature of their reasons for choosing the teaching profession and their lack of arguments when trying to maintain coherent discourse on the organisation of teaching practice and their ability to see themselves as future teachers. Notwithstanding the aforementioned caveats, it is my opinion that the results fill us with concern for the process of selecting suitable prospective teachers who have the skills and quality required in today's complex reality. In line with our experience recreating the Finnish tests, we can state, in general terms, that applicants wishing to do a teaching degree should be assessed beforehand to ensure they have sufficient interaction skills and higher-order cognitive abilities, as required in the complex profession of teaching. It is a well-known fact that the teaching profession is ever more demanding in terms of characteristics which cannot be shown in tests focused on purely academic reproductive content. In consequence, it is necessary to design tests in which these characteristics, relating to higher-order learning and subjective dispositions regarding the attitudes and motivation required in a profession as vocational and singular as teaching, can be demonstrated. Although this type of test, which fundamentally involves assessing personal dispositions based on opinions given by the candidates, may have some constraints, it is nevertheless important to extract those mechanisms or practices which can help establish a university admissions procedure in Spain in which applicants are assessed using a holistic approach, thus allowing us to choose those who are most suitable for a degree in teaching.. 7. References Cook, T.D. y Reichardt, Ch. S. (2005). Hacia una superación del enfrentamiento entre los métodos cualitativos y los cuantitativos. En Cook, T.D. y Reichardt, Ch. S., (Eds.), Métodos cualitativos y cuantitativos en investigación educativa (pp.25-58). Madrid: Morata. European Commission (2012). Supporting the teaching profession for better learning outcomes: Rethinking education: investing in skills for better socio-economic outcomes. Strasbourg, France: European Commission. Recuperado de http://eurlex.europa.eu/LexUriServ/LexUriServ.do?uri=SWD:2012:0374:FIN:EN:PDF Imbernón, F. (14 de marzo de 2013). Un fallo docente desde la base. El País Recuperado de https://elpais.com/sociedad/2013/03/14/actualidad/1363297944_043059.html Gimeno Sacristán, J. (2008). Diez tesis sobre la aparente utilidad de las competencias en educación. En Gimeno, J., Educar por competencias, ¿qué hay de nuevo? (pp.15-58). Madrid: Morata. Jakku-Sihvonen, R., y H. Niemi (2011). Aprender de Finlandia. La apuesta por un profesorado investigador. Madrid: Kaleida Forma. Noah, H. J. (1990). Usos y abusos de la Educación Comparada. En Altbach, P.G. y Kelly, G.P. (Comp.), Nuevos enfoques en Educación Comparada (pp.177-190). Madrid: Mondadori. Rähiä, P. (2010). Koskaan et muttua saa! Luokanopettajakoulutuksen opiskelijavalintojen uudistamisen vaikeudesta. Tampereen Yliopisto: Opettajankoulutuslaitos.[‘Never may your change!’: On the difficulty of reforming student selection for class teacher education programmes]. Universitatis Temperensis. Sahlberg, P. (2011). The Professional Educator. Lessons from Finland. America Educator, 35(2), 32-36. Recuperado de: Journal for Educators, Teachers and Trainers JETT, Vol. 9 (1); ISSN: 1989-9572. 71.
(18) http://www.cimo.fi/instancedata/prime_product_julkaisu/cimo/embeds/cimowwwstructure/ 25535_American_educator_summer_2011.pdf Sajavaara, K. (2003). Jyva¨skyla¨n yliopiston opiskelijavalintojen selvitysmiehen raportti. [A report of the administrator of the student selections of Jyväskylä University]. Jyväskylä: University of Jyväskylä. Simola, H. (2005). The Finnish miracle of PISA: Historical and Sociological remarks on teaching and teacher education. Comparative Education, 41 (4): 455-470. Valle, J. (2013). ¿Hay que cambiar la formación inicial de los docentes para elevar el prestigio social de maestros y profesores? En Pérez-Díaz, V., y Rodríguez, J.C., (Dirs.), El prestigio de la profesión docente en España. Percepción y realidad. Madrid: Fundación Europea Sociedad y Educación. Recuperado de http://www.sociedadyeducacion.org/site/wp-content/uploads/Informe.pdf. Journal for Educators, Teachers and Trainers JETT, Vol. 9 (1); ISSN: 1989-9572. 72.
(19)
Figure
Documento similar
