Aesthetic perception of photovoltaic integration within new proposals for ecological architecture
22
0
0
Texto completo
(2) 19. 1 INTRODUCTION. 20. Architecture, as a discipline, has undergone very significant changes in recent years. Apart from. 21. aesthetic factors or the innovative and challenging architectural designs frequently offered by the world’s. 22. most renowned architects, the construction of buildings has become an important field of research. 23. investigating ways to mitigate climate change. Terms such as bioclimatic design, sustainable. 24. construction, energy efficiency and environment-friendly or natural materials are associated with the. 25. latest advances in an architecture that strives to adapt increasingly better to a more sustainable global. 26. development.. 27. The literature contains studies which include environmental assessment as a means to help architects. 28. in their search for materials and construction solutions that guarantee the development of buildings that. 29. generate a lower environmental impact. The Life Cycle Assessment (LCA) methodology has been used. 30. in a number of studies as a tool that allows the calculation of environmental impacts and, therefore, the. 31. comparison of different aspects ranging from specific materials to whole buildings, including the entire. 32. construction process, the use phase and even the end of life of the building (Bastos et al., 2014; Buyle. 33. et al., 2013; Cabeza et al., 2014; Ghattas et al., 2013; Ortiz et al., 2009; Ramesh et al., 2010; Werner &. 34. Richter, 2007; Zabalza Bribián et al., 2009, 2011). Many studies have shown that the greatest. 35. environmental impacts are produced during the use phase of the building, as this is the one with the. 36. greatest energy consumption (Ghattas et al., 2013; Peuportier, 2001; Ramesh et al., 2010), mainly due. 37. to the use of heating and air conditioning, household appliances and lighting. It therefore follows that a. 38. significant part of the research conducted focuses on reducing the impacts during this phase.. 39. One possible way to lower the impact is to directly reduce the energy consumption of the building, which. 40. depends on a number of factors such as the construction solutions, the climatic conditions of the area. 41. where it is located and the type of installations the building is equipped with. A second way, however,. 42. consists in using renewable energy sources. This has led to a significant increase in the use of. 43. photovoltaic energy over the last 20 years, both in Spain and in Europe as a whole. Initially, this. 44. technology was implemented in the form of “solar farms” integrated within rural areas, which. 45. occasionally modified a landscape that had remained practically unaltered for years except for the. 46. introduction of extensive agriculture (Torres-Sibille et al., 2009). Yet, the requirements set out in. 47. increasingly more sustainable European and worldwide policies have gradually led to the presence of.
(3) 48. these facilities within the urban landscape, mainly in the form of systems for capturing solar power, which. 49. today generate a significant part of the European energy supply. The European Union has launched a. 50. plan to create an Energy Union to ensure a safe, affordable supply while also respecting the climate.. 51. The goals of this plan require that 20% of the energy must be obtained from renewable sources by 2020. 52. and 27% by 2030. The advances being made in this sense are considered to be positive, as the quota. 53. of renewable energy rose from 8.5% in 2005 to 14.1% in 2012, according to figures from the European. 54. Commission. The scope of these goals nevertheless requires an active commitment by both the. 55. industrial and the residential sectors as regards the use of renewable energies.. 56. In different European countries, the building regulations demand an increasingly significant application. 57. of this kind of installations, which are starting to become common features in the urban landscape. An. 58. example of this is the Technical Building Code in Spain (Gobierno de España, 2013), which requires the. 59. installation of photovoltaic systems in industrial buildings and thermal systems in those for residential. 60. use. Hence, energy efficiency improvement systems – especially those capturing solar power – are. 61. today considered just another element of buildings.. 62. A great deal of research has been conducted within the field of photovoltaic technology in recent. 63. decades, but its integration within urban environments has only been seen as an interesting proposition. 64. in the last 5-10 years. The earliest studies basically investigated the energy potential of the installations,. 65. focusing on the areas of the roofs of buildings and their capacity to house photovoltaic installations. The. 66. main aim of these studies was to optimise the installations from the point of view of energy efficiency.. 67. To do so, they analysed the different existing technologies and their suitability in different climates and. 68. urban settings. Examples of such work include the review conducted by Makrides and collaborators (G.. 69. Makrides et al., 2013; George Makrides et al., 2010, 2012; Vivar et al., 2014) or studies that analysed. 70. the conditions produced in shaded areas in the urban setting (D’Orazio et al., 2013; Loulas et al., 2012).. 71. One factor that is considered important in several studies is the repercussion of the economic cost of. 72. installing photovoltaic systems for the whole building. The recent work by Yang and Zou (Yang & Zou,. 73. 2016) is a good example of such research. It must be remembered, however, that the use of these. 74. systems in the building envelope falls within the field of architecture and hence not only the efficiency. 75. and cost of the installation are important but the aesthetic also plays a very important role. The. 76. acceptance of this new technology by citizens, as users of the city, is today a topic of growing interest.
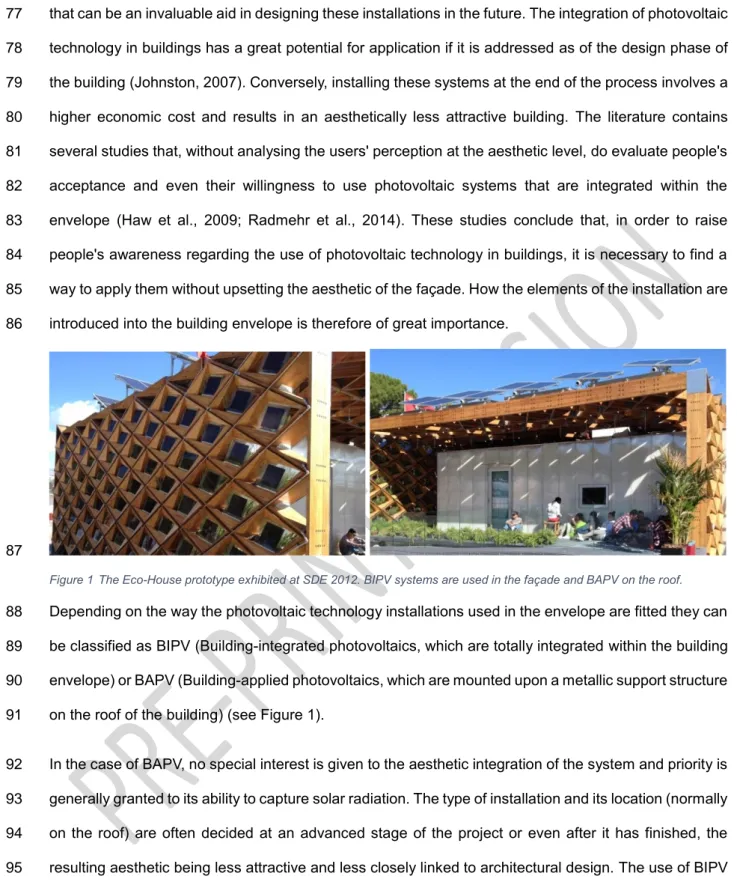
(4) 77. that can be an invaluable aid in designing these installations in the future. The integration of photovoltaic. 78. technology in buildings has a great potential for application if it is addressed as of the design phase of. 79. the building (Johnston, 2007). Conversely, installing these systems at the end of the process involves a. 80. higher economic cost and results in an aesthetically less attractive building. The literature contains. 81. several studies that, without analysing the users' perception at the aesthetic level, do evaluate people's. 82. acceptance and even their willingness to use photovoltaic systems that are integrated within the. 83. envelope (Haw et al., 2009; Radmehr et al., 2014). These studies conclude that, in order to raise. 84. people's awareness regarding the use of photovoltaic technology in buildings, it is necessary to find a. 85. way to apply them without upsetting the aesthetic of the façade. How the elements of the installation are. 86. introduced into the building envelope is therefore of great importance.. 87 Figure 1 The Eco-House prototype exhibited at SDE 2012. BIPV systems are used in the façade and BAPV on the roof.. 88. Depending on the way the photovoltaic technology installations used in the envelope are fitted they can. 89. be classified as BIPV (Building-integrated photovoltaics, which are totally integrated within the building. 90. envelope) or BAPV (Building-applied photovoltaics, which are mounted upon a metallic support structure. 91. on the roof of the building) (see Figure 1).. 92. In the case of BAPV, no special interest is given to the aesthetic integration of the system and priority is. 93. generally granted to its ability to capture solar radiation. The type of installation and its location (normally. 94. on the roof) are often decided at an advanced stage of the project or even after it has finished, the. 95. resulting aesthetic being less attractive and less closely linked to architectural design. The use of BIPV. 96. technology, in contrast, requires technical planners to consider the installation from the initial phase of. 97. the design of the building in order to achieve a good aesthetic integration within the building as whole.. 98. The use of this technology is becoming more popular as the wide range of possibilities for integrating it. 99. become known to architects and builders (Henemann, 2008) and some researcher-architects are. 100. devoting part of their work to exhibiting the state-of-the-art of BIPV products (Cerón et al., 2013). As.
(5) 101. some authors conclude (Athienitis & Candanedo, 2010; Michael et al., 2010), if special innovative. 102. designs are used, in some cases such integration could require a higher initial economic investment,. 103. but other studies confirm the long-term economic advantages of using BIPV systems (Portolan dos. 104. Santos & Rüther, 2012). The development of this type of photovoltaic systems and their capacity for. 105. integration within architecture is an ongoing field of research, both for the scientific community and for. 106. the photovoltaic industrial sector.. 107. But what perception does the user have of the presence of these installations in his or her surroundings?. 108. How can the industrial sector know whether its products are being accepted or not? Studies that take. 109. into account the users' opinion in order to be able to evaluate the perception and their visual impact in. 110. the city are lacking. Some more recent research that includes aspects related to image, perception of. 111. the city or the immediate surroundings and take citizens into account (Guarachi Flores et al., 2016;. 112. Strazzera & Statzu, 2017) also fail to offer any data with which to evaluate people’s opinion regarding. 113. the presence of these new technologies.. 114. Collecting the opinions expressed by citizens and being able to consider them valuable research data. 115. would require having access to a varied sample of photovoltaic systems, installed in different types of. 116. buildings, so that they could be observed and evaluated by a significant sample of persons in an. 117. anonymous manner. Although this appears somewhat impractical, these characteristics can be found at. 118. a world-famous event that puts society in direct contact with the latest advances in photovoltaic. 119. technology for residential buildings. This event is the Solar Decathlon (SD), which was held for the first. 120. time in 2002 in the USA and has gone on to become, since the second edition in 2005, an important. 121. biannual contest for universities. The first European version of the competition (Solar Decathlon Europe,. 122. SDE) took place in Madrid in 2010 and was repeated in the same city in 2012 before moving to Versailles. 123. (Paris) for the 2014 exhibition. Each edition of this contest is an interesting showcase of the latest. 124. initiatives in the field of photovoltaics (Cronemberger et al., 2014).. 125. This research is based on the projects presented at Solar Decathlon Europe 2014 (SDE 2014) (Figure. 126. 2), where 20 prototypes of solar-powered dwellings were submitted over a period of two weeks to 10. 127. appraisals in order to evaluate aspects such as architecture, energy efficiency, sustainability, comfort. 128. conditions and innovation. In line with the European commitment to meet the 20/20/20 challenge, two. 129. main objectives were established for the SDE competitions: 1) to promote innovation and knowledge.
(6) 130. generation in order to improve the energy efficiency and sustainability of buildings and towns, as well. 131. as the integration of renewable energies, by transferring knowledge to the industrial domain, and 2) to. 132. make use of all types of media to raise society's awareness regarding the importance of using energy. 133. in a responsible way and of building together a more sustainable world (Vega Sánchez & Rodriguez. 134. Ubiñas, 2014).. 135 Figure 2 The Cité du Soleil, the venue where the Solar Decathlon Europe 2014 was held in Versailles, Paris. Image obtained from the official website: www.solardecathlon2014.fr/en. 136. The SDE is an event that is open to all, and the most common visitor profile is that of a young person. 137. with a university education who is well aware of the need to respect the environment. While the event is. 138. being held, the public can visit the inside of the prototypes and receive all kinds of information about. 139. them and about the way they work.. 140. The aim of this study is to provide data that reflect what citizens feel when they see these “new. 141. installations”, which would be part of the urban landscape seen on a day-to-day basis. This information. 142. is of great interest and will enable researchers to continue to work to improve future applications. To this. 143. end, the aesthetic perception was analysed for the two types of photovoltaic installations that can be. 144. found in buildings, namely, BIPV and BAPV.. 145. Since the use of these elements in the façade or the roofing of our buildings has a notable effect on their. 146. aesthetic, this study aims to identify society’s acceptance or non-acceptance of this technology. There. 147. is widespread agreement on the fact that the application of photovoltaic technology changes the. 148. appearance of the urban landscape and this change may be positive or negative (Strazzera & Statzu,. 149. 2017). While some see it as an opportunity to modernise the city, others – especially in historic districts. 150. – are more critical about these aesthetic modifications.. 151. Due to formal and design reasons, there are expected to be differences in the evaluation of the visual. 152. impressions caused by (fully integrated) BIPV and (superposed) BAPV technologies. This research.
(7) 153. therefore includes an analysis of the differences in the way the two types of technology are perceived. 154. by citizens. By so doing it will be possible to evaluate whether, in terms of the final aesthetic effect. 155. achieved, there is any justification for technicians to pay greater attention during the design phase to. 156. the use and development of BIPV rather than BAPV systems, given the higher rating for the aesthetic. 157. perception of the former.. 158. 2 METHOD. 159. 2.1 Validity of the data and limitations. 160. Data were collected by means of two surveys: (a) one with the prototypes that included BIPV technology. 161. in the envelope, and (b) one with the prototypes that used BAPV systems. Because the exhibition was. 162. open to the public for two weeks and more time was needed to obtain a significant sample, some of the. 163. surveys were carried out “on the spot” with the intention of later using photographs to compare and. 164. validate the results obtained after the event finished. The data analysis could therefore be performed. 165. using data from three experimental samples: (1) the surveys conducted in situ (BIPV-Versailles), used. 166. as a reference; (2) those carried out by means of pictures of integrated systems (BIPV-images); and (3). 167. those carried out by means of pictures of superposed systems (BAPV-images).. 168. Firstly, the data obtained with samples 1 and 2 were analysed to check for the existence of any. 169. similarities between them that made it possible to justify the ecological validity of the data obtained by. 170. evaluating images. Secondly, the acceptance of the prototypes was assessed by analysing the. 171. respondents’ positive (pleasant) or negative (unpleasant) aesthetic perception and the degree of. 172. emotional activation (arousal). Finally, the results obtained for the prototypes with BIPV and BAPV. 173. technology were compared, and an analysis was also performed to determine the possible influence of. 174. sociodemographic variables on their aesthetic perception.. 175. Inevitably, the assessment of PV integration is, in a way, influenced by the architectural design. It must. 176. nevertheless be borne in mind that the housing design phase is a global process in which the aesthetic. 177. of the building affects the design of the PV system and vice versa. It would thus be incorrect to assess. 178. different kinds of PV systems for the same building. In order to avoid the architectural influence, 20 solar. 179. housing prototypes with diverse types of PV installations were selected and used to compare the. 180. different outcomes offered by each of them..
(8) 181. The structure of the surveys was the same for the different samples that participated in the study, and. 182. consisted of a first part aimed at obtaining generic descriptive data and a second part that collected data. 183. referring to the respondents' feelings when they were shown pictures of the prototypes.. 184. In order to reach a greater number of people, the surveys were conducted in pen and paper format but. 185. also via the Internet (using e-mail). In this regard, some studies (Roth, 2006) suggest that online surveys. 186. are appropriate and provide acceptable values regarding objectivity, reliability and the possibility of. 187. generalising the data.. 188. 2.2 Generic descriptive statistics. 189. A profile of the sample was obtained using personal data such as age, gender, level of education,. 190. relationship between their qualifications and the field of architecture (to anticipate possible differences. 191. in the aesthetic perception of this group), their concern for the environment and the type of setting they. 192. live in. Table 1 summarises the values used in the study to define the levels of each of these variables. CONNECTED WITH ARCHITECTURE. ENVIRONMENTAL CONCERN. HOUSING. VALUE. AGE. GENDER. LEVEL OF EDUCATION. 1. between 16 and 25. man. None. No. None. Big city. 2. between 26 and 40. woman. Yes. Little. 3. between 41 and 55. Primary School Secondary school. Small city/town Semi-rural & rural area. 4. between 56 and 70. University. 5. more than 70. Quite high High. Table 1 Parameters used for the descriptive study of the samples.. 193. 2.3 Prototypes. 194. A total of 22 prototypes were on show at the SDE 2014 exhibition: 20 of them were official participants. 195. in the contest and two were only on display. The surveys evaluated all the prototypes except two. “Casa. 196. Fénix” was excluded from the statistical analysis because some of the answers were missing from the. 197. surveys, which gave rise to an incorrect discrimination of the data with respect to the other prototypes.. 198. The prototype “Efden” was also excluded because its promoters failed to complete the construction of. 199. its envelope and it was therefore not considered suitable as a model for measuring the aesthetic. 200. perception of the system. Although they did not enter the SDE appraisals as competitors, both. 201. “éBRICKhouse” and “Membrain” were included as they were part of the exhibition of prototypes that the. 202. public were able to visit..
(9) 203 Figure 3 Prototypes from the Solar Decathlon Europe 2014 exhibition that were evaluated in the surveys, with the characteristics of their corresponding installations: (a) type of technology, (b) installed capacity (peak kW), (c) location of the panels (façade [F], roof [R] or both [F+R]), and (d) type of application..
(10) 204. Altogether the assessment took into account the 20 prototypes shown in Figure 3, half of which. 205. employed BIPV technology, while the other half used BAPV. The figure shows the following information. 206. for each prototype: (a) the type of technology (crystalline silicon [c-SI] or thin film [TFSC]), (b) installed. 207. capacity (peak kW), (c) the location of the panels (façade [F], roof [R] or both [F+R]), and (d) the type of. 208. application (BIPV or BAPV).. 209. 2.4 Evaluation of the aesthetic perception. 210 Figure 4 Example of the survey using the SAM method to score the parameters Valence and Arousal.. 211. The subjective estimations of the emotions triggered by the prototypes (in the dimensions pleasant-. 212. unpleasant and emotional activation) were obtained using the Self-Assessment Manikin (SAM). 213. (Margaret M. Bradley & Lang, 1994; Grimm & Kroschel, 2005). SAM is a non-verbal instrument that. 214. includes a pictorial scale for assessing emotional reactions when faced with different types of stimuli,. 215. which makes it easier to carry out the survey in a multicultural setting such as the SDE, while at the.
(11) 216. same time avoiding possible mistakes due to misinterpretation resulting from changes of language. Only. 217. two dimensions were used for the affective assessment: hedonic valence (pleasant-unpleasant) and. 218. arousal (level of excitation). Dominance was not considered as a dimension because a pilot study. 219. showed it to be difficult to interpret. In fact, previous research suggests that hedonic valence and. 220. emotional arousal are the most important dimensions as regards connotative meaning and feelings (M. 221. M Bradley, Codispoti, Sabatinelli, & Lang, 2001a) (Mehrabian & Russell, 1974) and another study also. 222. used them to assess the aesthetic impact of buildings (Gifford, 2000).. 223. In our study, each dimension of the SAM was represented using a scale of 1-7 points, as shown in. 224. Figure 4. Participants were asked to mark the figure whose expression best matched their own feelings. 225. when they saw each prototype.. 226. 3 RESULTS AND DISCUSSION. 227. 3.1 Participants and characterisation of the sample. 228. The sizes of the three samples considered in this study are appropriate with a confidence level of 95%. 229. and a margin of error of 5%. Sample 1, which was produced on onsite (BIPV-Versailles), consists of a. 230. total of 87 surveys in which 10 prototypes were evaluated, resulting in 870 ratings. Sample 2, which was. 231. produced by means of images of prototypes with integrated systems (BIPV-images), consists of a total. 232. of 253 surveys, resulting in 2529 ratings. And sample 3, which was produced by means of images of. 233. prototypes of superposed systems (BAPV-images), consists of 165 surveys that also evaluated 10. 234. prototypes, resulting in 1650 ratings. The total number of ratings included in the study was 5049. In all. 235. the surveys pictures were shown to identify the prototypes to be evaluated, but the respondents in. 236. Versailles were able to see the prototypes in situ, whereas the others could only see an image of each. 237. one.. 238. The samples were characterised by performing a detailed analysis of the profile of the participants in. 239. each of them, taking into account the values used for the different parameters defined in Error! No s'ha. 240. trobat l'origen de la referència.. In the surveys carried out with images, the samples are representative. 241. of all the age groups, but in the case of the surveys in Versailles the mean age was below 30, as the. 242. majority of visitors who attend the SDE are university students. The numbers of males and females in. 243. all the samples were quite balanced. Moreover, the number of participants with training related to.
(12) 244. architecture was low, around 10%, and thus future studies could extend the sample to include more. 245. representatives of this group. Concern for the environment was rated as “3- Quite high” or “4- High” by. 246. almost all the respondents and, in the majority of cases, the place of residence was predominantly a. 247. small town for the surveys carried out in Spain, but also large cities for many of the respondents in. 248. Versailles.. 249. Table 2 shows the mean values (and the standard deviation) of the sociodemographic variables that. 250. were most representative of the profile of those who answered the survey, together with the number of. 251. people who took part in each sample, the total number of surveys being 505. In the case of the variable. 252. “relationship between the respondent's studies and the field of architecture”, the value is given as the. 253. number and percentage of respondents with this relationship, since it is a dichotomous variable. BIPV-Versailles (onsite). BAPV (photos). TOTAL (87P.). MEN (50p.). WOMEN (37p.). TOTAL (253P.). MEN (121p.). WOMEN (132p.). TOTAL (165P.). MEN (88p.). WOMEN (77p.). 1.41. 1.42. 1.41. 2.61. 2.49. 2.72. 2.73. 2.60. 2.88. (0.782). (0.778). (0.788). (1.255). (1.194). (1.299). (1.256). (1.193). (1.310). 3.76. 3.78. 3.73. 3.65. 3.74. 3.56. 3.70. 3.74. 3.65. (0.570). (0.581). (0.553). (0.699). (0.597). (0.772). (0.637). (0.631). (0.640). n. 9. 4. 5. 24. 18. 6. 23. 19. 4. %. 10.5%. 4.7%. 5.8%. 9.5%. 7.1%. 2.4%. 13.9%. 11.5%. 2,4%. 3.2. 3.16. 3.24. 3.19. 3.19. 3.19. 3.19. 3.17. 3.21. (0.760). (0.739). (0.786). (0.612). (0.684). (0.538). (0.571). (0.611). (0.521). 1.68. 1.66. 1.7. 2.03. 2.04. 2.02. 2.07. 2.08. 2.05. (0.766). (0.739). (0.802). (0.547). (0.581). (0.514). (0.457). (0.508). (0.392). Age. Level of studies Are architects. BIPV-Spain (photos). Environment. Residence. Table 2 Mean (and standard deviation) of the sociodemographic variables requested in the survey.. 254. 3.2 Comparison BIPV-Versailles vs. BIPV-Spain. 255. A comparison of the data obtained in the presence of the prototypes and those obtained later by means. 256. of photographs shows the ecological (or statistical) validity of the results (Table 3). This is of great. 257. interest for a case study like SDE 2014, a single one-off event where the exhibition has a limited duration. 258. of two weeks. It cannot be said that the perception is identical for the two samples, since the statistically. 259. significant result of the t test (0.001 level) concludes that there is no equality of means. The Levene test,. 260. however, assumes equality of variances for both hedonic valence and arousal.. 261. Table 3 shows that a slightly higher value is obtained for valence using photographs, but the. 262. respondent's activation or excitation is greater in the presence of the prototype. These results are to be.
(13) 263. expected if it is borne in mind that there are a number of factors that influence the process, such as the. 264. aesthetic quality of the photograph, which may be showing a better perspective of the prototype in. 265. optimal climatic conditions. In contrast, those who visited the SDE have seen all the façades of the. 266. building and the weather conditions were those prevailing in that moment. Exposure time is also. 267. different: whereas the photos are shown for approximately half a minute, visitors at the SDE spend. 268. several minutes looking at each building. Another factor which may be influencing the visitors' rating at. 269. the SDE is the fact that they know how the installations work and are used; this information is not. 270. available to the participants who rated the aesthetic perception by means of pictures. BIPV-Versailles (onsite). Valence. Arousal. BIPV-Spain (photos). TOTAL (87P.). MEN (50p.). WOMEN (37p.). TOTAL (253P.). MEN (121p.). WOMEN (132p.). 4.57. 4.51. 4.64. 4.81. 4.75. 4.86. (1.616). (1.520). (1.735). (1.674). (1.621). (1.720). 4.32. 4.34. 4.28. 3.91. 3.94. 3.88. (1.696). (1.644). (1.764). (1.705). (1.671). (1.735). test. Valence. Arousal. sig.. variances (Levene) .207 means (t test). .000. variances (Levene) .966 means (t test). .000. 271. Table 3 Mean (and standard deviation) of the perception variables hedonic valence and arousal for samples 1 and 2. Comparison of means for the two independent samples (Levene and t test).. 272. Yet, despite the fact that the results of the t test and these factors could cause certain imbalances in. 273. perception, the statistical validity of the data can be considered as acceptable because, within the scale. 274. from 1 to 7 that was used, similar values for perception are always found. It can therefore be said that. 275. the results obtained by means of photographs are valid for predicting whether the installation is seen as. 276. pleasant or not and whether the observer finds it stimulating or not.. 277. As there was a notable difference of age between samples 1 and 2, the validity of these conclusions. 278. was tested by considering the same age bracket for both samples, a similar result being obtained.. 279.
(14) Figure 5 The prototype Rhome for DenCity from SDE 2014.. 280. Of the 10 prototypes with BIPV technology considered in the survey, it should be noted that the best. 281. rated, in terms of hedonic valence, in sample 1 (BIPV-Versailles) is also the prototype that obtained the. 282. best classification in the architecture appraisal, Rhome for DenCity (Figure 5). As can be seen in Figure. 283. 7, however, this prototype was rated second from last in sample 2 (BIPV-images).. 284. As regards the degree of excitation, the prototype Rhome for DenCity had the second greatest impact,. 285. behind Techstyle House, in sample 1 (BIPV-Versailles). As in the case of hedonic valence, however, in. 286. Figure 8 it can be seen that it was rated last but one in terms of impact in sample 2 (BIPV-images), only. 287. slightly better than the prototype Orchid House.. 288 Figure 6 The prototype Orchid House from SDE 2014.. 289. In spite of the differences that may exist between the subjective ratings of the different prototypes, Orchid. 290. House stands out as a special case (Figure 6). This prototype was seen as less pleasant and as having. 291. less impact in both samples (1 and 2).. 292. 3.3 Overall rating of hedonic valence and arousal 7 6 5 4. 3.87. 4.22 4.27. 5.09 5.26 5.31 4.66 4.81 4.81. 5.78 5.78. 5.07 4.97 4.96. 4.46 4.42 4.21 3.55 3.21. 3. 2 1. 293. BIPV. BAPV. 2.76.
(15) Figure 7 Mean values of hedonic valence for each prototype (rating with photographs).. 294. After testing the statistical validity of the results obtained by means of photographs, samples 2 (BIPV-. 295. images) and 3 (BAPV-images) were considered for the analysis of the aesthetic perception of the. 296. prototypes. Evaluation data collected in situ were therefore discarded.. 297. As regards hedonic valence, the mean value of the scale (4) would represent the threshold indicating. 298. whether a prototype is liked (>4) or not (<4). Hence, on looking at Figure 7, with the BIPV prototypes on. 299. the left and the BAPV prototypes on the right, it can be said that in general terms the rating is positive,. 300. since only 20% of the prototypes were given a score below 4.. 301. With regard to arousal, the minimum value (1) represents the absence of activation on viewing the image. 302. (indifference). As can be seen in Figure 8, which also shows the BIPV prototypes on the left and the. 303. BAPV on the right, values between 3 and 5 were obtained for all the cases, thereby reflecting a medium. 304. degree of excitation. 7 6. 4.94. 5 4 3. 3.13. 3.5. 3.67 3.81 3.66 3.85. 3.81. 4.57 4.17. 4.64 4.17. 3.67. 4.22 4.07. 3.67. 3.15. 3.27 3.53 3.11. 2 1. 305. BIPV. BAPV. Figure 8 Mean values of arousal for each prototype (rating with photographs).. 306. These results were to be expected and somehow agree with the findings from other research conducted. 307. on the affective evaluation of standardised images, such as the International Affective Picture System. 308. (IAPS) (Lang, P.J., Bradley, M.M., & Cuthbert, 1997) (Moltó et al., 2013), since pictures of houses, which. 309. can initially be considered “neutral”, involve a rather low level of activation, that is to say “calm”.. 310. Furthermore, it can be observed how there is quite a lot of variation in the subjective ratings in the. 311. dimension arousal for the images that were found to be more pleasant (>5), thereby also confirming that. 312. affective valence is independent of the level of arousal..
(16) 313. 3.4 Comparison BIPV vs. BAPV. 314. As shown in Figure 7, where the BIPV prototypes have clearly better scores than the BAPV installations,. 315. the total mean values for affective valence and arousal are higher for sample 2 than for sample 3. These. 316. data can be seen in Table 4, where the rating of the prototypes is generally positive with a medium-low. 317. degree of excitation for both samples. BIPV-Spain (photos). Valence. Arousal. BAPV (photos). TOTAL (253P.). MEN (121p.). WOMEN (132p.). TOTAL (165P.). MEN (88p.). WOMEN (77p.). 4.81. 4.75. 4.86. 4.34. 4.40. 4.26. (1.674). (1.621). (1.720). (1.730). (1.598). (1.868). 3.91. 3.94. 3.88. 3.75. 3.75. 3.75. (1.705). (1.671). (1.735). (1.748). (1.663). (1.841). Table 4 Mean (and standard deviation) of the affective evaluations of hedonic valence and arousal for samples 2 and 3.. 318. The results of the t test summarised in Table 5 show that the equality of means between the two samples. 319. is not assumed for either of the two variables studied. That is to say, there are significant differences in. 320. the rating that offset the increased amount of work required to develop BIPV technology, as well as the. 321. initial economic investment needed to install it. If the integration of photovoltaic technology is not taken. 322. into consideration from the construction design phase, the result is an aesthetically less attractive. 323. building (Johnston, 2007). Even though BIPV technology is generally perceived as being expensive or. 324. even as having a prohibitive price (Yang & Zou, 2016), this does not appear to have a negative influence. 325. on aesthetic perception. The respondent presumably also perceives that an economic investment has. 326. to be made in the case of BAPV technology, and therefore economic cost is not an especially significant. 327. factor in this study. Independent samples test Levene test and equality of variances. F. Pleasant/ Equal unpleasant variances are (valence) assumed Equal variances are not assumed Degree of Equal excitation variances are (arousal) assumed Equal variances are not assumed. Sig.. t test for equality of means. t. df. Sig. (bilateral). Means difference. Standard error difference. 95% conf. interval of the difference Inferior Superior. .000 3.057. 4.324. .080. .038. -8.741. 4177. -.469. .054. -.574. -.364. -8.680 3441.043. .000. -.469. .054. -.575. -.363. -2.958. 4177. .003. -.161. .054. -.268. -.054. -2.942 3461.735. .003. -.161. .055. -.269. -.054. Table 5 Results of the Levene and Student’s t tests for the independent samples BIPV and BAPV..
(17) 328. However, it should be remembered that the rating is quite similar for the two technologies and this. 329. difference could therefore be reduced if the respondent perceives the technological development and. 330. economic investment required for the installation of the BIPV system to be very high. There are factors. 331. that limit the applicability of these systems in different countries, such as energy and economic policies. 332. or the geographical and climatologic conditions (Radmehr et al., 2014).. 333. As regards the influence of the sociodemographic parameters on aesthetic perception, Table 6 shows. 334. the tests that were conducted and the results obtained in each of them. The only parameter found to. 335. have a clear influence on both variables is age. For both BIPV and BAPV technology, the younger the. 336. respondent is, the higher the degree of activation he or she experiences. Also in the case of hedonic. 337. valence, in the prototypes with BAPV technology the younger the respondent is, the higher the values. 338. are. This indicates that, generally speaking, older people are less impressed and are less willing to. 339. accept the industrial aesthetics offered by BAPV solutions. These results are in line with those of several. 340. studies that also use the SAM to evaluate affective images from the IAPS. In those studies, the results. 341. show a greater intensity of affect on the part of the younger group, but also greater emotional control. 342. and higher levels of positive affect for the older group (Backs et al., 2005). Moreover, in the case of the. 343. pleasant images, the older group experiences a lower degree of excitation than the members of the. 344. younger group (Grühn & Scheibe, 2008).. 345. The degree of concern for the environment was found to be high for most of the respondents. The results. 346. on the use of BIPV technology indicate that people with greater environmental awareness rated the. 347. prototypes with higher scores on both affective valence and activation.. 348. Although some differences are observed in Table 3 and Table 4, the results of the statistical analyses. 349. suggest that gender does not have any substantial influence on the participants' aesthetic perception.. 350. These findings coincide with those of another study (M M Bradley, Codispoti, Sabatinelli, & Lang,. 351. 2001b), in which it was found that women tend to give more extreme scores on the hedonic valence. 352. dimension (especially in the case of unpleasant images), whereas the affective reactions to normal life. 353. events (whether pleasant or unpleasant) are quite similar for men and women.. 354. Finally, the respondents' relationship with architecture and their place of residence showed a certain. 355. influence on the evaluation of aesthetic perception, but the sample is not sufficiently representative to. 356. be able to consider these results as conclusive. However, regarding the architects, results agree with.
(18) 357. the conclusions of other research which concludes that the assessment by architects and non-architects. 358. is different (Gifford, 2000). BIPV: Variable. Test. Sig. Results Valence. Gender. t Arousal. Age. ANOVA. Level of education. ANOVA. Architects?. Place of residence. ANOVA. BAPV: Variable. Valence. .144 YES equality of means. Arousal. .124 YES equality of means. Level of education. ANOVA. Valence. .873 YES equality of means. Arousal. .192 YES equality of means. Results. Place of residence. ANOVA. .106 YES equality of means .000 NO equality of variances. The variable Level of education does not influence perception. Whether or not the respondents have some relationship with architecture DOES INFLUENCE AESTHETIC PERCEPTION. In both variables, those who have some relationship with architecture score higher. The degree of concern for the environment DOES INFLUENCE AESTHETIC PERCEPTION for both variables. The place of residence does not influence perception.. Conclusion The variable Gender does not influence perception.. .973 YES equality of means .000 NO equality of means. Arousal. .000 NO equality of means. Valence. .000 NO equality of means. Arousal. .000 NO equality of means. t. The variable AGE DOES INFLUENCE THE LEVEL OF AROUSAL, but not the valence. Older people are less impressed.. .000 NO equality of variances. Valence. Arousal Concern for the environment. .007 NO equality of means. .002 NO equality of means. Valence Architects?. .683 YES equality of variances. Arousal. Arousal. ANOVA. .000 NO equality of means. .000 NO equality of means. t. Age. .001 NO equality of variances. Valence. Test. The variable Gender does not influence perception.. .367 YES equality of means. .000 NO equality of means. Valence Gender. .029 NO equality of variances. Arousal. Arousal. ANOVA. .119 YES equality of means. .140 YES equality of means. t. Concern for the environment. .016 NO equality of variances. Valence. Valence. Conclusion. .000 NO equality of variances .136 YES equality of means .000 NO equality of variances .047 NO equality of means. Valence. .205 YES equality of means. Arousal. .603 YES equality of means. Valence. .007 NO equality of means. Arousal. .000 NO equality of means. ANOVA. AGE DOES INFLUENCE AESTHETIC PERCEPTION. Both in valence and in arousal, the younger the respondents are, the higher they score the two variables. This variable appears to influence aesthetic perception, but this result is a consequence of the fact that practically all those with a secondary education belong to the group of those aged over 56, who, as we have already seen, give lower scores. Whether or not respondents have some relationship with architecture DOES INFLUENCE THE LEVEL OF EMOTIONAL AROUSAL, but not hedonic valence. Architects give higher scores in activation. The degree of concern for the environment does not influence aesthetic perception. There is a certain relationship between the highest scores and participants who live in big cities, but the participation by members of this group is very low.. Table 6 Tests conducted to analyse the influence of the sociodemographic parameters on perception..
(19) 359. 4 CONCLUSIONS. 360. Despite the differences in aesthetic between the two systems, the prototypes were generally given a. 361. positive rating, with scores above 4 for 80% of all the prototypes evaluated. It can therefore be deduced. 362. that the presence of these new technologies in the envelope of buildings is well accepted by users. The. 363. level of activation (arousal or emotional intensity) triggered by the prototypes was not especially notable,. 364. as the mean values always ranged between 3 and 5 on a scale of 1 (indifference) to 7 (excitement).. 365. Nevertheless, from a comparison of the results obtained for the two types of photovoltaic systems it can. 366. be concluded that there are relevant differences in how they are perceived (error range of 5%). BIPV. 367. technology, which requires greater attention in the design and a higher initial economic investment, also. 368. enjoys greater aesthetic acceptance by respondents with higher values for both hedonic valence and. 369. level of emotional intensity. The range of scores, however, was not very wide and this is the reason why. 370. the differences between the two systems were not very pronounced. As a result, an excessively high. 371. cost or an important technological difficulty could be significant factors that, in some cases, lead to a. 372. BAPV system being chosen rather than a BIPV installation.. 373. Lastly, the analysis of the sociodemographic factors that could affect aesthetic perception show that age. 374. is a factor that clearly influences the rating. The younger group generally gave higher scores on. 375. emotional intensity. With regard to hedonic valence, the younger the age of the respondent is, the better. 376. the acceptance of BAPV technology is, which is the one that gives the prototypes a more “industrial”. 377. appearance. Consequently, it can be understood that older people are the ones who penalise to a. 378. greater extent the lack of a careful integration of the system within the building envelope.. 379. This research did not receive any specific grant from funding agencies in the public, commercial or not-. 380. for-profit sectors.. 381. REFERENCES. 382 383. Athienitis, A. K., & Candanedo, J. A. (2010). Building integration of photovoltaic systems in cold climates (Vol. 7750). http://doi.org/10.1117/12.870968. 384 385 386. Backs, R. W., da Silva, S. P., & Han, K. (2005). A Comparison of Younger and Older Adults’ Self-Assessment Manikin Ratings of Affective Pictures. Experimental Aging Research, 31(4), 421–440. http://doi.org/10.1080/03610730500206808. 387 388. Bastos, J., Batterman, S. A., & Freire, F. (2014). Life-cycle energy and greenhouse gas analysis of three building types in a residential area in Lisbon. Energy and Buildings, 69, 344–353..
(20) 389 390 391. Bradley, M. M., Codispoti, M., Sabatinelli, D., & Lang, P. J. (2001a). Emotion and motivation I: defensive and appetitive reactions in picture processing. Emotion (Washington, D.C.), 1(3), 300–319. http://doi.org/10.1037/1528-3542.1.3.276. 392 393. Bradley, M. M., Codispoti, M., Sabatinelli, D., & Lang, P. J. (2001b). Emotion and motivation II: sex differences in picture processing. Emotion (Washington, D.C.), 1(3), 300–319. http://doi.org/10.1037/1528-3542.1.3.300. 394 395 396. Bradley, M. M., & Lang, P. J. (1994). Measuring emotion: The self-assessment manikin and the semantic differential. Journal of Behavior Therapy and Experimental Psychiatry, 25(1), 49–59. http://doi.org/10.1016/0005-7916(94)90063-9. 397 398. Buyle, M., Braet, J., & Audenaert, A. (2013). Life cycle assessment in the construction sector: A review. Renewable and Sustainable Energy Reviews, 26, 379–388.. 399 400 401. Cabeza, L. F., Rincón, L., Vilariño, V., Pérez, G., & Castell, A. (2014). Life cycle assessment (LCA) and life cycle energy analysis (LCEA) of buildings and the building sector: A review. Renewable and Sustainable Energy Reviews, 29, 394–416.. 402 403. Cerón, I., Caamaño-Martín, E., & Neila, F. J. (2013). “State-of-the-art” of building integrated photovoltaic products. Renewable Energy, 58, 127–133. http://doi.org/10.1016/j.renene.2013.02.013. 404 405 406. Cronemberger, J., Corpas, M. A., Cerón, I., Caamaño-Martín, E., & Sánchez, S. V. (2014). BIPV technology application: Highlighting advances, tendencies and solutions through Solar Decathlon Europe houses. Energy and Buildings, 83, 44–56. http://doi.org/10.1016/j.enbuild.2014.03.079. 407 408 409. D’Orazio, M., Di Perna, C., & Di Giuseppe, E. (2013). Performance assessment of different roof integrated photovoltaic modules under Mediterranean Climate. Energy Procedia, 42, 183–192. http://doi.org/10.1016/j.egypro.2013.11.018. 410 411. Ghattas, R., Gregory, J., Olivetti, E., & Greene, S. (2013). Life Cycle Assessment for Residential Buildings : A Literature Review and Gap Analysis, 1–21.. 412 413. Gifford, R. (2000). DECODING MODERN ARCHITECTURE A Lens Model Approach for Understanding the Aesthetic Differences of Architects and Laypersons. ENVIRONMENT AND BEHAVIOR, 32(2), 163–187.. 414 415. Gobierno de España. (2013). Documento básico HE ahorro de energía. Código Técnico de La Edificación, Documento Básico HE Ahorro de Energía, 2013, 1–70.. 416 417 418. Grimm, M., & Kroschel, K. (2005). EVALUATION OF NATURAL EMOTIONS USING SELF ASSESSMENT MANIKINS Michael Grimm, Kristian Kroschel Institut für Nachrichtentechnik Universität Karlsruhe (TH), Germany. Institut Für Nachrichtentechnik, 381–385. http://doi.org/10.1109/ASRU.2005.1566530. 419 420 421. Grühn, D., & Scheibe, S. (2008). Age-related differences in valence and arousal ratings of pictures from the International Affective Picture System (IAPS): Do ratings become more extreme with age? Behavior Research Methods, 40(2), 512–521. http://doi.org/10.3758/BRM.40.2.512. 422 423. Guarachi Flores, J., García, R., & Jofré, J. (2016). Integración arquitectónica de la fachada fotovoltaica. Potencial solar y percepción de usuario en la vivienda colectiva. Arquitectura Y Urbanismo, XXXVII(2), 33–48.. 424 425 426. Haw, L. C., Sopian, K., Sulaiman, Y., Hafidz, M., & Yahya, M. (2009). Assessment of public perception on Photovoltaic application in Malaysia urban residential areas using Trudgill’s framework for analysis, 8(4), 589–603.. 427 428. Henemann, A. (2008). BIPV: Built-in solar energy. Renewable Energy Focus, 9(6 SUPPL.), 14,16-19. http://doi.org/10.1016/S1471-0846(08)70179-3. 429 430. Johnston, D. (2007). Solar energy systems installed on Chinese-style buildings. Energy and Buildings, 39(4), 385– 392. http://doi.org/10.1016/j.enbuild.2006.08.005. 431. Lang, P.J., Bradley, M.M., & Cuthbert, B. N. (1997). International Affective Picture System (IAPS): Technical Manual.
(21) 432. and Affective Ratings. NIMH Center for the Study of Emotion and Attention, 39–58.. 433 434 435. Loulas, N. M., Karteris, M. M., Pilavachi, P. A., & Papadopoulos, A. M. (2012). Photovoltaics in urban environment: A case study for typical apartment buildings in Greece. Renewable Energy, 48, 453–463. http://doi.org/10.1016/j.renene.2012.06.009. 436 437 438. Makrides, G., Zinsser, B., Norton, M., Georghiou, G. E., Schubert, M., & Werner, J. H. (2010). Potential of photovoltaic systems in countries with high solar irradiation. Renewable and Sustainable Energy Reviews, 14(2), 754–762. http://doi.org/10.1016/j.rser.2009.07.021. 439 440 441. Makrides, G., Zinsser, B., Phinikarides, A., Schubert, M., & Georghiou, G. E. (2012). Temperature and thermal annealing effects on different photovoltaic technologies. Renewable Energy, 43, 407–417. http://doi.org/10.1016/j.renene.2011.11.046. 442 443 444. Makrides, G., Zinsser, B., Schubert, M., & Georghiou, G. E. (2013). Seasonal performance comparison of different photovoltaic technologies installed in Cyprus and Germany. International Journal of Sustainable Energy, 32(5), 466–488. http://doi.org/10.1080/14786451.2012.759572. 445 446. Mehrabian, A., & Russell, J. A. (1974). An approach to environmental psychology. Cambridge Mass The MIT Press (Vol. 315).. 447 448 449 450. Michael, A., Bougiatioti, F., & Oikonomou, A. (2010). Less could be more: architectural integration of active solar systems in existing urban centres. In 7th Mediterranean Conference and Exhibition on Power Generation, Transmission, Distribution and Energy Conversion (MedPower 2010) (Vol. 2010, pp. 189–189). IET. http://doi.org/10.1049/cp.2010.0917. 451 452 453. Moltó, J., Segarra, P., López, R., Esteller, À., Fonfría, A., Pastor, M. C., & Poy, R. (2013). Adaptación española del “International Affective Picture System” (IAPS). Tercera parte. Anales de Psicologia, 29(3), 965–984. http://doi.org/10.6018/analesps.29.3.153591. 454 455. Ortiz, O., Bonnet, C., Bruno, J. C., & Castells, F. (2009). Sustainability based on LCM of residential dwellings: A case study in Catalonia, Spain. Building and Environment, 44(3), 584–594.. 456 457. Peuportier, B. L. . (2001). Life cycle assessment applied to the comparative evaluation of single family houses in the French context. Energy and Buildings, 33(5), 443–450.. 458 459 460. Portolan dos Santos, Í., & Rüther, R. (2012). The potential of building-integrated (BIPV) and building applied photovoltaics (BAPV) in single-family, urban residences at low latitudes in Brazil. http://doi.org/10.1016/j.enbuild.2012.03.052. 461 462 463. Radmehr, M., Willis, K., & Kenechi, U. E. (2014). A framework for evaluating WTP for BIPV in residential housing design in developing countries: A case study of North Cyprus. Energy Policy, 70, 207–216. http://doi.org/10.1016/j.enpol.2014.03.041. 464 465. Ramesh, T., Prakash, R., & Shukla, K. K. (2010). Life cycle energy analysis of buildings: An overview. Energy and Buildings, 42(10), 1592–1600.. 466 467 468. Roth, M. (2006). Validating the use of Internet survey techniques in visual landscape assessment—An empirical study from Germany. Landscape and Urban Planning, 78(3), 179–192. http://doi.org/10.1016/j.landurbplan.2005.07.005. 469 470 471. Strazzera, E., & Statzu, V. (2017). Fostering photovoltaic technologies in Mediterranean cities: Consumers’ demand and social acceptance. Renewable Energy, 102, 361–371. http://doi.org/10.1016/j.renene.2016.10.056. 472 473 474. Torres-Sibille, A. del C., Cloquell-Ballester, V. A., Cloquell-Ballester, V. A., & Artacho Ramírez, M. A. (2009). Aesthetic impact assessment of solar power plants: An objective and a subjective approach. Renewable and Sustainable Energy Reviews, 13(5), 986–999. http://doi.org/10.1016/j.rser.2008.03.012. 475. Vega Sánchez, S., & Rodriguez Ubiñas, E. (2014). Science behind and beyond the solar decathlon Europe 2012.
(22) 476. competition. Energy and Buildings, 83, 1–2. http://doi.org/10.1016/j.enbuild.2014.07.017. 477 478 479. Vivar, M., Fuentes, M., Norton, M., Makrides, G., & De Bustamante, I. (2014). Estimation of sunshine duration from the global irradiance measured by a photovoltaic silicon solar cell. Renewable and Sustainable Energy Reviews, 36, 26–33. http://doi.org/10.1016/j.rser.2014.04.045. 480 481. Werner, F., & Richter, K. (2007). Wooden building products in comparative LCA. The International Journal of Life Cycle Assessment, 12(7), 470–479. http://doi.org/10.1065/lca2007.04.317. 482 483 484. Yang, R. J., & Zou, P. X. W. (2016). Building integrated photovoltaics (BIPV): costs, benefits, risks, barriers and improvement strategy. International Journal of Construction Management, 16(1), 39–53. http://doi.org/10.1080/15623599.2015.1117709. 485 486 487. Zabalza Bribián, I., Aranda Usón, A., & Scarpellini, S. (2009). Life cycle assessment in buildings: State-of-the-art and simplified LCA methodology as a complement for building certification. Building and Environment, 44(12), 2510–2520.. 488 489 490 491. Zabalza Bribián, I., Valero Capilla, A., & Aranda Usón, A. (2011). Life cycle assessment of building materials: Comparative analysis of energy and environmental impacts and evaluation of the eco-efficiency improvement potential. Building and Environment, 46(5), 1133–1140. http://doi.org/10.1016/j.buildenv.2010.12.002. 492.
(23)
Figure
+7
Documento similar