Association of the LCT 13910C>T polymorphism with obesity and its modulation by dairy products in a Mediterranean population
28
0
0
Texto completo
(2) Page 1 of 27. 1 2 3 4 5 6 7 8 9 10 11 12 13 14 15 16 17 18 19 20 21 22 23 24 25 26 27 28 29 30 31 32 33 34 35 36 37 38 39 40 41 42 43 44 45 46 47 48 49 50 51 52 53 54 55 56 57 58 59 60. Obesity. Association of the rs4988235 in the lactase gene with obesity and its modulation by dairy products in a Mediterranean population. Corella D1,2,3*, Arregui M1,2,4*, Coltell O3,4, Portolés O1,2, Guillem-Sáiz P1,2, Carrasco P1,2, Sorlí JV1,2,5, Ortega-Azorín C1,2, González JI1,2, Ordovás JM2,3,6. 1. Genetic and Molecular Epidemiology Unit School of Medicine. University of Valencia, Valencia, Spain. 2. CIBER Fisiopatología de la Obesidad y Nutrición, Instituto de Salud Carlos III, Madrid, Spain. 3. Nutrition and Genomics Laboratory, JM-USDA Human Nutrition Research Center on Aging at Tufts University, Boston, MA. 4. Department of Computing Languages and Systems. University Jaume I, Castellón, Spain. 5. Primary Care Health Center. Generalitat Valenciana. Xirivella, Valencia, Spain 6. Department of Cardiovascular Epidemiology and Population Genetics, Centro Nacional de Investigaciones Cardiovasculares (CNIC), Madrid, Spain. *: These authors contributed equally to this work.. For Correspondence: Dolores Corella, PhD Genetic and Molecular Epidemiology Unit. University of Valencia. Blasco Ibañez, 15 46010-Valencia, Spain Tel: (+34) 963864417; Fax: (+34) 963864166; E-mail: [email protected]. ScholarOne, 375 Greenbrier Drive, Charlottesville, VA, 22901. 1.
(3) Obesity. 1 2 3 4 5 6 7 8 9 10 11 12 13 14 15 16 17 18 19 20 21 22 23 24 25 26 27 28 29 30 31 32 33 34 35 36 37 38 39 40 41 42 43 44 45 46 47 48 49 50 51 52 53 54 55 56 57 58 59 60. Page 2 of 27. ABSTRACT The -13910C>T polymorphism (rs4988235) upstream from the lactase (LCT) gene, strongly associated with lactase persistence (LP) in Europeans, is emerging as a new candidate for obesity. Our aim was to analyze the association of rs4988235 with obesity-related variables and its modulation by dairy product intake in an elderly population. We studied 940 White subjects (aged 67+/-7 years) from the Spanish Mediterranean population. Dairy product consumption was assessed by a validated questionnaire. Anthropometric variables were directly measured, and metabolic-syndrome (MetS)-related variables were obtained. Prevalence of the CC genotype (38.0%) [lactase non-persistent (LNP)] was higher than in northern Europe. CT and TT were 45.7% and 16.3%, respectively. The CC genotype was not associated with lower milk or dairy product consumption in the whole population. Only in women was dairy intake significantly lower in CC subjects. The most important association was obtained with anthropometric measurements. CC individuals had lower weight (P=0.032), lower BMI (29.7+/-4.2 vs 30.6+/-4.2 Kg/m2;P=0.003) and lower waist circumference (101.1+/-11.8 vs 103.5+/-11.5 cm;P=0.005) than T-allele carriers. Obesity risk was also significantly higher in T-allele carriers than in CC individuals (OR:1.38; 95% CI:1.05-1.81; P=0.01), and remained significant after adjustment for sex, age, diabetes, physical activity and energy intake. Dairy lactose intake modulated these associations, being higher with higher lactose intake. No significant associations with lipids, glucose or blood pressure were obtained after adjustment for BMI. In conclusion, despite not finding marked differences in dairy product consumption, the rs4988235 polymorphism was strongly associated with obesity and modulated by lactose intake in this Mediterranean population.. Key words: Lactase, obesity, gene, dairy products, lactose, metabolic syndrome, Mediterranean. ScholarOne, 375 Greenbrier Drive, Charlottesville, VA, 22901. 2.
(4) Page 3 of 27. 1 2 3 4 5 6 7 8 9 10 11 12 13 14 15 16 17 18 19 20 21 22 23 24 25 26 27 28 29 30 31 32 33 34 35 36 37 38 39 40 41 42 43 44 45 46 47 48 49 50 51 52 53 54 55 56 57 58 59 60. Obesity. INTRODUCTION The association of dairy food consumption with obesity and other cardiovascular risk factors has been investigated in several studies, but with contradictory results (1-6). A beneficial effect of dairy consumption on the incidence of various metabolic syndrome components (including obesity, glucose intolerance, hypertension, and dyslipidemia) was reported by Pereira et al (1) in the CARDIA study and replicated in some (2-4), but not all (5,6) subsequent studies. Some meta-analyses carried out for this purpose reflect the inconsistency of results and underline the need to analyse the different factors involved in greater depth (7-9). One of the potential factors that may affect the quantity of milk consumed as well as the effects of dairy products on obesity and obesity-related variables in adults is lactose intolerance or lactase non-persistence (LNP). Lactose intolerance is the syndrome of diarrhoea, abdominal pain or flatulence, occurring after lactose ingestion (10). These symptoms, caused by a decreased ability to hydrolyze lactose due to a deficiency in the enzyme lactase, may have an influence in the amount of dairy product consumed. On the other hand, if there is no restriction of dairy products in LNP subjects, the undigested lactose may have several metabolic effects that may be related to obesity. Lactase is coded by the lactase gene (LCT), and LCT activity remains high until weaning, then it fades away in most of the adult population (adult-type hypolactasia or LNP). A single nucleotide polymorphism (SNP) (rs4988235), located at -13910 bp upstream from the LCT gene (13910C > T) within intron 13 of the adjacent minichromosome maintenance 6 (MCM6) gene was found to be associated with LNP (11). Various studies (11-13) have demonstrated that the 13910C > T SNP is functional and is associated with changes in LCT gene expression. Individuals homozygous for the C allele (LNP) have almost undetectable levels of intestinal lactase production compared to TC or TT individuals [lactase persistent (LP), following a codominant model] (11). Pohl et al (14) found an excellent agreement between the lactose hydrogen test (10) and the. ScholarOne, 375 Greenbrier Drive, Charlottesville, VA, 22901. 3.
(5) Obesity. 1 2 3 4 5 6 7 8 9 10 11 12 13 14 15 16 17 18 19 20 21 22 23 24 25 26 27 28 29 30 31 32 33 34 35 36 37 38 39 40 41 42 43 44 45 46 47 48 49 50 51 52 53 54 55 56 57 58 59 60. Page 4 of 27. genetic test based on this SNP for LNP in Europeans. The frequency of LP is high in northern European populations, decreases across southern Europe and more than half of the world’s population is LNP (15). Although some studies have associated the CC genotype with a lower consumption of milk (16-18), this association is not always observed (19-21). Interestingly, the LCT gene is emerging as a new candidate gene related with obesity and other anthropometric measurements. Hence, in a recent Genome-Wide Association Study (GWAs) carried out by CHARGE (Cohorts for Heart and Aging Research in Genome Epidemiology), the Consortium (22) found a strong association between various SNPs in the LCT gene and waist circumference. Likewise, Kettunen et al (23), undertook a meta-analysis on eight European cohorts (in which the Mediterranean population was not included) finding a strong association between the LP variant (T allele, rs4988235) and higher body mass index (BMI). However, none of the published studies has analyzed the joint influence of the LP genotype and dairy product consumption on obesity. Therefore, our aim was to study the association of the -13910C>T SNP with obesity and obesity-related variables as well as its modulation by lactose intake in an elderly Mediterranean population.. MATERIAL AND METHODS Subjects and study design We studied 940 unrelated White individuals (338 men and 602 women), mean age 67.3+/6.5 years, who participated in the PREDIMED (Prevención con Dieta MEDiterránea) study, were consecutively recruited in the Valencia Region (on the East Mediterranean coast of Spain) from October 2003 to December 2008 and had the -13910C>T SNP genotype determined. All participants gave their informed consent. The ethics committee of the University of Valencia approved the study. Details of this study have been previously reported (24). Briefly, high ScholarOne, 375 Greenbrier Drive, Charlottesville, VA, 22901. 4.
(6) Page 5 of 27. 1 2 3 4 5 6 7 8 9 10 11 12 13 14 15 16 17 18 19 20 21 22 23 24 25 26 27 28 29 30 31 32 33 34 35 36 37 38 39 40 41 42 43 44 45 46 47 48 49 50 51 52 53 54 55 56 57 58 59 60. Obesity. cardiovascular risk subjects were selected by physicians in Primary Care Centers participating in the study. Eligible subjects were community-dwelling people (55-80 years of age for men; 60-80 years of age for women) who fulfilled at least one of two criteria: type 2 diabetes; 3 or more cardiovascular risk factors (current smoking, hypertension, dyslipidemia, overweight, or a family history of premature cardiovascular disease). Demographic, anthropometric and clinical measurements The baseline examination included assessment of standard socio-demographic factors, clinical, biochemical and lifestyle variables, as previously detailed (24). Anthropometric variables were directly measured by trained nurses by standard techniques at baseline (24). Height and weight were measured with light clothing and no shoes. Obesity was defined as BMI>=30kg/m2. Waist circumference was measured midway between the lowest rib and the iliac crest using an anthropometric tape. Trained personnel measured blood pressure with a validated semi-automatic sphygmomanometer (Omron HEM-705CP, The Netherlands) in a seated position after a 5-min rest. Physical activity was estimated by the Minnesota Leisure Time Physical Activity as previously reported (24). Blood samples were obtained for each participant after an overnight fast and were frozen at -80ºC. Fasting glucose, total cholesterol, triglycerides, HDL-C and LDL-C were determined as previously reported (24). The metabolic syndrome was defined according to updated ATP III criteria (25), which require that 3 or more of the following conditions be met: abdominal obesity (waist circumference >102 cm in men and >88 cm in women), hypertriglyceridemia (triglycerides level 150 mg/dL), low HDL cholesterol level (<40 mg/dL in men and <50 mg/dL in women), elevated fasting blood glucose level (100 mg/dL), and elevated blood pressure (systolic 130 mm Hg, diastolic 85 mm Hg, or taking antihypertensive medication). Participants who were being treated with antidiabetic, antihypertensive, or triglyceride-lowering. ScholarOne, 375 Greenbrier Drive, Charlottesville, VA, 22901. 5.
(7) Obesity. 1 2 3 4 5 6 7 8 9 10 11 12 13 14 15 16 17 18 19 20 21 22 23 24 25 26 27 28 29 30 31 32 33 34 35 36 37 38 39 40 41 42 43 44 45 46 47 48 49 50 51 52 53 54 55 56 57 58 59 60. Page 6 of 27. medications were considered to be diabetic, hypertensive, or hypertriglyceridemic, respectively. Dietary measurements Food consumption was determined by a validated (26) semi-quantitative 137-item food frequency questionnaire (FFQ). Energy and nutrient intake were calculated from Spanish food composition tables (27). Lactose content was not available in the Spanish tables and so foreign food composition tables were used (Fineli Food Composition Database, Finland, release 2010). The questionnaire was based on the typical portion sizes that were multiplied by the consumption frequency for each food. Information about dairy products was assessed in fifteen items of the semi-quantitative FFQ (whole-fat milk, partially skimmed milk, skimmed milk, condensed milk, whipped cream, yoghurt, skimmed yoghurt, milkshake, ricotta cheese or junket, petit Suisse cheese, spreadable cheese wedges, cottage cheese, other cheese, custard, and ice cream). We calculated total dairy products intake (in g/d) for each individual on the basis of the type and amount consumed. DNA extraction and genotyping Genomic DNA was isolated from blood. The rs4988235 LCT SNP was determined using a 7900HT Sequence Detection system (Applied Biosystems) and a customized fluorescent allelic discrimination TaqMan assay by standard procedures. For quality control purposes, 50% of randomly selected samples were also genotyped by restriction fragment length polymorphism analysis. Concordance between techniques was higher than 95%. Discrepant samples were sequenced. Information on probes and polymerase chain reaction conditions for genotyped single nucleotide polymorphisms can be obtained from the authors upon request.. ScholarOne, 375 Greenbrier Drive, Charlottesville, VA, 22901. 6.
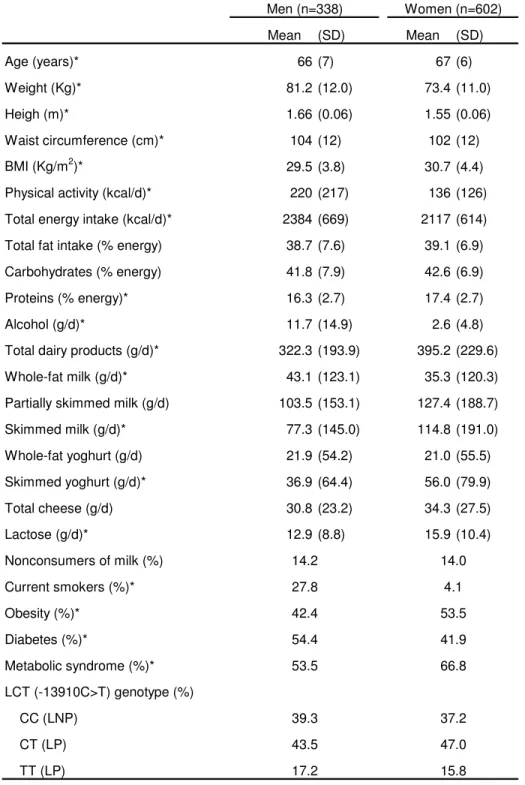
(8) Page 7 of 27. 1 2 3 4 5 6 7 8 9 10 11 12 13 14 15 16 17 18 19 20 21 22 23 24 25 26 27 28 29 30 31 32 33 34 35 36 37 38 39 40 41 42 43 44 45 46 47 48 49 50 51 52 53 54 55 56 57 58 59 60. Obesity. Statistical analysis χ2 tests were used to test differences in percentages. Taking into account that the genetically defined LP is considered to follow a dominant model, CT and TT subjects (LP) were grouped and compared with CC subjects for the statistical analysis after having checked that this dominant model is observed in this Mediterranean population. We applied the t tests to compare crude means for normally distributed variables. Alcohol and dairy product consumption did not follow a normal distribution and we applied the non-parametric Mann-Whitney U test. For continuous anthropometric variables, multivariate adjustment was carried out by linear regression analysis. Model were adjusted for sex, age (as continuous), diabetes, total energy intake (as continuous) and physical activity (as continuous). Additional adjustment for dairy product consumption was also done. Multivariate adjustment of plasma lipids, fasting glucose and blood pressure was also carried out by linear regression. Regression coefficients and adjusted means for each predictor were estimated from the multivariate models. Regression models with interaction terms and as well as stratified analysis were applied to test the homogeneity of effects by gender and lactose intake. Logistic regression models were fitted to estimate the odds ratio (OR) and 95% confidence interval (CI) of obesity and obesity-related variables associated with the LP genotype compared with LNP. Analyses were performed using the SPSS statistical software, version 17.0 (SPSS Inc, Chicago, Illinois).. RESULTS Table 1 shows general characteristics of the study subjects by gender. Prevalence of obesity, diabetes and metabolic syndrome was high given that this study involved a population that was selected for being elderly and with a high cardiovascular risk. Total dairy product. ScholarOne, 375 Greenbrier Drive, Charlottesville, VA, 22901. 7.
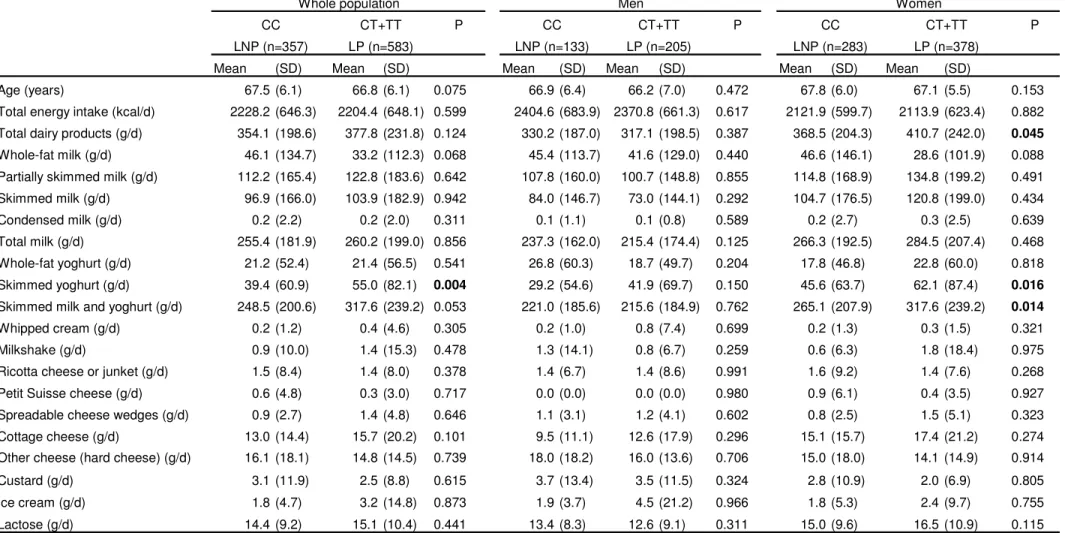
(9) Obesity. 1 2 3 4 5 6 7 8 9 10 11 12 13 14 15 16 17 18 19 20 21 22 23 24 25 26 27 28 29 30 31 32 33 34 35 36 37 38 39 40 41 42 43 44 45 46 47 48 49 50 51 52 53 54 55 56 57 58 59 60. Page 8 of 27. consumption was higher in women than in men (395.2+/-229.6 g/d vs 322.3+/-193.9 g/d, respectively; P<0.001). Men consumed a greater amount of whole-fat milk whereas women consumed more skimmed milk and skimmed yoghurt, and there were no significant differences between men and women in the amount of whole-fat yoghurt consumed. Likewise, total cheese intake did not differ between men and women. The amount of lactose intake derived from dairy products was also significantly higher in women than men (P=0.01). However, there were no significant differences in the percentage of men and women who claim never to consume milk (14.2% vs 14%; P=0.994). Prevalence of the LCT -13910 C>T genotypes were: CC (LNP) 38.0% (n=357), CT 45.7% (n=430) and TT 16.3% (n=153). Carriers of the T allele were the genetically determined LP subjects. This distribution was in Hardy-Weinberg equilibrium (P=0.221) and did not differ between men and women (P=0.577). Association between the rs4988235 SNP and dairy product intake Table 2 shows mean intake of milk and dairy products (total and by gender) depending on the LCT -13910 C>T genotypes. The results are shown grouping the T carriers together (LP) and comparing them with CC subjects (LNP). Total energy intake did not differ between CC and subjects carrying the T- allele. Likewise, we did not find significant differences in physical activity depending on the LCT genotype (not shown). On analysing the results for men and women jointly, it is observed that although diary product consumption tended to be lower in CC subjects, the differences did not reach statistical significance. Neither was the total consumption of milk or the contribution of lactose or calcium through dairy products lower. Statistically significant differences were only reached in the consumption of skimmed yoghurt, which was lower in CC subjects.. ScholarOne, 375 Greenbrier Drive, Charlottesville, VA, 22901. 8.
(10) Page 9 of 27. 1 2 3 4 5 6 7 8 9 10 11 12 13 14 15 16 17 18 19 20 21 22 23 24 25 26 27 28 29 30 31 32 33 34 35 36 37 38 39 40 41 42 43 44 45 46 47 48 49 50 51 52 53 54 55 56 57 58 59 60. Obesity. On analysing the results per gender, it can be observed that in men the differences in milk and dairy product intake depending on genotype were minimal and did not reach statistical significance for any comparison. In women, these differences were more accentuated; reaching statistical significance in the consumption of skimmed yoghurt (lower in CC subjects) and when the consumption of skimmed yoghurt, skimmed milk and partially skimmed milk were analyzed together (265.1 +/- 207.9 g/d vs 317.6+/-239.2 g/d in CC vs CT+TT; P=0.014). Likewise, the total consumption of dairy products also reached statistically significant differences in women depending on the LCT genotype (P=0.045). No significant differences of lactose intake were found. Association between the rs4988235 SNP with anthropometric variables We observed that the LCT -13910 C>T SNP presented a strong association with anthropometric measures (Table 3). CC individuals, although they do not differ in height from the other genotypes, had significantly less weight, a lower BMI and less waist-circumference than Tallele carriers. These differences remained statistically significant when the models were adjusted for gender and age, and even after additional adjustment for diabetes, physical activity and total energy intake. These associations were homogeneous by gender, and both in men and women CC subjects have lower means of anthropometric measurements than T-allele carriers (P for interaction LCT genotype x gender were 0.738, 0.872 and 0.942 for weight, BMI and waist circumference, respectively). Next, we analyzed the association of the LCT -13910 C>T SNP with obesity (Table 3). Considering CC individuals as the reference category, we observed that T-allele carriers have a greater risk (OR) of obesity, both unadjusted (OR: 1.39; 95% CI: 1.07-1.82; P=0.014) and after adjustment for gender, age, diabetes, physical activity and total energy intake (OR: 1.37; 95% CI:. ScholarOne, 375 Greenbrier Drive, Charlottesville, VA, 22901. 9.
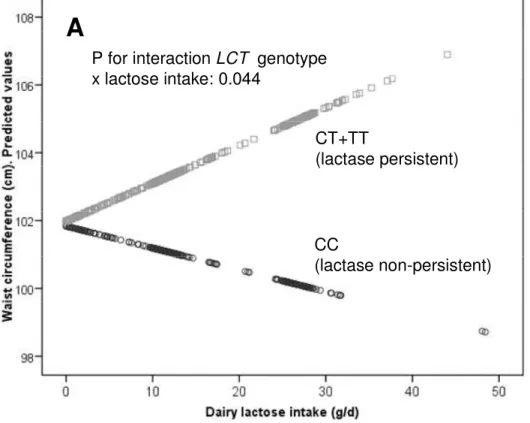
(11) Obesity. 1 2 3 4 5 6 7 8 9 10 11 12 13 14 15 16 17 18 19 20 21 22 23 24 25 26 27 28 29 30 31 32 33 34 35 36 37 38 39 40 41 42 43 44 45 46 47 48 49 50 51 52 53 54 55 56 57 58 59 60. Page 10 of 27. 1.03-1.81; P=0.029). Homogeneity by gender was also observed between men and women in this association (P for interaction LCT x gender =0.826). Subsequent adjustments for dairy product intake do not modify the statistical significance of the associations of the LCT -13910 C>T SNP with the anthropometric variables (not shown). Modulation of the association between the rs4988235 SNP with anthropometric variables by lactose intake Considering that CC subjects may tolerate low amounts of lactose intake without gastrointestinal symptoms, we hypothesized that dairy lactose intake may modulate the effects of the LCT -13910 C>T SNP on anthropometric variables. We first tested the interaction effect between the LCT -13910 C>T SNP and dairy lactose intake as continuous. Taking into account dairy lactose intake was not normally distributed, eight identified outliers (corresponding to 8 TC+TT subjects with lactose intake higher that 50g/d) were removed to improve normality for this linear regression analysis. We found a statistically significant interaction term between lactose intake and the LCT -13910 C>T SNP in determining waist circumference (P=0.044 after adjustment for sex, age, diabetes, total energy intake and physical activity). According to this interaction, a higher dairy lactose intake increased the differences in waist-circumference between CC and CT+TT individuals (Figure 1 A). We also tested this modulation by lactose intake as a categorical variable. Three categories of lactose intake based on habitual milk consumption equivalence were considered (Figure 1B). No differences in the LCT -13910 C>T genotype distribution among categories (low, intermediate and high) of lactose intake (P=0.518) were observed. When lactose intake was low [less than one small cup per day (<=8 g lactose/d); 20% of the population], we did not find significant differences in waist-circumference between CC and Tallele carriers (P=0.808). When lactose intake was intermediate [between 1 and 2 small or large. ScholarOne, 375 Greenbrier Drive, Charlottesville, VA, 22901. 10.
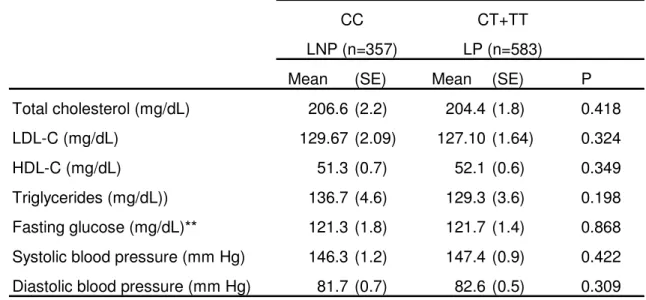
(12) Page 11 of 27. 1 2 3 4 5 6 7 8 9 10 11 12 13 14 15 16 17 18 19 20 21 22 23 24 25 26 27 28 29 30 31 32 33 34 35 36 37 38 39 40 41 42 43 44 45 46 47 48 49 50 51 52 53 54 55 56 57 58 59 60. Obesity. cups of milk per day (8-24 g lactose/d); 50% of the population], significant differences in waist circumference between LCT genotypes were detected (P=0.012). These differences increased in magnitude when higher intakes of lactose were observed [more than 2 large cups of milk per day (>24 g lactose/d); 30% of the population]. In terms of obesity risk, in subjects with a low lactose intake (<=8 g/d) we did not find significant association between the LCT -13910 C>T SNP and obesity in the crude model (OR=1.03, 95%CI: 0.55-1.91; P=0.910) or in the model adjusted for sex, age, diabetes, physical activity and total energy intake (OR=1.05, 95%CI: 0.54-2.01; P=0.891). However, when lactose intake was higher (>8 g/d), we did observe a significant association of the CT+TT genotype with higher obesity risk (OR: 1.50, 95%CI: 1.10-2.03; P=0.012 in the crude model and OR: 1.44, 95%CI: 1.05-1.96; P=0.022 in the model adjusted for sex, age, diabetes, physical activity and total energy intake). Association between the rs4988235 SNP with the metabolic syndrome related variables Finally, we studied the association of the LCT SNP with biochemical parameters (fasting glucose, and plasma lipids), and blood pressure (Table 4) and observed that, after adjustment for BMI, there were no statistically significant differences in total cholesterol, LDL-C, HDL-C, TG, fasting glucose concentrations or blood pressure between CC subjects and T-allele carriers. When we analyzed the association of the LCT SNP with the Metabolic syndrome, taking CC individuals as the reference category, although the magnitude of the OR in T-allele carriers was greater than 1, it did not reach statistical significance, either adjusted for gender and age (OR: 1.26; 95%CI: 0.951.68; P=0.114) or after additional adjustment for physical activity and total energy intake (OR: 1.24; 95%CI: 0.92-1.67; P=0.164). When we tested the potential modulation by lactose intake, we found that in subjects with a low lactose intake (<=8 g/d), the LCT SNP was not associated with. ScholarOne, 375 Greenbrier Drive, Charlottesville, VA, 22901. 11.
(13) Obesity. 1 2 3 4 5 6 7 8 9 10 11 12 13 14 15 16 17 18 19 20 21 22 23 24 25 26 27 28 29 30 31 32 33 34 35 36 37 38 39 40 41 42 43 44 45 46 47 48 49 50 51 52 53 54 55 56 57 58 59 60. Page 12 of 27. the metabolic syndrome (OR adjusted for sex, age, physical activity and energy intake: 0.98, 95%CI: 0.49-1.96; P=0.955), this association being statistically significant in subjects with lactose intake higher than 8 g/d (OR adjusted for sex, age, physical activity and energy intake: 1.40, 95%CI: 1.02-1.90; P=0.040). However, this association was mainly mediated by abdominal obesity. It was the only component of the metabolic syndrome that was significantly associated with the LCT polymorphism.. DISCUSSION In this study carried out on a high cardiovascular risk Mediterranean population, we have detected a high prevalence of CC individuals (LNP) in contrast to that found in northern European populations, where the opposite situation is found (15,28). Although the effect of the LCT polymorphism on the differences of milk and dairy product consumption was not very high in the population as a whole, the association that we have found with anthropometric measurements is particularly relevant. In this Mediterranean population, CC individuals had significantly lower BMI, lesser waist circumference and lower risk of obesity than T-allele carriers even after adjustment for sex, age, diabetes, physical activity and total energy intake. Moreover, we reported for the first time that the association between the -13910C > T LCT SNP and anthropometric variables is modulated by dairy lactose intake. These observations are in line with the results obtained in a recently published meta-analysis (23) that reported novel evidence of association between the -13910C>T LCT polymorphism and BMI (P = 7.9x10⁻⁵) in 31,720 European individuals. Eight cohorts were included, five of which were of Finnish origin (with a high milk intake), and the others from Holland and England, without including a Mediterranean population. They observed that the CC genotype was associated with decreased BMI compared to CT/TT. ScholarOne, 375 Greenbrier Drive, Charlottesville, VA, 22901. 12.
(14) Page 13 of 27. 1 2 3 4 5 6 7 8 9 10 11 12 13 14 15 16 17 18 19 20 21 22 23 24 25 26 27 28 29 30 31 32 33 34 35 36 37 38 39 40 41 42 43 44 45 46 47 48 49 50 51 52 53 54 55 56 57 58 59 60. Obesity. genotypes in the meta-analysis, and that this effect was observed in the same direction for both men and women. They also observed that this effect was due to the influence of the genotype on weight and not on height. Moreover, they discarded population stratification as being responsible for these effects. In our study, the probability of the influence of population stratification is very low, as we carried it out on White subjects recruited in a single region of Spain with a homogenous ethnic background. Another study undertaken on a sample of 944 postmenopausal Spanish women recruited in another Spanish region (Catalonia) aimed to investigate the association of the LCT SNP with osteoporosis phenotypes obtained a similar frequency of 13910C>T LCT genotypes (29). These researchers also found a significant association of the LCT SNP with weight. Hence, TT women were 1.91 kg heavier than CT+CC women, adding consistency to the association found in our study. However, in that same study, the authors did not analyse the possible differences in waist circumference or obesity risk associated with the LCT SNP, our study being the first to report such associations in a Mediterranean population. Furthermore, our results were also the first to replicate the observations of the CHARGE Consortium, where strong associations were found between various SNPs in the LCT gene and waist-circumference (22). In line with those observations, a study carried out by Almon et al on 551 individuals of the general population of the Canary Islands (30), found that the prevalence of central obesity was higher in CT+TT (62%) individuals than in CC individuals (55.9%). However, those differences did not reach statistical significance possibly due to a smaller sample size. Nevertheless, what they did observe was a greater risk of metabolic syndrome in CT+TT individuals than in CC individuals (OR: 1.56; 95%CI: 1.06–2.31). In our study, carried out on a Mediterranean population, and despite the tendency of the association with metabolic syndrome being similar to that observed in the Canary islands, our results did not reach statistical significance in the whole population, given that we observed the effects of the LCT SNP mainly on ScholarOne, 375 Greenbrier Drive, Charlottesville, VA, 22901. 13.
(15) Obesity. 1 2 3 4 5 6 7 8 9 10 11 12 13 14 15 16 17 18 19 20 21 22 23 24 25 26 27 28 29 30 31 32 33 34 35 36 37 38 39 40 41 42 43 44 45 46 47 48 49 50 51 52 53 54 55 56 57 58 59 60. Page 14 of 27. anthropometric measurements and not on lipid concentrations, glucose or blood pressure. However, in subgroup analysis, we observed a significant association between the metabolic syndrome and the LCT SNP in subjects with lactose intake higher than 8g/d. Considering that milk consumption was higher in the Canary Islands than in our population, both results are in agreement. On the other hand, the differences observed between these two studies may be due to the different ages of the population and associated risk factors. Thus, although in the study carried out in the Canary Islands (mean age 45+/-15 years) CC individuals were found to consume less milk than CT+TT individuals (246 vs 300 g/d; P<0.05), our study found no significant differences in the amount of total milk consumed depending on the LCT SNP. Possibly, on dealing with an elderly population in which calcium requirements are greater to minimize osteoporosis, medical advice recommending higher milk consumption may have a greater influence, that recommendation offsetting the genetic influence. Other studies that have analysed the influence of the LCT SNP on milk and dairy product consumption have also found differing associations depending on the age and gender of the population analysed (16-21,31,32). In general, it seems that the influence of the LCT genotype on dairy consumption is higher in women than in men. So, for example, in the study carried out by Laaksonen et al in Finland (17), it was observed that in females with the CC genotype, milk and milk product consumption was lowest from the age of 6 years to adulthood with higher differences than those observed in males. In our study, CC women presented a lower total consumption of low-fat milk and yoghurt and than T-carriers, as well as a lower total dairy product consumption, which was not observed in men. One possible explanation could be that females and males differ in their sensitivity to gastrointestinal symptoms caused by maldigested lactose, being stronger in women (33).. ScholarOne, 375 Greenbrier Drive, Charlottesville, VA, 22901. 14.
(16) Page 15 of 27. 1 2 3 4 5 6 7 8 9 10 11 12 13 14 15 16 17 18 19 20 21 22 23 24 25 26 27 28 29 30 31 32 33 34 35 36 37 38 39 40 41 42 43 44 45 46 47 48 49 50 51 52 53 54 55 56 57 58 59 60. Obesity. Another possible explanation could be that as men consume less milk than women, the amount of lactose does not pose a problem even for the LNP, as it has been reported that gastrointestinal symptoms of intolerance to lactose are not important until consuming amounts greater than 12 g of lactose/d (approximately 250 ml of milk) (34). Other authors indicate that lactose maldigesters may be able to tolerate foods containing 6 g lactose or less per serving, such as hard cheeses and small servings (120 mL or less) of milk (35). In our study we did not found differences in the prevalence of the LP or LNP genotypes among the three categories of lactose intake considered [low (<=8g/d, intermediate (8-24 g/d) and high (>24 g/d)]. The symptoms of lactose intolerance result from bacterial fermentation of undigested lactose in the colon (10). Therefore, the same amount of lactose ingested can lead to different gastrointestinal effects in LNP and LP subjects and these effects be related to the observed obesity phenotypes. In addition to differences in abdominal pain, bloating, or diarrhoea that may be related to less weight (10), various studies have shown differences in the microbial composition of fecal samples of the LP and LNP individuals (36,37) that may relate to obesity even in the absence of gastrointestinal symptoms. For example, Szilagyi et al (37), observed that lactose maldigesters had differences in bifidobacteria and lactobacilli counts compared with lactose digesters. Bearing in mind that recent studies have shown differences between the gut microbiota in obese and non-obese individuals (38-40), changes in the gut microbiota in LNP compared with LP subjects may be involved in the lower risk of obesity observed in CC individuals, due to differing lactose fermentation capacity and the subsequent multiple effects. This hypothesis, as well as the identification of additional mechanisms to explain the association of the -13910C>T LCT SNP with obesity-related variables, requires further studies in order to substantiate it. Supporting this hypothesis is our observation of a possible greater effect of the LCT SNP on anthropometric measurements when the amounts of lactose consumed are greater. When dairy lactose intake was low (<=8 g/d), we did not find. ScholarOne, 375 Greenbrier Drive, Charlottesville, VA, 22901. 15.
(17) Obesity. 1 2 3 4 5 6 7 8 9 10 11 12 13 14 15 16 17 18 19 20 21 22 23 24 25 26 27 28 29 30 31 32 33 34 35 36 37 38 39 40 41 42 43 44 45 46 47 48 49 50 51 52 53 54 55 56 57 58 59 60. Page 16 of 27. significant differences in waist circumference or obesity risk between CC and T-allele carriers. However, significant differences in were found with higher lactose intake. This is the first time that a modulation by the amount of lactose intake of the effects of the -13910C>T LCT SNP on obesity is reported and requires replication in other populations. Moreover, our results suggest that some of the controversial results obtained in previous studies investigating the effect of dairy product consumption on obesity-related variables, may be explained by the potential heterogeneous effects of these products on LNP and LP individuals in those cohorts. Therefore, genotyping of the -13910C>T LCT SNP in these studies would be of interest to clarify the results.. ACKNOWLEDGEMENTS Funding/Support: This work was supported by grants from the Ministerio de Ciencia e Innovación, Spain (CIBER CB06/03/0035, RD07/0067/0006, PI6-1326, PI07-0954, PI08-90002 and SAF-09-12304), the Generalitat Valenciana, Spain (GVACOMP2010-181, BEST2010-211, BEST2010-032) and the National Heart, Lung, and Blood Institute grants HL-54776, National Institute of Diabetes and Digestive and Kidney Diseases, Grant Number DK075030 and by contracts 53-K06-5-10 and 58-1950-9-001 from the US Department of Agriculture Research. Disclosure The authors declared no conflict of interest.. ScholarOne, 375 Greenbrier Drive, Charlottesville, VA, 22901. 16.
(18) Page 17 of 27. 1 2 3 4 5 6 7 8 9 10 11 12 13 14 15 16 17 18 19 20 21 22 23 24 25 26 27 28 29 30 31 32 33 34 35 36 37 38 39 40 41 42 43 44 45 46 47 48 49 50 51 52 53 54 55 56 57 58 59 60. Obesity. REFERENCES 1. Pereira MA, Jacobs DR Jr, Van Horn L, Slattery ML, Kartashov AI, Ludwig DS. Dairy consumption, obesity, and the insulin resistance syndrome in young adults: the CARDIA Study. JAMA. 2002;287:2081-9. 2. Mirmiran P, Esmaillzadeh A, Azizi F. Dairy consumption and body mass index: an inverse relationship. Int J Obes (Lond). 2005;29:115-21. 3. Azadbakht L, Mirmiran P, Esmaillzadeh A, Azizi F. Dairy consumption is inversely associated with the prevalence of the metabolic syndrome in Tehranian adults. Am J Clin Nutr. 2005;82:523-30. 4. Elwood PC, Pickering JE, Fehily AM. Milk and dairy consumption, diabetes and the metabolic syndrome: the Caerphilly prospective study. J Epidemiol Community Health. 2007;61:695-8. 5. Snijder MB, van Dam RM, Stehouwer CD, Hiddink GJ, Heine RJ, Dekker JM. A prospective study of dairy consumption in relation to changes in metabolic risk factors: the Hoorn Study. Obesity (Silver Spring). 2008;16:706-9. 6.. Wennersberg MH, Smedman A, Turpeinen AM, et al. Dairy products and metabolic effects in overweight men and women: results from a 6-mo intervention study. Am J Clin Nutr. 2009;90:960-8.. 7. Lamarche B. Review of the effect of dairy products on non-lipid risk factors for cardiovascular disease. J Am Coll Nutr. 2008;27:741S-6S. 8. German JB, Gibson RA, Krauss RM, et al. A reappraisal of the impact of dairy foods and milk fat on cardiovascular disease risk. Eur J Nutr. 2009;48:191-203. 9. Warensjo E, Nolan D, Tapsell L. Dairy Food Consumption and Obesity-Related Chronic Disease. Adv Food Nutr Res. 2010;59C:1-41. ScholarOne, 375 Greenbrier Drive, Charlottesville, VA, 22901. 17.
(19) Obesity. 1 2 3 4 5 6 7 8 9 10 11 12 13 14 15 16 17 18 19 20 21 22 23 24 25 26 27 28 29 30 31 32 33 34 35 36 37 38 39 40 41 42 43 44 45 46 47 48 49 50 51 52 53 54 55 56 57 58 59 60. Page 18 of 27. 10. Suchy FJ, Brannon PM, Carpenter TO, et al. National Institutes of Health Consensus Development Conference: lactose intolerance and health. Ann Intern Med. 2010;152:7926. 11. Enattah NS, Sahi T, Savilahti E, Terwilliger JD, Peltonen L, Järvelä I. Identification of a variant associated with adult-type hypolactasia. Nat Genet. 2002;30:233-7. 12. Olds LC, Sibley E. Lactase persistence DNA variant enhances lactase promoter activity in vitro: functional role as a cis regulatory element. Hum Mol Genet. 2003;12:2333-40. 13. Lewinsky RH, Jensen TG, Møller J, Stensballe A, Olsen J, Troelsen JT .T-13910 DNA variant associated with lactase persistence interacts with Oct-1 and stimulates lactase promoter activity in vitro. Hum Mol Genet. 2005;14:3945-53. 14. Pohl D, Savarino E, Hersberger M, et al. Excellent agreement between genetic and hydrogen breath tests for lactase deficiency and the role of extended symptom assessment. Br J Nutr. 2010; 19:1-8. 15. Swallow DM. Genetics of lactase persistence and lactose intolerance. Annu Rev Genet. 2003;37:197-219. 16. Lehtimäki T, Hemminki J, Rontu R, et al. The effects of adult-type hypolactasia on body height growth and dietary calcium intake from childhood into young adulthood: a 21-year follow-up study--the Cardiovascular Risk in Young Finns Study. Pediatrics. 2006 ;118:1553-9. 17. Laaksonen MM, Mikkilä V, Räsänen L, et al. Genetic lactase non-persistence, consumption of milk products and intakes of milk nutrients in Finns from childhood to young adulthood. Br J Nutr. 2009;102:8-17.. ScholarOne, 375 Greenbrier Drive, Charlottesville, VA, 22901. 18.
(20) Page 19 of 27. 1 2 3 4 5 6 7 8 9 10 11 12 13 14 15 16 17 18 19 20 21 22 23 24 25 26 27 28 29 30 31 32 33 34 35 36 37 38 39 40 41 42 43 44 45 46 47 48 49 50 51 52 53 54 55 56 57 58 59 60. Obesity. 18. Torniainen S, Hedelin M, Autio V, et al. Lactase persistence, dietary intake of milk, and the risk for prostate cancer in Sweden and Finland. Cancer Epidemiol Biomarkers Prev. 2007;16:956-61. 19. Gugatschka M, Hoeller A, Fahrleitner-Pammer A, et al. Calcium supply, bone mineral density and genetically defined lactose maldigestion in a cohort of elderly men. J Endocrinol Invest. 2007;30:46-51. 20. Gugatschka M, Dobnig H, Fahrleitner-Pammer A, et al. Molecularly-defined lactose malabsorption, milk consumption and anthropometric differences in adult males. QJM. 2005;98:857-63. 21. Smith GD, Lawlor DA, Timpson NJ, et al. Lactase persistence-related genetic variant: population substructure and health outcomes. Eur J Hum Genet. 2009;17:357-67. 22. Heard-Costa NL, Zillikens MC, Monda KL, et al. NRXN3 is a novel locus for waist circumference: a genome-wide association study from the CHARGE Consortium. PLoS Genet. 2009;5(6):e1000539. 23. Kettunen J, Silander K, Saarela O, et al. European lactase persistence genotype shows evidence of association with increase in body mass index. Hum Mol Genet. 2010;19:112936. 24. Estruch R, Martínez-González MA, Corella D, et al. Effects of a Mediterranean-style diet on cardiovascular risk factors: a randomized trial. Ann Intern Med. 2006;145:1-11. 25. Grundy SM, Cleeman JI, Daniels SR; et al. Diagnosis and management of the metabolic syndrome: an American Heart Association/National Heart, Lung, and Blood Institute Scientific Statement. Circulation. 2005;112:2735-2752.. ScholarOne, 375 Greenbrier Drive, Charlottesville, VA, 22901. 19.
(21) Obesity. 1 2 3 4 5 6 7 8 9 10 11 12 13 14 15 16 17 18 19 20 21 22 23 24 25 26 27 28 29 30 31 32 33 34 35 36 37 38 39 40 41 42 43 44 45 46 47 48 49 50 51 52 53 54 55 56 57 58 59 60. Page 20 of 27. 26. Fernández-Ballart JD, Piñol JL, Zazpe I, et al. Relative validity of a semi-quantitative food-frequency questionnaire in an elderly Mediterranean population of Spain. Br J Nutr. 2010;103:1808-16. 27. Mataix J. Tablas de composición de alimentos (Spanish food composition tables), 4th edn. Universidad de Granada, Granada (in Spanish). 2003. 28. Itan Y, Powell A, Beaumont MA, Burger J, Thomas MG. The origins of lactase persistence in Europe. PLoS Comput Biol. 2009;5(8):e1000491. 29. Agueda L, Urreizti R, Bustamante M, et al. Analysis of three functional polymorphisms in relation to osteoporosis phenotypes: replication in a Spanish cohort. Calcif Tissue Int. 2010;87:14-24. 30. Almon R, Alvarez-Leon EE, Engfeldt P, Serra-Majem L, Magnuson A, Nilsson TK. Associations between lactase persistence and the metabolic syndrome in a cross-sectional study in the Canary Islands. Eur J Nutr. 2010; 49:141-6. 31. Sacerdote C, Guarrera S, Smith GD, et al. Lactase persistence and bitter taste response: instrumental variables and mendelian randomization in epidemiologic studies of dietary factors and cancer risk. Am J Epidemiol. 2007;166:576-81. 32. Almon R, Patterson E, Nilsson TK, Engfeldt P, Sjöström M. Body fat and dairy product intake in lactase persistent and non-persistent children and adolescents. Food Nutr Res. 2010;54. 33. Vesa TH, Seppo LM, Marteau PR, Sahi T, Korpela R. Role of irritable bowel syndrome in subjective lactose intolerance. Am J Clin Nutr 1998; 67, 710–715. 34. Wilt TJ, Shaukat A, Shamliyan T, et al. Lactose intolerance and health. Evid Rep Technol Assess 2010;192:1-410.. ScholarOne, 375 Greenbrier Drive, Charlottesville, VA, 22901. 20.
(22) Page 21 of 27. 1 2 3 4 5 6 7 8 9 10 11 12 13 14 15 16 17 18 19 20 21 22 23 24 25 26 27 28 29 30 31 32 33 34 35 36 37 38 39 40 41 42 43 44 45 46 47 48 49 50 51 52 53 54 55 56 57 58 59 60. Obesity. 35. Hertzler SR, Huynh BC, Savaiano DA. How much lactose is low lactose? J Am Diet Assoc. 1996;96:243-6. 36. Zhong Y, Priebe MG, Vonk RJ, et al. The role of colonic microbiota in lactose intolerance. Dig Dis Sci. 2004;49:78-83. 37. Szilagyi A, Shrier I, Heilpern D, et al. Differential impact of lactose/lactase phenotype on colonic microflora. Can J Gastroenterol. 2010;24:373-9. 38. Turnbaugh PJ, Ley RE, Mahowald MA, Magrini V, Mardis ER, Gordon JI. An obesityassociated gut microbiome with increased capacity for energy harvest. Nature. 2006;444:1027-31. 39. Armougom F, Henry M, Vialettes B, Raccah D, Raoult D. Monitoring bacterial community of human gut microbiota reveals an increase in Lactobacillus in obese patients and Methanogens in anorexic patients. PLoS One. 2009;4(9):e7125. 40. Sanz Y, Santacruz A, Gauffin P. Gut microbiota in obesity and metabolic disorders. Proc Nutr Soc. 2010;69:434-41.. ScholarOne, 375 Greenbrier Drive, Charlottesville, VA, 22901. 21.
(23) Obesity. 1 2 3 4 5 6 7 8 9 10 11 12 13 14 15 16 17 18 19 20 21 22 23 24 25 26 27 28 29 30 31 32 33 34 35 36 37 38 39 40 41 42 43 44 45 46 47 48 49 50 51 52 53 54 55 56 57 58 59 60. Page 22 of 27. Table 1: Demographic, anthropometric, dietary and genetics characteristics of the studied subjects Men (n=338). Women (n=602). Mean. Mean. (SD). (SD). Age (years)*. 66 (7). 67 (6). Weight (Kg)*. 81.2 (12.0). 73.4 (11.0). Heigh (m)*. 1.66 (0.06). 1.55 (0.06). Waist circumference (cm)*. 104 (12). 102 (12). BMI (Kg/m2)*. 29.5 (3.8). 30.7 (4.4). Physical activity (kcal/d)*. 220 (217). 136 (126). Total energy intake (kcal/d)*. 2384 (669). 2117 (614). Total fat intake (% energy). 38.7 (7.6). 39.1 (6.9). Carbohydrates (% energy). 41.8 (7.9). 42.6 (6.9). Proteins (% energy)*. 16.3 (2.7). 17.4 (2.7). Alcohol (g/d)*. 11.7 (14.9). 2.6 (4.8). 322.3 (193.9). 395.2 (229.6). 43.1 (123.1). 35.3 (120.3). 103.5 (153.1). 127.4 (188.7). Skimmed milk (g/d)*. 77.3 (145.0). 114.8 (191.0). Whole-fat yoghurt (g/d). 21.9 (54.2). 21.0 (55.5). Skimmed yoghurt (g/d)*. 36.9 (64.4). 56.0 (79.9). Total cheese (g/d). 30.8 (23.2). 34.3 (27.5). Lactose (g/d)*. 12.9 (8.8). 15.9 (10.4). Total dairy products (g/d)* Whole-fat milk (g/d)* Partially skimmed milk (g/d). Nonconsumers of milk (%). 14.2. 14.0. Current smokers (%)*. 27.8. 4.1. Obesity (%)*. 42.4. 53.5. Diabetes (%)*. 54.4. 41.9. Metabolic syndrome (%)*. 53.5. 66.8. CC (LNP). 39.3. 37.2. CT (LP). 43.5. 47.0. TT (LP). 17.2. 15.8. LCT (-13910C>T) genotype (%). SD: Standard deviation The metabolic syndrome was defined according to updated ATP III criteria *: Statistically significant differences between men and women (Student´s t test for continuous variables with normal distribution or the non-parametric Mann-Whitney U test for dairy products, alcohol and physical activity. Chi square tests for categorical variables) LNP: Lactase non-persistence; LP: Lactase persistence. ScholarOne, 375 Greenbrier Drive, Charlottesville, VA, 22901. 22.
(24) Page 23 of 27. 1 2 3 4 5 6 7 8 9 10 11 12 13 14 15 16 17 18 19 20 21 22 23 24 25 26 27 28 29 30 31 32 33 34 35 36 37 38 39 40 41 42 43 44 45 46 47 48. Obesity. Table 2: Association of the LCT rs4988235 polymorphism with dairy product consumption in the elderly Mediterranean population. Whole population CC LNP (n=357) Mean Age (years) Total energy intake (kcal/d) Total dairy products (g/d) Whole-fat milk (g/d) Partially skimmed milk (g/d) Skimmed milk (g/d) Condensed milk (g/d) Total milk (g/d). (SD). 67.5 (6.1). CT+TT. Men P. LP (n=583) Mean. LNP (n=133). (SD). 66.8 (6.1). CC Mean. 0.075. 2228.2 (646.3). 2204.4 (648.1) 0.599. 354.1 (198.6). 377.8 (231.8) 0.124. (SD). 66.9 (6.4). Women. CT+TT LP (n=205) Mean. 66.2 (7.0) 317.1 (198.5). CC LNP (n=283). (SD). 2404.6 (683.9) 2370.8 (661.3) 330.2 (187.0). P Mean. (SD). CT+TT. P. LP (n=378) Mean. (SD). 0.472. 67.8 (6.0). 67.1 (5.5). 0.153. 0.617. 2121.9 (599.7). 2113.9 (623.4). 0.882. 0.387. 368.5 (204.3). 410.7 (242.0). 0.045. 46.1 (134.7). 33.2 (112.3) 0.068. 45.4 (113.7). 41.6 (129.0). 0.440. 46.6 (146.1). 28.6 (101.9). 0.088. 112.2 (165.4). 122.8 (183.6) 0.642. 107.8 (160.0). 100.7 (148.8). 0.855. 114.8 (168.9). 134.8 (199.2). 0.491. 96.9 (166.0). 103.9 (182.9) 0.942. 84.0 (146.7). 73.0 (144.1). 0.292. 104.7 (176.5). 120.8 (199.0). 0.434. 0.2 (2.2) 255.4 (181.9). 0.2 (2.0). 0.311. 260.2 (199.0) 0.856. 0.1 (1.1). 0.1 (0.8). 0.589. 0.2 (2.7). 0.3 (2.5). 0.639. 237.3 (162.0). 215.4 (174.4). 0.125. 266.3 (192.5). 284.5 (207.4). 0.468. Whole-fat yoghurt (g/d). 21.2 (52.4). 21.4 (56.5). 0.541. 26.8 (60.3). 18.7 (49.7). 0.204. 17.8 (46.8). 22.8 (60.0). 0.818. Skimmed yoghurt (g/d). 39.4 (60.9). 55.0 (82.1). 0.004. 29.2 (54.6). 41.9 (69.7). 0.150. 45.6 (63.7). 62.1 (87.4). 0.016. 221.0 (185.6). 215.6 (184.9). 0.762. 265.1 (207.9). 317.6 (239.2). 0.014. Skimmed milk and yoghurt (g/d). 248.5 (200.6). 317.6 (239.2) 0.053. Whipped cream (g/d). 0.2 (1.2). 0.4 (4.6). 0.305. 0.2 (1.0). 0.8 (7.4). 0.699. 0.2 (1.3). 0.3 (1.5). 0.321. Milkshake (g/d). 0.9 (10.0). 1.4 (15.3). 0.478. 1.3 (14.1). 0.8 (6.7). 0.259. 0.6 (6.3). 1.8 (18.4). 0.975. Ricotta cheese or junket (g/d). 1.5 (8.4). 1.4 (8.0). 0.378. 1.4 (6.7). 1.4 (8.6). 0.991. 1.6 (9.2). 1.4 (7.6). 0.268. Petit Suisse cheese (g/d). 0.6 (4.8). 0.3 (3.0). 0.717. 0.0 (0.0). 0.0 (0.0). 0.980. 0.9 (6.1). 0.4 (3.5). 0.927. Spreadable cheese wedges (g/d). 0.9 (2.7). 1.4 (4.8). 0.646. 1.1 (3.1). 1.2 (4.1). 0.602. 0.8 (2.5). 1.5 (5.1). 0.323. Cottage cheese (g/d). 13.0 (14.4). 15.7 (20.2). 0.101. 9.5 (11.1). 12.6 (17.9). 0.296. 15.1 (15.7). 17.4 (21.2). 0.274. Other cheese (hard cheese) (g/d). 16.1 (18.1). 14.8 (14.5). 0.739. 18.0 (18.2). 16.0 (13.6). 0.706. 15.0 (18.0). 14.1 (14.9). 0.914. 3.1 (11.9). 2.5 (8.8). 0.615. 3.7 (13.4). 3.5 (11.5). 0.324. 2.8 (10.9). 2.0 (6.9). 0.805. 4.5 (21.2). 0.966. 1.8 (5.3). 2.4 (9.7). 0.755. 0.311. 15.0 (9.6). 16.5 (10.9). 0.115. Custard (g/d) Ice cream (g/d) Lactose (g/d). 1.8 (4.7). 3.2 (14.8). 0.873. 1.9 (3.7). 14.4 (9.2). 15.1 (10.4). 0.441. 13.4 (8.3). 12.6 (9.1). SD: Standard deviation. P values for the comparison of means between CC and CT+TT subjects for dairy products were carried out by the non-parametric Mann-Whitney U test. ScholarOne, 375 Greenbrier Drive, Charlottesville, VA, 22901. 23.
(25) Obesity. 1 2 3 4 5 6 7 8 9 10 11 12 13 14 15 16 17 18 19 20 21 22 23 24 25 26 27 28 29 30 31 32 33 34 35 36 37 38 39 40 41 42 43 44 45 46 47 48. Page 24 of 27. Table 3: Association of the LCT rs4988235 polymphism with anthropometric variables in the elderly Mediterranean population. CC. CT+TT. LNP (n=357). LP (n=583). Mean. (SD). Mean (SD). Age (years). 67.5 (6.1). 66.8 (6.1). 0.080. Height (m). 1.59 (0.08). 1.59 (0.08). 75.2 (12.3). Weight (Kg) 2. BMI (Kg/m ) Waist circumference (cm). Obesity prevalence (%) OR for obesity and (95% CI). P1. P2. P3. 0.392. 0.314. 0.333. 76.8 (11.7). 0.044. 0.032. 0.021. 29.7 (4.2). 30.6 (4.2). 0.003. 0.004. 0.002. 101.1 (11.8). 103.5 (11.5). 0.005. 0.002. 0.002. 45.4. 53.7. 0.014. 1 (reference). 1.39 (1.07-1.82). 0.014. 1.39 (1.06-1.81) 1.37 (1.03-1.81). 0.017 0.029. SD: Standard deviation P1: Unadjusted P value P2: Model adjusted for sex and age P3: Model adjusted for sex, age, diabetes, total energy intake and physical activity. ScholarOne, 375 Greenbrier Drive, Charlottesville, VA, 22901. 24.
(26) Page 25 of 27. 1 2 3 4 5 6 7 8 9 10 11 12 13 14 15 16 17 18 19 20 21 22 23 24 25 26 27 28 29 30 31 32 33 34 35 36 37 38 39 40 41 42 43 44 45 46 47 48 49 50 51 52 53 54 55 56 57 58 59 60. Obesity. Table 4: Association of the LCT rs4988235 polymphism with plasma lipids, glucose, and blood pressure. Adjusted means*. CC. CT+TT. LNP (n=357). LP (n=583). Mean Total cholesterol (mg/dL). (SE). Mean. (SE). P. 206.6 (2.2). 204.4 (1.8). 0.418. LDL-C (mg/dL). 129.67 (2.09). 127.10 (1.64). 0.324. HDL-C (mg/dL). 51.3 (0.7). 52.1 (0.6). 0.349. Triglycerides (mg/dL)). 136.7 (4.6). 129.3 (3.6). 0.198. Fasting glucose (mg/dL)**. 121.3 (1.8). 121.7 (1.4). 0.868. Systolic blood pressure (mm Hg). 146.3 (1.2). 147.4 (0.9). 0.422. Diastolic blood pressure (mm Hg). 81.7 (0.7). 82.6 (0.5). 0.309. SE: Standard error *Means were adjusted for sex, age and BMI **: Means were additionally adjusted for diabetes. ScholarOne, 375 Greenbrier Drive, Charlottesville, VA, 22901. 25.
(27) Obesity. 1 2 3 4 5 6 7 8 9 10 11 12 13 14 15 16 17 18 19 20 21 22 23 24 25 26 27 28 29 30 31 32 33 34 35 36 37 38 39 40 41 42 43 44 45 46 47 48 49 50 51 52 53 54 55 56 57 58 59 60. Page 26 of 27. LEGENDS TO FIGURES. Figure 1: Modulation by dairy lactose intake of the association between the LCT -13910C>T polymorphism and waist circumference (cm) in the elderly Mediterranean population: Panel A, predicted values of waist circumference by the LCT -13910C>T (n=357 CC individuals and n=576 T-allele carriers (8 outliers with lactose intake higher than 50 g/d were removed to improve normality for the statistical analysis) depending on the lactose consumed (as continuous) are depicted. Predicted values were calculated from the regression models containing lactose intake, the LCT polymorphism, their interaction term, and the potential confounders [sex, age (as continuous), diabetes (as categorical), total energy intake (as continuous) and physical activity (as continuous]. Predicted values for this model were obtained for each individual. The P value for the interaction term was obtained in the multivariate interaction model. Panel B represents adjusted means of waist circumference (cm) in the study subjects (n=940) depending on the LCT -13910C>T polymorphism according to 3 strata of lactose intake: low [<=8 g lactose/d; 20% of the population (n=68 CC, 122 CT+TT)], intermediate [ 8-24 g lactose/d; 50% of the population (n=188 CC, 284 CT+TT)], and high [>24 g lactose/d; 30% of the population (n=101 CC, 177 CT+TT)]. Estimated means were adjusted for sex, age (as continuous), diabetes (as categorical), total energy intake (as continuous) and physical activity (as continuous). P values for genotype comparisons in each strata were estimated after multivariate adjustment for the covariates indicated above. Bars indicate standard error (SE) of means.. ScholarOne, 375 Greenbrier Drive, Charlottesville, VA, 22901. 26.
(28) Page 27 of 27. Fig 1. A P for interaction LCT genotype x lactose intake: 0.044. CT+TT (lactase persistent). CC (lactase non-persistent). Waist circumference (cm). Adjusted means. 1 2 3 4 5 6 7 8 9 10 11 12 13 14 15 16 17 18 19 20 21 22 23 24 25 26 27 28 29 30 31 32 33 34 35 36 37 38 39 40 41 42 43 44 45 46 47 48 49 50 51 52 53 54 55 56 57 58 59 60. Obesity. 108. B 106. P=0.012 P=0.808 104. P=0.009. 102. 100 CC. CT+TT. <8 g/d (<1 cup milk/d). CC. CT+TT. 8-24 g/d (1-2 cups milk/d) Lactose intake categories. CC. CT+TT. >24 g/d (>2 cups milk/d). ScholarOne, 375 Greenbrier Drive, Charlottesville, VA, 22901. 27.
(29)
Figure
Documento similar
Among the different polymorphisms studied, only a significant association was observed between the lower expression MAO-A genotype of the MAOA polymorphism and
In the previous sections we have shown how astronomical alignments and solar hierophanies – with a common interest in the solstices − were substantiated in the
Moreover, given that data from another meta-analysis supports a negative association between total dairy product intake and CVD risk [12], together with the null association
The expansionary monetary policy measures have had a negative impact on net interest margins both via the reduction in interest rates and –less powerfully- the flattening of the
rated by the greater abundance of saline soils in arid environments and by that of other leached ones in Mediterranean environments (Luvisols and Planosols). 6b) that
This article shows the prevalence of poor sleep quality and its association with lifestyle habits in a population recruited in community pharmacies, in Salamanca (Spain).. A
In the “big picture” perspective of the recent years that we have described in Brazil, Spain, Portugal and Puerto Rico there are some similarities and important differences,
The objective of the present study is to determine the association between anthropometric measures such as Body Mass Index (BMI), Waist Circumference (WC) and
