Mangrove forest composition and structure in Las Perlas Archipelago, Pacific Panama
14
0
0
Texto completo
(2) The structure of a mangrove forest at any point in time is a function of its successional stage, species composition, zonation, propagule dispersal, growth and survival. These are all influenced by a number of biotic factors such as propagule variables, propagule predation, herbivory, human interference and interspecific competition. Additionally, abiotic factors are also influential including storm damage, rainfall, tidal influence, freshwater input, temperature, sedimentation rate, nutrient availability and light (Krauss et al. 2008). To analyse all of the above components and relate them to mangrove forest structure, and each other, is a complicated exercise in ecological modelling but attempts have been made (Twilley et al. 1998, Schaeffer-Novelli et al. 2005, Twilley & Rivera-Monroy 2005). Mangroves are, however, under threat from a variety of anthropogenic activities, and it is estimated that one-third of the world’s mangrove forests have already been lost (Alongi 2002). Large areas of mangrove forests are cleared for shrimp aquaculture in developing countries (Primavera 1993, Adeel & Pomeroy 2002). Other impacts include coastal urbanization, wood extraction, agriculture conversion, salt production and tin mining (Ong 1995, Macintosh 1996, Alongi 2002, Benfield et al. 2005, Walters 2005). Oil spills may also cause large-scale damage to mangrove ecosystems (Duke et al. 1997). As well as direct impacts, mangroves, due to their coastal nature, could be under threat from global warming if these results in sea level rise (Field 1995). Within Pacific Panama, most of the mangroves in the Gulf of Panama are classified as either critical or endangered, on the conservation status scale, due to losses associated with human development (D’Croz 1993). Areas of mangroves under threat from human interference and not previously studied should be priority targets for research. With this in mind the Las Perlas Archipelago (LPA) in Pacific Panama was selected as a survey location as the forests found on the islands meet these criteria. Whilst there have been several mangrove studies conducted in Panama (Rabinowitz 1975, 858. Rabinowitz 1978a,b,c, Smith et al. 1989, Duke et al. 1997, Benfield et al. 2005, Defew et al. 2005, Lovelock et al. 2005) no scientific research to the authors’ knowledge has been carried out on the mangroves of LPA. This is largely due to the isolated nature of the islands, which lie some distance from the mainland coast of Panama and Panama City. Another consequence of the LPA’s isolated nature is the lack of development on the islands leading to what can be regarded as a largely pristine environment. However, there is an increasing level of interest for further coastal tourist developments in LPA such as on Isla del Rey (Fig. 1) and sand extraction operations in marine and coastal areas have been licensed for some locations. The marine environments of the LPA were designed in 2007 as a protected area under the status of a Marine Special Management Zone. It was therefore considered desirable and timely to collect data on mangrove forests within the LPA before they potentially become affected by future development. The aims of the study were to assess the structure of mangrove forest on the two largest islands, Isla del Rey and Isla San José, and to establish permanent plots at these sites to allow future monitoring of mangrove forest structure. MATERIAL AND METHODS Study Site: The LPA lies between 08°40’19”-08°11’46” N, 79°03’49”-78°46’31” W within the Gulf of Panama (Fig. 1A). It is composed of 250 mostly uninhabited basaltic rock islands and islets that lie within the 50m isobath and falls within the Tropical Eastern Pacific (TEP) biogeographic zone. The LPA has a tropical moist climate with annual rainfall between 250cm and 300cm. The mean tidal range for the archipelago is 3.8m with maximum of ca. 6m (Glynn & Maté 1996). The LPA was designated as a marine protected area, locally known as a Marine Special 688km2 and encompasses all of the islands and Bajo Trollope, a rocky shallow bank at the South-East corner of the archipelago (Fig. 1A).. Rev. Biol. Trop. (Int. J. Trop. Biol. ISSN-0034-7744) Vol. 58 (3): 857-869, September 2010.
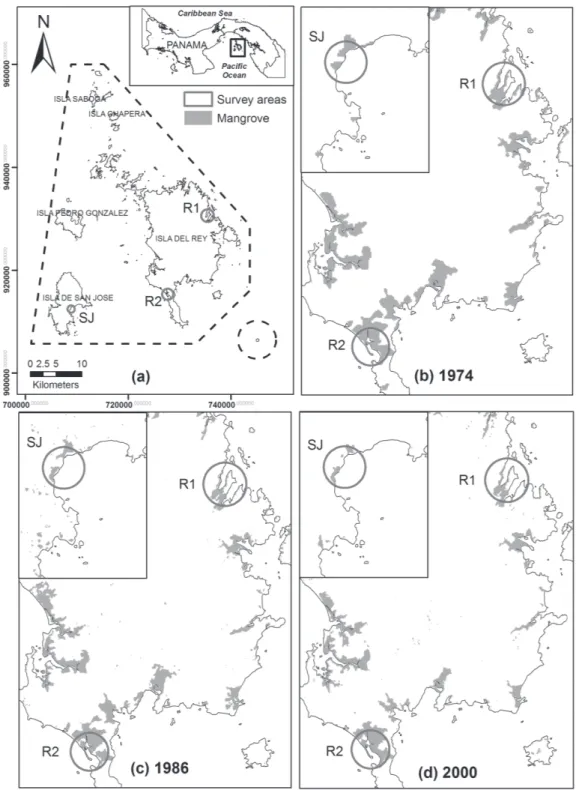
(3) Fig. 1. A. The location of Las Perlas Archipelago in Pacific Panama and the survey sites for this study as indicated; (B.-D.) the distribution and decline of mangrove forest areas in the archipelago since 1974 mapped using Landsat satellite images.. Rev. Biol. Trop. (Int. J. Trop. Biol. ISSN-0034-7744) Vol. 58 (3): 857-869, September 2010. 859.
(4) The MSMZ was created to implement an integrated coastal management approach including the production side of fisheries and tourism and long-term landscape conservation planning (sensu Margules & Pressey 2000). The law protects coral reefs, reef fish, mangrove forests, except where there is an overriding need for tourism development, and prohibits the use of certain fishing methods, allowing only artisanal line fishing. Whilst land use is unregulated under Law 18, the relatively pristine state of the islands is a conservation priority. Over 98.2km2 of forest, including some mangrove forest and the largest watersheds on Isla del Rey were designated a Hydrological Reserve in October 2006, while the entire island of San José, including its mangrove forests, is protected as a Private Nature Reserve. Distribution of mangrove forest: Mangrove forest was mapped in a previous study by Guevara (2005) from three Landsat satellite images acquired on 23rd February 1974 (Landsat MSS), 1 February 1986 (Landsat TM) and 23 November 2000 (Landsat ETM+). Seven land cover types, including mangrove forest, were predefined and ground truth data were collected in May 2004. A maximum likelihood supervised classification was performed of the year 2000 image using ground truth data and a combination of bands 1,2,3,4,5 and 7 in Erdas Imagine 8.7. Unsupervised classifications were conducted on the 1974 and 1986 datasets using the same number of categories. Areas of mangrove forest were calculated for each island greater than 20ha in size. Deforestation rates of mangroves were calculated from 1974 to 1986 and 1986 to 2000. Selection of survey sites: Three study sites chosen in the LPA were selected from the land cover mapping using Landsat ETM+ (Guevara 2005) and previous visual surveys of the area by boat. These sites were chosen as they were located on islands with some of the largest areas of mangroves in the LPA, were felt to be representative of the general forest structure, had experienced decline in forest area, and 860. were easily accessible. The distribution of mangroves within the archipelago and the location of the three sites chosen are shown in Fig. 1A. The two sites on Isla del Rey are subsequently referred to as R1 and R2, and one site on Isla San José (SJ). R1, R2 and SJ were located at 08°24’ N, 078°51’ W; 08°16’ N, 078°55’ W; and 08°14’ N, 079°06’ W respectively. During the month of May 2006, within each of these three sites, five 10 m by 10 m plots were randomly chosen and marked out using four PVC poles inserted into the sediment (sensu English et al. 1997, Benfield et al. 2005). Their locations were recorded using GPS and photographic records were taken to allow re-location. At each plot measuring tapes were laid between the PVC poles to represent x and y-axes from a corner acting as 0,0. This produced a grid system to obtain a position of individual trees. The pole acting as 0,0 was marked and the orientation of each plot in relation to 0,0 was common to all plots (0,0 was located on the most seaward side of the plot on the left when back was to the sea). Data collection and processing: All live trees greater than 1m in height above the sediment surface were tagged with marking tape so they could be identified. This height restriction ensured the inclusion of saplings, defined as trees greater or equal to 1m in height with a girth of less than 4cm (English et al. 1997). For each individual, the species was noted, height above ground sediment measured and the x and y coordinates taken to allow future monitoring. Tree diameter at breast height (DBH) was measured at 130cm from the ground (Brokaw & Thompson 2000) using a pre-calibrated tape measure when DBH was greater or equal to 2.5cm. In circumstances when the tree branched below this height standardised rules were followed (sensu English et al. 1997, Benfield et al. 2005). Trees measured for DBH were marked at the location where this variable was recorded and numbered using stainless steel tags to assist future relocation and recording.. Rev. Biol. Trop. (Int. J. Trop. Biol. ISSN-0034-7744) Vol. 58 (3): 857-869, September 2010.
(5) Within each plot, data on seedlings were also taken. Many plots had very low numbers of seedlings (less than 50) allowing the direct measurement of every seedling. For those plots that contained greater than 50 seedlings, five 1m by 1m subplots were randomly chosen and marked using four PVC poles so that they could be monitored (sensu CARICOMP 2001). One meter rules were used to form the x and y axis. The species, height and coordinates of the seedlings in subplots (or within the whole plot where there were less than 50 seedlings) were recorded. Seedlings were also numbered with a stainless steel tag. The importance value of each species in each plot for the adult/sapling population was calculated using the equations given by Cintrón & Schaeffer-Novelli (1984). This was to ascertain the contribution of each species to the mangrove forest and the importance value was used as an indicator of the degree of monospecificity (Cintrón & Schaeffer Novelli 1984, English et al. 1997). To examine differences in height and DBH between sites Kruskal-Wallis tests and Dunn’s multiple comparison procedures were implemented in SigmaStat. Sediment samples: Within each plot one sediment-surface sample of approximately 1kg (wet weight) was taken for analysis of sediment characteristics (organic carbon content, carbonate content and particle size). Samples for sediment analysis were frozen until required. In the laboratory these samples were assessed for particle size distribution by passing dried subsamples through a stack of differently sized mesh sieves (63, 125, 250, 500, 1.0, 2.0µm) and classified using the Wentworth scale from. silt-clay fraction to very-coarse sand (Wentworth 1929). The percentages of carbonate and organic carbon contents of the sediments were derived respectively by treatment with hydrochloric acid and combustion (sensu Walkley & Black 1934, Barnes 1959). RESULTS Mangrove forest distribution and change: A summary of mangrove area covered and area loss is provided in Table 1 and the area loss over the period studied is presented geographically in Fig. 1(B-D). The greatest loss of mangrove forest in the LPA during the period studied occurred between 1974 and 1986. An area of 965ha was lost according to the analysis performed on the satellite data, of which the majority of the loss (90.3%) was on Isla del Rey and Isla San José. Between 1986 and 2000 mangrove forest in the LPA also saw a decrease in cover, although not as much as in the previously examined period, of which Isla del Rey and Isla San José combined again represented the majority of the loss (77.1%). Visual examination of land cover maps for the same period also derived from the Landsat images of changes in land cover type revealed that the mangroves were being replaced during this period by regenerating forest (forest regenerating after logging and burning), brush wood-stubble and farmland, grasslands and paddocks (Guevara 2005). This indicates that the mangroves lost were due to human extraction and agricultural development. Adult and sapling data: A summary of adult, sapling and seedling parameters derived from the field data is given in Table 2 and. TABLE 1 Areas of mangrove and area lost in Las Perlas Archipelago (LPA) marine protected area and on Isla del Rey and Isla San Jose as calculated from three classified Landsat satellite images. LPA Isla del Rey Isla San Jose. 1974 Area(ha) 2867.7 2288.2 105.9. 1986 Area(ha) 1901.5 1563.9 85.1. 2000 Area(ha) 1653.4 1356.3 68.7. Rev. Biol. Trop. (Int. J. Trop. Biol. ISSN-0034-7744) Vol. 58 (3): 857-869, September 2010. Area change (ha/y) 1974-1986 -48.3 -60.4 -1.7. Area change (ha/y) 1986-2000 -17.7 -14.8 -1.2. 861.
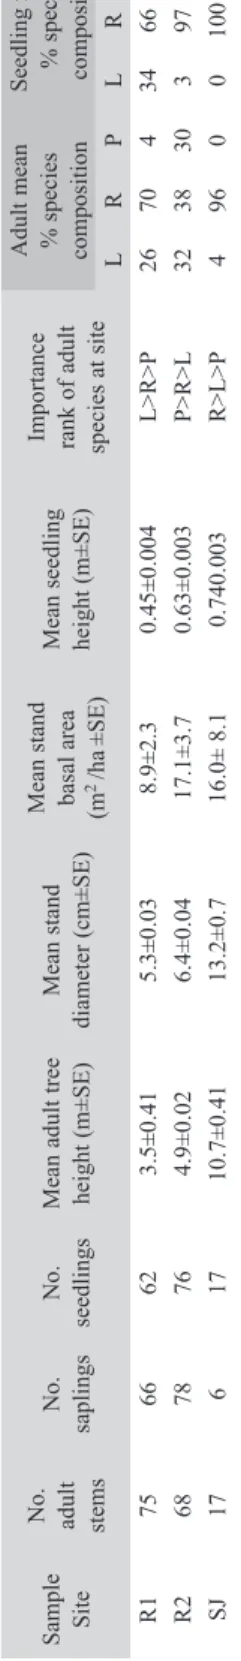
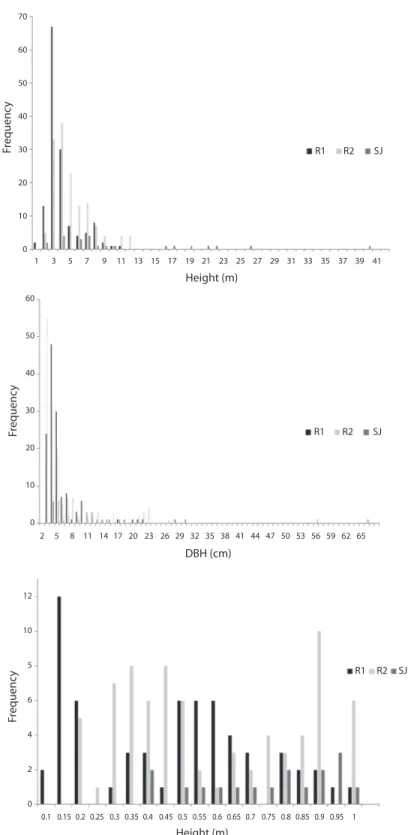
(6) L>R>P P>R>L R>L>P 0.45±0.004 0.63±0.003 0.740.003 8.9±2.3 17.1±3.7 16.0± 8.1 5.3±0.03 6.4±0.04 13.2±0.7 3.5±0.41 4.9±0.02 10.7±0.41 62 76 17 66 78 6 75 68 17 R1 R2 SJ. Adults classified as stems which were >1m in height and D130>4cm; saplings>1m in height and D130 >2.5cm but <4cm; seedlings <1m in height (English et al. 1997). Mean stand basal area and mean stand diameter calculated only for stems with D130>2.5cm. L=Laguncularia racemosa; R=Rhizophora mangle; P=Pelliciera rhizophorae.. Seedling mean % species composition L R P 34 66 0 3 97 0 0 100 0 Adult mean % species composition L R P 26 70 4 32 38 30 4 96 0 Importance rank of adult species at site Mean seedling height (m±SE) Mean stand basal area (m2 /ha ±SE) Mean stand diameter (cm±SE) Mean adult tree height (m±SE) No. seedlings No. saplings No. adult stems Sample Site. TABLE 2 Mean number of adults, saplings and seedlings per plot (10mx10m) which, for seedlings, was extrapolated from the five 1m2 subplots where required 862. Fig. 2. All sites contained a full vertical structure with adults, saplings and seedlings. R1 and R2 had similar numbers of saplings and seedlings, but a greater number of adults. However, SJ had a similar number of adults and seedlings but less saplings in comparison. The number of adult trees was very similar in R1 and R2 and both were much higher than in SJ. SJ had the highest mean DBH compared to R1 and R2 (Table 2) and the DBH of all sites was found to be significantly different from each other (H=12.665, df=2, p=0.002). Fig. 2B illustrates the distribution of DBH at the three sites, all of which show a skewed distribution to the left, indicating that trees generally had a lesser girth. R1 and R2 both showed a similar distribution and median DBH classes (2cm and 3cm respectively). R2 had a slightly higher maximum value (27cm) compared to R1 (22cm). SJ had a similar median class value (4cm) to R1 and R2 but it had a much larger DBH range, with a maximum 66cm, far lower frequencies and an incomplete range of classes (Fig. 2B). The mean total stand basal area was highest in R2, followed by SJ which had a high mean total stand basal area despite having a much lower number of adult trees. The mean height of trees in SJ was greatest and those in R1 were shortest and the mean height of trees was found to be significantly different between all the sites (H=53.260, df=2, p<0.001). Fig. 2A shows that R1 and R2 are very similar in adult height distribution, both being skewed to the left indicating that they are dominated by relatively shorter trees (most frequent class 2.5m at R1 and 3.0 and 3.5m at R2). R2 had a maximum height of 12m while the maximum at R1 was 10.5m. SJ exhibited a wider range in height classes and taller trees than either of the sites on Isla del Rey, having a maximum height of 40m (Fig. 2A). The height classes of SJ were also skewed to the left but its most frequent size class was much larger, at 6m, and its range was not continuous like R1 and R2, with many intermediate height classes unrepresented. Three species of mangroves were present, and each of the three sites was different in Rev. Biol. Trop. (Int. J. Trop. Biol. ISSN-0034-7744) Vol. 58 (3): 857-869, September 2010.
(7) 70. 60. Frequency. 50. 40. 30. R1. R2. SJ. 20. 10. 0 1. 3. 5. 7. 9. 11 13 15 17 19 21 23 25 27 29 31 33 35 37 39 41. Height (m) 60. 50. Frequency. 40. 30. R1. R2. SJ. 20. 10. 0 2. 5. 8 11 14 17 20 23 26 29 32 35 38 41 44 47 50 53 56 59 62 65. DBH (cm). 12. 10. Frequency. 5. R1. R2. SJ. 6. 4. 2. 0 0.1 0.15 0.2 0.25 0.3 0.35 0.4 0.45 0.5 0.55 0.6 0.65 0.7 0.75 0.8 0.85 0.9 0.95 1. Height (m). Fig. 2. A. The distribution of adult height classes; (B.) tree diameter at breast height (DBH); and (C.) seedling height at the three survey sites.. Rev. Biol. Trop. (Int. J. Trop. Biol. ISSN-0034-7744) Vol. 58 (3): 857-869, September 2010. 863.
(8) terms of their most important species (Table 2). At R1 Laguncularia racemosa was the most important, at R2 Pelliciera rhizophorae and at SJ Rhizophora mangle. Both sites on Isla del Rey had all three species but only L. racemosa and R. mangle were present at SJ. The percentage composition confirms the dominance of R. mangle at all three sites. However, although R. mangle comprised a greater percentage of the adults surveyed, at R1, L. racemosa was found to be the most important species (Table 2). Analysis of species composition shows a much more even spread of species at R2 compared to the other sites. Seedling data: Table 2 shows that R2 had the highest mean number of seedlings, although there was much variation between plots surveyed. SJ had the lowest number of mean seedlings. The mean height of seedlings was greatest in SJ and those in R1 were shortest, the same pattern as observed for the adults (Table 2), and the mean height of trees was. found to be significantly different between SJ and R1 (Q=4.027, df=1, p<0.05) and SJ and R2 (Q=2.629, df=1, p<0.005) but not between R1 and R2. Fig. 2C describes the height distribution of seedlings at the three sites, and shows that R1 and R2 had a similarly wide range in seedling height distribution. R1 had an almost normal distribution apart from high frequencies at 10 and 15cm. The height distribution of R2 was roughly similar with no seedling less than 15cm. The height distribution of SJ had a much narrower range than R1 and R2, with a lowest value class of 40cm and a median of 95cm (Fig. 2C). At all three sites R. mangle was the dominant species amongst seedlings, with L. racemosa being the second most abundant at R1 and R2, although it was not found at SJ (Table 2). Seedlings of P. rhizophorae were not recorded at any of the sites. Sediment Data: Table 3 shows the average sediment composition of the three sites in terms of percentage organic carbon, carbonate and. TABLE 3 Organic carbon, carbonate and particle size analysis (Wentworth classification) in terms of percentage total for all plots at the three sites surveyed. Very coarse sand (VC Sand), coarse sand (C Sand), medium sand (M Sand), fine sand (F sand), very fine sand (VF Sand) Sample Site. % Organic C. % Carbonate. R1 R2 SJ. 0.5 2.0 12.0. 6.0 29.1 13.3. Granule 3.4 0.8 7.8. VC Sand 2.3 2.0 4.1. particle size. R1 had lower organic carbon and carbonate content than the other two sites and was composed of medium to very fine sand. R2 had the highest carbonate content of the three sites and was also dominated by medium to fine sand. SJ showed the highest levels of organic carbon and a large proportion of its composition was from the silt-clay fraction. DISCUSSION Species composition: The species found at the three sites studied are typical for this 864. Particle Size Analysis (%) C Sand M Sand F Sand 4.8 23.3 44.6 4.9 29.2 50.1 5.2 8.2 11.5. VF Sand 19.5 5.9 15.7. Silt-Clay 2.1 7.1 47.5. region, with R. mangle and L. racemosa being particularly common but P. rhizophorae less so. The presence of only three species is not uncommon as Central American mangroves are generally species poor (Jimenez 1992, Murray et al. 2003). L. racemosa is usually regarded as a pioneer species that is out-competed as the forest develops and therefore moves back to higher elevations. The importance of L. racemosa at R1 either indicates that this area is an early stage community, or alternatively it could be explained by mangroves at this site being distributed across a relatively narrow band. Rev. Biol. Trop. (Int. J. Trop. Biol. ISSN-0034-7744) Vol. 58 (3): 857-869, September 2010.
(9) between the shore and the terrestrial forest, resulting in larger specimens of L. racemosa in a very narrow band behind the more numerous R. mangle. The importance of P. rhizophorae at R2 is noteworthy given P. rhizophorae has a very limited distribution and Jimenez (1984) reported that significant stands of this species are found only in neighbouring Costa Rica. P. rhizophorae was found to have a high basal area, implying it must be relatively well developed in this area. This species requires high rainfall or terrestrial run-off (Jimenez 1984) and its distribution at the site corresponds to a creek flowing from the land. The species composition of SJ was the most monospecific of the three sites, being dominated by R. mangle. This is not particularly unusual as it is common for mangroves to form monospecific stands, and there are examples of R. mangle out-competing L. racemosa (Ball 1980, Sherman et al. 2000). Additionally, R. mangle is known to be the most common species in the area (Lacerda et al. 2002). The seedling species composition of R1 and R2 was found to differ from the adult population; for R1 there were no individuals of P. rhizophorae present, although the proportion of L. racemosa and R. mangle were roughly representative of the adult species composition. At R2 there were also no seedlings of P. rhizophorae despite it being the most important species in the adult phase. Tomlinson (1999) states that P. rhizophorae experiences competition from R. mangle, whose seedlings were almost completely dominant and this may offer an explanation for this pattern. The seedling cohort at SJ is entirely of R. mangle, which is unsurprising given the adult species composition. However, it was the only site not to have seedlings of L. racemosa, a common species in the surrounding area. It seems unlikely that propagules of L. racemosa were not reaching the site but there may be factors preventing their establishment and/or they are outcompeted by R. mangle. Forest structure and recovery: For both R1 and R2, the mean basal area for the site. was low when compared to other values for the Pacific Central America region, which range from 6 to 96.4m2/ha (Pool et al. 1977, Jimenez 1992). Additionally, the density of adult trees was also low when compared to other areas (Ong et al. 1995, Cox & Allen 1999). The heights recorded fell within the dwarf and medium range outlined by Murray et al. (2003) and were substantially less than the values of 16m and 22m reported in Costa Rica (Pool et al. 1977) and in other Panamanian mangroves (Mayo 1965) respectively. However, Tomlinson (1999) notes that mature trees of P. rhizophorae can be expected to grow between 5 and 10m, and the heights recorded in R2 for this species fell within this range. The mean heights of the seedlings were well spread but the density of seedlings at the sites was low. It appears that the seedlings were being prevented from establishing by a possible combination of limiting factors such as human intervention, salinity, light, nutrients and predation (Lopez-Hoffman et al. 2007, Krauss et al. 2008). Examination of the classified satellite data (Fig. 1B-D) reveals that mangrove forest was lost in both R1 and R2 over the period 19741986 and 1986-2000. However, whilst in this latter period there was a net loss, visual inspection of the classified satellite images showed that there was some regrowth between 19862000 indicating that the forest is spatially dynamic (Dahdouh-Guebas & Koedam 2002). During the first period, agricultural activity was known to be higher compared to the later period, when agriculture decreased and communities started to rely more on fishing. This was due to improved transport links to the LPA allowing more provisions to reach the island communities by air and sea, thus reducing the need to grow their own crops (Guevara 2005). The reduction in agricultural pressure appears to have allowed some recovery and growth of mangroves in these areas, although the growing older population may return to the area and expand agricultural activities by the end of the decade (pers. observ.) A combination of the satellite data and the proportion of adults to saplings to seedlings,. Rev. Biol. Trop. (Int. J. Trop. Biol. ISSN-0034-7744) Vol. 58 (3): 857-869, September 2010. 865.
(10) seems to indicate that R1 and R2 are probably areas of rejuvenating forest with elements of a static nature, where seedlings are originating from young trees/saplings (sensu DahdouhGuebas & Koedam 2002). The growth at these sites could have previously been restricted though felling and agriculture development and/or by other abiotic or biotic factors. R1 is a fringing forest and it may be that it is the least productive of the three community types owing to a lack of nutrients (sensu Lacerda et al. 2002). It was noted that little or no leaf litter was found on the sediment surface at R1 and the sediment analysis contained relatively little organic carbon. It could be inferred from this that the sediment may also have had a lower nutritive quality, compounding the slow rate of recovery or that the tidal regime removes the litter. SJ had a low mean stand basal area, a very low density of adult stems and trees had a wide range of heights and DBH, with several trees over 20m and having a DBH over 25cm. The site was a basin forest community behind a large sand bank and Lacerda et al. (2002) note that basin communities retain nutrients and therefore can have higher productivity. This is corroborated by the sediment analysis which showed a higher organic carbon content relative to the other two sites. Whilst there were seedlings at this site, there was none under 40cm and there were relatively less seedlings compared to the other two locations. As previously mentioned, for sites R1 and R2 it appears that the seedlings are being prevented from establishing by a possible combination of limiting factors. However, possible explanations may be reduced irradiance due to the increased canopy cover of mature trees or predation by grapsid crabs which have been noted to increase in abundance when larger tree canopies develop (Smith 1992, Dahdouh-Guebas et al. 1998). The classified satellite data (Fig. 1B-D) reveals that mangrove forest was lost over both periods examined in the area of the study site and has not shown recovery, indicating that it is spatially static in nature. This information, 866. coupled with the proportion of adults, saplings and seedlings, and its developed structure suggests that SJ is probably a mature forest for the area that is relatively static in nature. This study has found that a variety of forest types and structures, with different dominant species exist within the LPA. The sites studied showed a variety of structures and stages of development, and each had a different dominant species in terms of importance rank. The area of SJ showed the most developed structure of the three sites, which is of interest as mature forests are generally an exception and forests with such a maturity were observed only once in early surveys of the LPA by boat. Additionally, unpublished work on the genetics of R. mangle in the LPA using microsatellite analysis has demonstrated a mixed gene flow between islands of the LPA and the mainland but that the genetic diversity of the LPA is higher than many other areas of Pacific Central America. Previous analysis of satellite imagery of LPA forest cover has provided some indications of forest dynamics from snapshots since 1974 and the detailed study of sample sites in 2006 in three mangrove areas of Las Perlas Archipelago has added more understanding of actual structure and potential trends in mangrove dynamics. It appears from these that the mangrove forests of the LPA offer an interesting array of attributes for further research and it is hoped that the establishment of permanent plots in this study will aid further research and monitoring, as recommended for the management plan of the marine protected area. It would be highly desirable to gather further data on these poorly studied mangroves and to monitor change brought about by the future planned development on the islands which in our opinion is the only potential threat this habitat. Historical changes in Las Perlas archipelago have been exclusively associated to the expansion of the agriculture frontier and only affected the largest island of Del Rey. The mangrove areas are not adequate and extensive for aquaculture. The creation of the marine protected area regulates and prohibits fishing. Rev. Biol. Trop. (Int. J. Trop. Biol. ISSN-0034-7744) Vol. 58 (3): 857-869, September 2010.
(11) activities within the archipelago, banned specifically the extraction of Anadara spp. from mangrove forest which is the only associated resource extracted by local fishermen. The law also includes the prohibition to remove or destroy the mangroves. The management plan for the protected area is currently been drafted and includes further restrictions to the use of mangrove forest including the creation of zones defined as marine reserves where no extraction is allowed.. otros factores. SJ fue dominado por Rhizophora mangle y parece tener un bosque maduro con árboles adultos grandes y pocos jóvenes. Éste sitio no parece mostrar la misma extensión de rebrote espacial de los otros dos sitios entre 1986-2000 y es relativamente estático. El establecimiento de parcelas permanentes y el monitoreo serán útiles en la implementación del plan de manejo, ya que los manglares del LPA tienen una variedad estructural y podrían estar sujetos a un mayor desarrollo costero.. ACKNOWLEDGMENTS. REFERENCES. Funding for this research was provided by the UK’s Darwin Initiative Fund, Smithsonian Tropical Research Institute, and Heriot-Watt University. The authors thank C. Guevara, J. Agujetas and D. Cusan who assisted the authors during field work. We thank the Government of Panama for giving permission to work in the archipelago and the anonymous reviewers of this paper who provided constructive comments.. Adeel, Z. & R. Pomeroy. 2002. Assessment and management of mangrove ecosystems in developing countries. Trees 16: 235-238.. RESUMEN Los bosques de manglar son ecosistemas importantes que proveen muchos servicios, pero éstos están bajo la amenaza de una variedad de actividades humanas y grandes áreas de manglar continúan perdiéndose en Panamá. Este estudio está enfocado en la estructura de manglar de las dos islas más grandes del Archipiélago de Las Perlas en el Pacifico Panameño (LPA), la Isla del Rey y la Isla San José. La evaluación de las imágenes del satélite Landsat revela la pérdida de manglares en LPA de 965ha en el periodo entre 1974-1986, y de 286ha en el periodo 1986-2000. La mayor parte de la pérdida (>77%) en las dos islas estudiadas fue debida a la extracción de madera y al desarrollo agrícola. En mayo de 2006, se establecieron parcelas permanentes siguiendo el protocolo de CARICOMP en dos sitios en la isla del Rey (R1 y R2) y un sitio en la Isla San José (SJ) donde especies, altura y diámetro a la altura de la copa de árboles adultos y jóvenes fueron registradas. La estructura del bosque difirió en los tres sitios, sin embargo R1 y R2 fueron los más similares. En R1, Laguncularia racemosa fue la especie más dominante y Pelliceria rhizophora en R2. El análisis de la estructura del bosque y de imágenes clasificadas indicó que estos sitios son espacialmente dinámicos y parecen estar regenerándose. La estructura del bosque indica que el crecimiento en los sitios ha estado limitado por las actividades humanas y posiblemente por. Palabras clave: estructura manglar, Laguncularia, Rhizophora Pacífico Panameño, Archipiélago de Las Perlas.. Alongi, D.M. 2002. Present state and future of the world’s mangrove forests. Environ. Conserv. 29: 331-349. Ball, M.C. 1980. Patterns of secondary succession in a mangrove forest of Southern Florida. Oceologia 44: 226-235. Bandaranayake, W.M. 1998. Traditional and medicinal uses of mangroves. Mangroves and Salt Marshes 2: 133-148. Baran, E. & J. Hambrey. 1998. Mangrove conservation and coastal management in Southeast Asia: what impact on fishery resources? Mar. Pollut. Bull. 37: 431-440. Barnes, H. 1959. Apparatus and methods of oceanography. Part one: Chemical. Allen & Unwin, London, England. Benfield, S., H.M. Guzman & J.M. Mair. 2005. Temporal mangrove dynamics in relation to coastal development in Pacific Panama. J. Environ. Manage. 17: 1-14. Brokaw, N. & J. Thompson. 2000. The H for DBH. Forest Ecol. Manag. 129: 89-91. Cardona, P. & L. Botero. 1998. Soil characteristics and vegetation structure in a heavily deteriorated mangrove forest in the Caribbean coast of Colombia. Biotropica 30: 24-34. Caribbean Coastal Marine Productivity CARICOMP 2001. CARICOMP Methods Manual Levels 1 & 2: Methods for Mapping and Monitoring of Physical and Biological Parameters in the Coastal Zone of the Caribbean. Centre for Marine Sciences, University of the West Indies, Kingston, Jamaica.. Rev. Biol. Trop. (Int. J. Trop. Biol. ISSN-0034-7744) Vol. 58 (3): 857-869, September 2010. 867.
(12) Cintrón, G. & Y. Schaeffer-Novelli. 1984. Methods for studying mangrove structure, p. 91-113. In S.C. Snedaker & J.G. Snedaker (eds.). The Mangrove Ecosystem: Research Methods. Monographs on Oceanographic Methodology, series 8. UNESCO, France. Cox, E.F. & J.A. Allen. 1999. Stand structure and productivity of the introduced Rhizophora mangle in Hawaii. Estuaries 22: 276-284. Dahdouh-Guebas, F. & N. Koedam. 2002. A synthesis of existent and potential mangrove vegetation dynamics from Kenyan, Sri Lankan and Mauritanian casestudies. Mededelingen der Zittingen Bulletin des Seances 48: 487-511. D’Croz, L. 1993. Status and uses of mangroves in the Republic of Panama, p. 115-127. In L.D. Lacerda (ed.). Conservation and Sustainable Utilisation of Mangrove Forests in Latin America and Africa regions Part I: Latin America. ITTO/ISME Mangrove Ecosystems Technical Reports, Okinawa, Japan. Defew, L.H., J.M. Mair & H.M. Guzman. 2005. An assessment of metal contamination in mangrove sediments and leaves from Punta Mala Bay, Pacific Panama. Mar. Pollut. Bull. 50: 547-552. Duke, N.C., S. Zuleika, M. Pinzon & M.C.T. Prada. 1997. Large-scale damage to mangrove forests following two large oil spills in Panama. Biotropica 29: 2-14. English, S., C. Wilkinson & V. Baker. 1997. Survey manual for tropical marine resources. Australian Institute of Marine Science, Townsville, Australia. Field, C.D. 1995. Impact of expected climate change on mangroves. Hydrobiologia 295: 75-81. Glynn, P.W. & J.L. Maté. 1996. Field guide to the Pacific coral reefs of Panama, p. 146-166. In H.A. Lessios & I.G. MacIntyre (eds.). Proceedings of 8th International Coral Reef Symposium, Panama. Guevara, J.M. 2005. Changes in land use and cover in Las Perlas Archipelago: a proposal for a protected area. MSc Dissertation, Heriot-Watt University, Edinburgh, England. Hogarth, P.J. 1999. The biology of mangroves (biology of habits). Oxford, England. Jimenez, J.A. 1984. A hypothesis to explain the reduced distribution of the mangrove Pelliciera rhizophorae Tr. & Pl. Biotropica 16: 304-308. Jimenez, J.A. 1992. Mangrove forests on the Pacific coast of Central America, p. 259-267. In U. Seeligeer. 868. (ed.). Coastal plant communities of Latin America. Academic, San Diego, USA. Kathiresan, K. & B.L. Bingham. 2001. Biology of mangroves and mangrove ecosystems. Adv. Mar. Biol. 40: 81-251. Krauss, K.W., C.E. Lovelock, K.L. McKee, L. LópezHoffman, S.M.L. Ewe & W.P. Sousa. 2008. Environmental drivers in mangrove establishment and early development: A review. Aquat. Bot. 89: 105-127. Lacerda, L.D., J.E. Conde, B. Kjerfve, R. Alvarez-León, J. Alarcón & J. Polanía. 2002. American Mangroves, p. 1-62. In L.D. Lacereda (ed.). Mangrove ecosystems function and management. Springer, Berlin, Germany. López-Hoffman, L., N.P.R. Anten, M. Martínez-Ramos & D.D. Ackerly. 2007. Salinity and light interactively affect neotropical mangrove seedlings at the leaf and whole plant levels. Oecologia 150: 545-556. Lovelock, C.E., I.C. Feller, K.L. McKee & R. Thompson. 2005. Variation in mangrove forest structure and sediment characteristics in Bocas del Toro, Panama. Caribb. J. Sci. 41: 56-464. Macintosh, D.J. 1996. Mangroves and coastal aquaculture: doing something positive for the environment. Aquaculture Asia 1: 3-8. Margules, C.R. & R.L. Pressey. 2000. Systematic conservation planning. Nature 405: 243-253. Mayo, E.M. 1965. Algunas características ecológicas de los bosques inundables de Darien, Panamá, con vistas a su posible utilización. Turrialba 15: 336-347. Murray, M.R., S.A. Zisman, P.A. Furley, PA, D.M. Munro, J. Gibson, J. Ratter, S. Bridgewater, C.D. Minty & C.J. Place. 2003. The mangroves of Belize Part 1: distribution, composition and classification. Forest Ecol. Manag. 174: 265-279. Nagelkerken, I., G. Van der velde, M.W. Gorissen, G.J. Meijer, T. Van’t hof & C. Den Hartog. 2000. Importance of mangroves, seagrass beds and the shallow coral reef as a nursery for important coral reef Fishes, using a visual census technique. Estuar. Coast. Shelf S. 51: 33-44. Ong, J.E. 1995. The ecology of mangrove conservation and management. Hydrobiologia 295: 343-341. Ong, J.E., W.K. Gong & B.F. Clough. 1995. Structure and productivity of a 20-year-old stand of Rhizophora apiculata Bl. mangrove forest. J. Biogeogr. 22: 417424.. Rev. Biol. Trop. (Int. J. Trop. Biol. ISSN-0034-7744) Vol. 58 (3): 857-869, September 2010.
(13) Pool, D.J., S.C. Snedaker & A.E. Lugo. 1977. Structure of mangrove forests in Florida, Puerto Rico, Mexico and Costa Rica. Biotropica 9: 195-212. Primavera, J.H. 1993. A critical review of shrimp pond structure in the Philippines. Res. Fish. Sci. 1: 151201. Rabinowitz, D. 1975. Habitat separation among mangroves in Panama. Ph.D. Thesis, University of Chicago, Illinois, USA. Rabinowitz, D. 1978a. Dispersal properties of mangrove propagules. Biotropica 10: 47-57. Rabinowitz, D. 1978b. Mortality and initial propagule size in mangrove seedlings in Panama. J. Ecol. 66: 45-51. Rabinowitz, D. 1978c. Early growth of mangroves seedlings in Panama, and a hypothesis concerning the relationship of dispersal and zonation. J. Biogeogr. 5: 113-133. Robertson, A.I. & M.J. Phillips. 1995. Mangroves as filters of shrimp pond effluent: predictions and biogeochemical needs. Hydrobiologia 295: 311-321. Schaeffer-Novelli, Y., G. Cintrón-Molero, M. CunhaLignon & C. Coelho-Jr. 2005. A conceptual hierarchical framework for marine coastal management and conservation: a Janus-Like approach. J. Coastal Res. 42: 191-197. Sherman, R.E., T.J. Fahely & J.J. Battles. 2000. Smallscale disturbance and regeneration dynamics in a neotropical mangrove forest. J. Ecol. 88: 165-180. Smith, T.J., H.T. Chan, C.C. McIvor & M.B Roblee. 1989. Inter-continental comparisons of seed predation in tropical, tidal forests. Ecology 70: 146-151.. Smith, T.J. 1992. Forest structure, p.101-136. In I. Robertson & D.M. Alongi (eds.). Tropical Mangrove Ecosystems. American Geophysical Union, Washington, USA. Tomlinson, P.B. 1999. The botany of mangroves. Cambridge University, Cambridge, England. Twilley, R.R., V.H. Rivera-Monroy, R. Chen & L. Botero. 1998. Adapting an ecological mangrove model to stimulate trajectories in restoration ecology. Mar. Pollut. Bull. 37: 404-419. Twilley, R.R. & V.H. Rivera-Monroy. 2005. Developing performance measures of mangrove wetlands using simulation models of hydrology, nutrient biogeochemistry, and community dynamics. J. Coastal Res. 40: 79-93. Walters, B.B. 2005. Ecological effects of small-scale cutting of Philippine mangrove forests. Forest Ecol. Manage. 206: 331-348. Walkley, A. & I.A. Black. 1934. An Examination of the Degtjareff Method for Determining Soil Organic Matter, and A Proposed Modification of the Chromic Acid Titration Method. Soil Sci. 37: 29-38. Wentworth, C.K. 1929. Methods of computing mechanical composition types in sediment. Geol. Soc. Amer. 40: 771-790. Wolfe, M., V. Koch & V. Isaac. 2000. A trophic flow model of the Caeté Mangrove Estuary (North Brazil) with considerations for the sustainable use of its resources. Estuar. Coast. Shelf S. 50: 789-803. Yoshiro, M., M. Michimasa, K. Motohiko & N.H. Phan. 1997. Mangroves as a coastal protection from waves in the Tong King delta, Vietnam. Mangroves and Salt Marshes 1: 127-135.. Rev. Biol. Trop. (Int. J. Trop. Biol. ISSN-0034-7744) Vol. 58 (3): 857-869, September 2010. 869.
(14)
(15)
Figure
Documento similar
In all cases, measures of thickness (average thickness in the case of random forest and log 10 of maximum thickness in the case of ANN and multiple linear regression) are
The Dwellers in the Garden of Allah 109... The Dwellers in the Garden of Allah
The objective of this study was to assess monthly litterfall production and nutrient potential deposition through fallen leaves in three types of forest ecosystems of northeastern
The landscape of media and communication companies in Ecuador is little known, in terms of their corporate organisation, structure, human resources, and products and
For each unit of analysis we quantify both its percentage of forest cover (our habitat amount variable), and the proportion of this percentage occurring in the largest forest patch
The results of this study revealed that oil palm plantations developed on land cover from secondary forest or shrubs had an impact on the number of species and the diversity
scleroxylon, one of the most valuable and fragile timber species from the Chiquitano forest in Santa Cruz de la Sierra, Bolivia, (ii) to quantify the changes in
1. Provide the year that your year-specifíc data refers to. Alíhough we will attempt to standardize by using data from 1998, enter a different date here if the bulk of the data
