Spatial distribution of heavy metals in sediments from the Gulf of Paria, Trinidad
8
0
0
Texto completo
(2) MATERIALS AND METHODS Thirty-seven stations were established in shallow and deep waters of the Gulf of Paria (Fig. 1). These included stations at the mouths of 11 major rivers: Diego Martin, Maraval, Caroni, Caparo, Couva, Guaracara, Cipero, Godineau, Guapo, Cap de Ville and St. Ann’s. Sampling was scheduled to obtain two sets of both wet and dry season data. Surficial sediment samples were collected in July and November/ December 1998, and March and April 1999, using a 0.04 m2 grab sampler (one, two, one and two grabs per station respectively). Samples were dried at approximately 60°C, ground and passed through a 180 µm sieve. Use of the finer fraction removes the dependence of metal content on surface area so that the analysis is normalized for sediment type i.e. sand, silt or clay. This fraction also yields highest contrast between anomalous and background samples (Oliver 1973). Metals were analyzed using the Perkin Elmer AAnalyst 100 Atomic Absorption Spectrometer. Each grab sample. 640000. +. 660000. 680000. Diego Martin R. Maraval R. St. Anns R.. + 1 9. 2. 3 4+ 37 6 5. Caroni R.. RESULTS Metals, TOC and grain size data. Caparo R.. 7. 8. +. 1180000. 1180000. 620000. was analysed in duplicate. Sediments were analysed for non-residual Al, Cd, Cr, Cu, Fe, Pb, Mn, Ni and Zn using flame or graphite furnace atomic absorption spectrometry. Samples were shaken with 0.5 M hydrochloric acid and filtered (Environmental Canada 1979). Sediments were analyzed for total Hg (after digestion with sulphuric, nitric and hydrochloric acids) using a cold vapour technique as outlined in Environmental Canada (1979) methods. Detection limits for these metals were Al (1 μg g-1), Fe (0.4 μg g-1), Mn (0.03 μg g-1), Zn (5 μg kg-1), Cd (0.5 μg kg-1), Cr (1 μg kg-1), Cu (5 μg kg-1), Pb (5 μg kg-1), Ni (2 μg kg-1) and Hg (2.5 μg kg-1). Total Organic Carbon analysis (detection limit: 0.01%) was performed according to the titrimetric method outlined by Buchanan and Kain (1971). Grain size analysis was performed using the settling tube method of Folk (1974). Seasonal differences in metal concentrations were assessed using parametric (Paired t on the log transformed data) and non-parametric (Wilcoxon) tests. Relationship between parameters were assessed using Peason correlation, and Principal Component Analysis was used to facilitate pattern detection in the data (Zitko 1994).. +. 10. +. 15. Station Locations Rivers. 20. 17. 29. 30 35. 32 34. 36 +. Guaracara R. 25. 26 27. +. +. Cipero R.. 28. Godineau R.. 31. Guapo R. Cap-de-Ville R. 33. +. 8000. 620000. 24 +. 23. 1120000. +. 22 +. 21. 1140000. 1140000. + Couva R.. 16. 18. 19. Land. 1120000. 14. 12 +. 11. 1160000. 1160000. 13. 0. 640000. 8000. +. 15000 meters. 660000. 680000. Fig. 1. Location of sampling stations in the Gulf of Paria, Trinidad.. 34. Concentration ranges and mean concentrations for metals in sediments in the wet and dry seasons are given in Table 1. Canadian Interim Sediment Quality Guidelines (ISQGs) for total metal (Anonymous 1998) are included as a benchmark. The number of stations (n1 and n2) exceeding these guidelines in each season is also presented. Pb in sediments from St. Ann’s River and Cu from sediments at Guaracara, Cipero and St. Ann’s Rivers exceeded the ISQG in both seasons. Ranges and means for TOC in sediments in the wet and dry seasons are given in Table 2. Results of the grain size analysis for each season are also given in Table 2.. Rev. Biol. Trop. (Int. J. Trop. Biol. ISSN-0034-7744) Vol. 53 (Suppl. 1): 33-40, May 2005 (www.tropiweb.com).
(3) TABLE 1 Ranges, means and p values (Paired t and Wilcoxon tests) of heavy metal concentrations in surficial sediments of the Gulf of Paria, Trinidad- wet season 1998 and dry season 1999 Metal Conc Range Fe Mn Al Cr Cd Pb Zn Cu Hg (T) Ni. Wet Season 1998 Mean Conc. 3.2- 18.9 46.1- 1 174.7 0.5- 3.1 5.4- 28.4 bdl- 0.50 3.1- 73.3 13.6- 170.3 0.8- 39.7 0.2- 71.2 1.6- 7.3. 11.3 463.7 2.1 19.2 0.19 17.0 50.5 7.3 20.3 4.8. Dry Season 1999 Mean Conc. n1. Conc Range. na na na 0 0 3 1 4 0 na. 1.9- 16.9 43.3- 1 564.2 0.2- 3.2 3.7- 24.4 0.02- 0.46 0.8- 58.3 7.1- 313.9 1.6- 35.5 4.0- 99.7 0.9- 27.2. 10.7 539.2 2.2 19.2 0.14 5.6 57.2 7.6 25.1 15.9. n2 na na na 0 1 1 2 3 0 na. Paired t Wilcoxon ISQG* p-value p-value. 0.202 0.063 0.944 0.686 0.001 0.000 0.495 0.024 0.011 0.000. 0.312 0.003 0.021 0.928 0.001 0.000 0.064 0.045 0.025 0.000. 52.3 0.7 30.2 124 18.7 130 -. Units: Fe, Al/ mg g-1; Mn, Cu, Cr, Cd, Pb, Zn, Ni/ μg g-1; Hg (Total)/ μg kg-1. n= 37 for wet and dry seasons; n1 and n2- no of stations exceeding ISQG in wet and dry seasons respectively * Canadian Interim Sediment Quality Guideline-ISQG (CCME 1999) for total metal in surficial sediments (-) none available; (na) not applicable; (bdl) below detection limit (for Cd: 0.001).. Seasonal differences Pb and Cd concentrations were higher in the wet season, suggesting contribution from land-based sources while Ni concentrations were higher in the dry season (Paired t, p<0.01 and Wilcoxon, p<0.01; Table 1). Cu and Hg concentrations were also higher in the dry season (Paired t, p<0.05 and Wilcoxon, p<0.05). Mn concentrations were higher in the dry season (Wilcoxon, p<0.01). Wet season TOC and percentages for sand and silt content were similar to dry season values. The maximum percentage clay content in the dry season was considerably lower than the corresponding maximum in the wet season. Pearson correlation Strong positive correlation was observed between Al, Mn, Cr, Fe (Pearson, p<0.005) and, to a lesser extent (Pearson, p<0.05), Ni, in both wet and dry seasons. These metals were also positively correlated with percentage clay in sediments (Pearson, p<0.05). Positive correlation also existed between Hg, Pb, Zn and Cu in both seasons (Pearson, p<0.001). These. TABLE 2 Ranges and means of TOC and Grain Size data for surficial sediments of the Gulf of Paria, Trinidad- wet season 1998 and dry season 1999 Parameter. Wet Season 1998. Range. Mean. Range. Mean. 0.4- 3.1 0.4- 92.9 4.3- 91.6 1.5- 30.9. 1.5 20.6 67.0 12.5. 0.1- 3.4 0.1- 99.9 0.0- 91.2 0.0- 20.0. TOC (%) Sand (%) Silt (%) Clay (%). Dry Season 1999. 1.4 26.7 66.1 7.2. metals were positively correlated with TOC (Pearson, p<0.05). Weak negative correlation (Pearson, p < 0.1) between Mn and Cu, Zn and Hg was observed in both seasons while one correlation was specific to the wet season: positive correlation (Pearson, p < 0.05) between Cd and Cu, Zn and Hg. Wet season TOC and percentages for sand and silt content were similar to dry season values. The maximum percentage clay content in the dry season was considerably lower than the corresponding maximum in the wet season. Concentration ranges and mean concentrations for TOC in sediments in the wet and dry. Rev. Biol. Trop. (Int. J. Trop. Biol. ISSN-0034-7744) Vol. 53 (Suppl. 1): 33-40, May 2005 (www.tropiweb.com). 35.
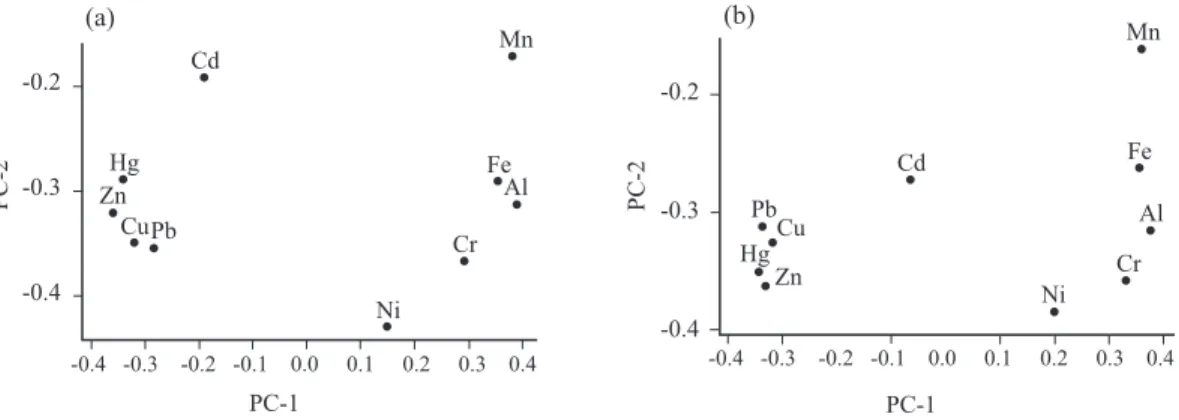
(4) seasons are given in Table 2. Results of the grain size analysis are also given in Table 2. Principal Component Analysis (PCA) was also performed on the data. In the wet season, the first two components (PC 1 and PC 2) account for 72% of the total variance. The wet season loadings plot shows that Fe, Mn, Cu, Cr, Pb, Zn, Al and Hg contribute considerably ( loading > 0.25) to PC 1 (Fig. 2a). Pb, Cu, Zn and Hg are inversely correlated with PC 1; Cr, Al, Fe and Mn are positively correlated with PC 1. Ni and Cd do not contribute much to PC1. All metals are inversely correlated with PC 2. Fe, Cu, Cr, Pb, Zn, Ni, Al and Hg contribute considerably ( loading > 0.25) to PC 2. Ni shows the strongest (inverse) correlation with PC 2; Cd and Mn do not contribute much to PC 2. Dry season data produced results similar to those obtained for the wet season. PC 1 and PC 2 account for 73% of the total variance. The eight metals that contribute considerably ( loading > 0.25) to PC1 in the wet season (Fe, Mn, Cu, Cr, Pb, Zn, Al and Hg) also contribute considerably to PC1 in the dry season (Fig. 2b). The loadings plot of the first two components produced results similar to the wet season except for Cd, which is significant along PC 2 only in the dry season. DISCUSSION When there is contribution from land-based sources, pollutant concentrations tend to be. higher in the wet season compared with the dry season due to increased runoff, which may be the case with Pb and Cd. According to Fergusson (1990), high covariance between Fe and Mn in soils can arise due to similarities in their redox chemistry and geochemical behaviour. Chen et al. (1999) also report that Cr is similar to Fe and Al in terms of ionic size and geochemical properties, which could account for the correlation observed. Cu, Pb, Zn and Hg which were strongly correlated, have all been described as metals that have become enriched mainly due to anthropogenic input (Forstner and Wittmann 1979), whereas the weaker correlation between Mn and Cu, Zn and Hg suggests separate metal sources. The correlation noted between Cd and Cu, Zn and Hg in the wet season, all of which are associated with agricultural activity, suggests some contribution from agricultural runoff. Stations in the wet season PCA score plot (Fig. 3a) can be separated into six groups and an outlier (Stn 34). Group 1 stations are river mouths in the northern and lower central areas of the west coast. Group 2 stations are river mouths on the northern area of the west coast. Group 3 stations are river mouths on the southern area of the west coast. Groups 4 and 5 consist of river mouth and nearshore stations. Group 6 consists mainly of offshore stations. Stations in Groups 4, 5 and 6 span most of the coastline and cannot be associated with a specific area of the coast.. Fig. 2. Heavy metals in sediments from the Gulf of Paria, Trinidad. Plot of loadings in PC 1 and PC 2 (a) wet season 1998) (b) dry season 1999.. 36. Rev. Biol. Trop. (Int. J. Trop. Biol. ISSN-0034-7744) Vol. 53 (Suppl. 1): 33-40, May 2005 (www.tropiweb.com).
(5) Fig. 3. Heavy metals in sediments from the Gulf of Paria, Trinidad. Plot of scores in PC 1 and PC 2 (a) wet season 1998, (b) dry season 1999.. From the loadings plot, it is expected that stations in the left quadrants would generally have higher concentrations of Cu, Pb, Zn and Hg while those in the right quadrants would generally have higher concentrations of Al, Mn, Fe and Cr (Zitko 1994). Examination of the data shows that this is generally the case (Table 3a). Groups 1 and 2 (furthest left in the score plot) are characterized by elevated concentrations of Cu, Pb, Zn and Hg. Group 6 (furthest right in the score plot) is characterized by elevated concentrations of Al, Mn, Fe and Cr (Table 3a). Examination of. the data also shows that stations in Groups 1 and 2 generally contain higher TOC concentrations (>1.5%) suggesting that Cu, Pb, Zn and Hg may have become associated with organic matter, which settles at these river mouths. Percentage clay at Group 6 stations was higher (8- 31%), suggesting that Al, Mn, Fe and Cr may have become associated with the clay sized fraction and transported further from the coast. PC 1 could, therefore, represent the rate of incorporation of metal into the bottom sediments/ rate of removal of metal by organic matter.. TABLE 3A Heavy metals concentrations in groups produced by PCA- wet season 1998 Metal. Group 1 River mouth stns (4, 37, 25, 27, 28). Group 2 River mouth stns (3,5). Group 3 River mouth stns (31, 33). Group 4 River mouth/ nearshore stns (14,17,29,36). Group 5 River mouth/ nearshore stns (13,16,30). Group 6 Mainly offshore stns. Outlier 34. ISQG *. Fe Mn Al Cr Cd Pb Zn Cu Hg (T) Ni. 9.03± 2.42 178.30± 98.20 1.58± 0.40 18.43± 5.55 0.35± 0.11 40.9± 20.5 105.60± 41.20 24.73± 9.10 45.50± 9.48 5.51± 1.26. 4.47± 1.62 124.03± 86.08 1.00± 0.44 7.81± 3.46 0.17± 0.05 31.50± 21.1 92.50± 41.40 12.50± 1.57 41.82± 3.23 3.25± 0.04. 4.96± 2.45 53.91± 11.02 0.48± 0.04 6.59± 1.06 0.22± 0.02 4.53± 0.04 31.92± 7.50 2.78± 0.63 16.84± 8.03 2.39± 1.13. 7.96± 0.86 171.10± 82.19 1.14± 0.18 14.11± 3.16 0.13± 0.12 6.58± 3.76 29.04± 10.66 2.79± 2.56 6.69± 5.00 2.93± 0.78. 10.19± 1.33 287.53± 37.43 1.89± 0.13 17.49± 4.59 0.08± 0.07 14.75± 1.32 42.56± 1.90 6.98± 4.52 17.27± 13.02 4.71± 1.39. 13.69± 2.24 672.30± 245.94 2.66± 0.24 22.70± 2.81 0.17± 0.13 14.46± 3.55 38.59± 15.03 4.27± 1.21 12.42± 7.19 5.38± 1.02. 13.71 459.98 1.94 24.15 0.42 13.61 75.38 3.69 71.18 3.80. 52.3 0.7 30.2 124 18.7 130 -. Cell contents: Mean ± standard deviation; Fe, Al/mg g-1; Mn, Cu, Cr, Cd, Pb, Zn, Ni/μg g-1; Hg (Total)/ μg kg-1. * Canadian Interim Sediment Quality Guideline- ISQG (CCME) (Anonymous 1998) for total metal in surficial sediments. (-) none available.. Rev. Biol. Trop. (Int. J. Trop. Biol. ISSN-0034-7744) Vol. 53 (Suppl. 1): 33-40, May 2005 (www.tropiweb.com). 37.
(6) The loadings plot also suggests that stations in the lower quadrants (i.e. negatively loaded on PC 2) would have higher concentrations of Ni (most significant on PC 2) and all other metals excluding Mn and Cd, which do not contribute significantly to PC 2 (Zitko 1994). This is consistent with the data (Table 3a). Group 1 (furthest down in the score plot) is characterized by elevated concentrations of all metals. Groups higher up in the score plot are generally characterized by lower metal concentrations. All metals are negatively loaded on PC 2, suggesting that PC 2 could represent extent of anthropogenic input to the stations. Separation achieved by PCA analysis (for the river mouth stations) corresponds well with the land use of the west coast. Group 1 (Stns 4, 37, 25, 27, 28), which is characterized by elevated concentrations of all metals analyzed contains stations that are subject to considerable anthropogenic input from several sources. Stn 37 (St. Ann’s River), and to a lesser extent, Stn 4 (Maraval River) are subject to urban runoff. The St. Ann’s River passes through the city of Port of Spain (the capital of Trinidad), which is an important human settlement centre. This river is also subject to sewage/ domestic waste. Station 25 (Guaracara River) is situated close to an oil refinery and receives runoff/ effluent from this refinery. Stn 27 (Cipero River) receives effluent from sewage and urban runoff. The Cipero River passes through San Fernando, another important human settlement centre. Stn 28 (Godineau River) receives agricultural runoff, as the Godineau Swamp is primarily an agricultural area. In addition, this river receives sewage and is subject to petroleum leaks from transportation pipelines. Group 2 (Stns 3 and 5) is less subject to effluents from heavy industry than Group 1. This is reflected in the average metal concentrations for Group 2, which are all lower than the Group 1 concentrations. Group 2 concentrations of Hg, Zn and Pb are, however, fairly comparable with Group 1 concentrations. Stn 5 (Caroni River) receives effluent from sugar refineries and rum distilleries. While Caroni is primarily agricultural, runoff from. 38. the somewhat urbanized “East-West corridor” (northern Trinidad) also enters this river. Group 3 (Stns 31 and 33) is less subject to anthropogenic input than Groups 1 and 2. These stations receive input mainly from sewage/ agricultural activity. It is expected that they contain lower metal concentrations than river mouth stations in the northern and lower central regions of the west coast, which are subject to urban runoff and industrial waste as well as sewage and agricultural waste. This is consistent with the metal concentrations determined. Apart from Cd, and, to a lesser extent, Fe, metal concentrations for Group 3 are lower than the concentrations of Group 1 and 2. Stn 34, which is an outlier, is also in the southern area of the west coast. Sediments at this station were distinct from most others in that they contained elevated concentrations of Fe, Mn, Al, Cr, elevated Cd, Zn, Hg, Ni but low concentrations of Pb and Cu which, again, suggests some contribution from agricultural waste. The dry season score plot of PC 2 versus PC 1 (Fig. 3b) was similar to the wet season plot; only minor changes in the positions of the stations were observed. Sampling stations were separated into 5 groups and one outlier (Stn 37). Group 1 (Stn 25 and 27) and Group 2 (Stns 3, 4, 5, 28) still consist of river mouth stations on the northern and lower central areas of the west coast. Stations in Group 3 (Stns 31 and 33) are river mouths on the southern area of the west coast. Group 4 (Stns 17, 29, 36) consists of nearshore stations while Group 5 consists mainly of offshore stations. Interpretations for the wet season generally hold for the dry season data. River mouth stations that are furthest left in the score plot, (Groups 1 and 2 and the outlier Stn 37) are characterized by elevated concentrations of Cu, Pb, Zn and Hg (Table 3b). TOC was higher at these stations (> 1.35%) except for Stn 4 (1.03%), again, suggesting that Cu, Pb, Zn and Hg may have become associated with organic matter, which settles at these river mouths. Offshore stations, which are furthest right (Group 5), are characterized by elevated concentrations of Al, Cr, Mn and Fe. Clay content. Rev. Biol. Trop. (Int. J. Trop. Biol. ISSN-0034-7744) Vol. 53 (Suppl. 1): 33-40, May 2005 (www.tropiweb.com).
(7) TABLE 3B Heavy metals concentrations in groups produced by PCA- dry season 1999 Metal. Group 1 River mouth stns (25, 27). Group 2 River mouth stns (3, 4, 5, 28). Group 3 River mouth stns (31, 33). Group 4 Nearshore stns (17, 29, 36). Group 5 Mainly offshore stns. Fe 9.39± 2.20 5.32± 1.72 3.79± 2.62 8.76± 1.31 12.56± 1.90 Mn 214.53± 146.07 106.38± 67.87 108.18± 91.77 148.91± 18.88 734.73± 377.57 Al 1.84± 0.26 1.03± 0.55 0.22± 0.04 1.34± 0.33 2.67± 0.46 Cr 18.74± 5.03 10.51± 2.36 6.84± 4.40 16.62± 1.72 21.84± 1.58 Cd 0.30± 0.20 0.14± 0.07 0.04± 0.01 0.03± 0.01 0.13± 0.26 Pb 6.98± 0.66 12.46± 11.50 1.14± 0.04 1.21± 0.35 3.21± 0.79 Zn 92.95± 1.85 91.60± 61.50 9.53± 3.49 32.41± 12.70 45.31± 13.57 Cu 28.17± 10.32 14.13± 4.19 3.60± 2.33 1.89± 0.47 5.14± 2.03 Hg (T) 63.50± 20.40 44.63± 9.29 7.53± 0.22 8.79± 4.87 19.29± 10.27 Ni 25.31± 2.74 14.65± 3.28 1.35± 0.59 3.50± 1.42 18.45± 5.17 Cell contents: Mean ± standard deviation; Fe, Al/mg g-1; Mn, Cu, Cr, Cd, Pb, Zn, Ni/μg g-1; Hg (Total)/ μg kg-1.. Outlier 37. ISQG* *. 8.03 65.34 1.31 20.10 0.46 58.3 313.9 30.27 99.74 6.55. 52.3 0.7 30.2 124 18.7 130 -. * Canadian Interim Sediment Quality Guideline- ISQG (CCME) (Anonymous 1998) for total metal in surficial sediments. (-) none available.. was lower in the dry season, however, clay percentages for Group 5 (4- 20%) were among the higher values suggesting that Al, Mn, Fe and Cr may have become associated with the clay sized fraction and transported further from the coast. PC 1 could, again, represent the rate of incorporation of metal into the bottom sediments/ rate of removal of metal by organic matter. As in the wet season, Group 1 (furthest down in the score plot) is characterized by elevated concentrations of all metals. Groups higher up in the score plot are generally characterized by lower metal concentrations (Table 3b). All metals are negatively loaded on PC 2 suggesting that PC 2 in the dry season plot could also represent extent of anthropogenic input to the stations. Changes were observed in the positions of Stns 37, 4, 28 (and less noticeably, Stn 14) in comparing score plots for the wet and dry seasons. Stn 37 (St. Ann’s River), which is part of the more anthropogenic Group 1 in the wet season, is an outlier in the dry season due to comparatively high concentrations of Pb, Zn and Hg in the sediments. This could be partly attributed to TOC content, which was also higher in the dry season. Stn 37 is lower in the dry season score plot, which is consistent with the hypothesis that stations more. negatively loaded along PC 2, are subject to greater anthropogenic input. Stn 4 (Maraval River) and Stn 28 (Godineau River) show the opposite trend to Stn 37 in the dry season. These stations are no longer part of the more anthropogenic Group 1. TOC at both these stations were lower in the dry season so that metals removed by TOC were also lower. Stn 14 (Caparo River) is further right in the dry season score plot due to increases in concentrations of Al, Fe, Cr and Mn. Analysis of the non-residual metal fraction and total mercury in sediments of the Gulf of Paria proved very useful in identifying metal enriched regions in the Gulf of Paria. Land-based activity seems to be responsible for much of the Pb and Cd in sediments from the Gulf. Sediments at the mouths of rivers subject to greatest anthropogenic input and land use tend to accumulate Cu, Pb, Zn and Hg when the Total Organic Carbon content is high. Sediments further from the coast, which contain a greater clay sized fraction, tend to accumulate Fe, Al, Mn and Cr. There are several sources for the metals found in sediments in the Gulf of Paria. Assignment of metals to a particular source would require more intensive sampling, including sampling along the rivers that flow into the Gulf.. Rev. Biol. Trop. (Int. J. Trop. Biol. ISSN-0034-7744) Vol. 53 (Suppl. 1): 33-40, May 2005 (www.tropiweb.com). 39.
(8) ACKNOWLEDGMENTS This project was a part of the Environmental Monitoring of the Gulf of Paria Project conducted by the Institute of Marine Affairs, and funded by the Government of the Republic of Trinidad and Tobago. I would like to thank the staff of the Institute of Marine Affairs, particularly, the Marine Chemistry Department, the Technical and Support Services Department, the Information Technology Department and the Environmental Research Programme. Special mention must be made of N. SlingerCohen, who analyzed the many samples and provided some continuity to the project, as well as S. Raj and F. Hanson, who were instrumental in sample design and sample collection. RESUMEN El Golfo de Paria recibe metales pesados de zonas urbanas, industriales y agrícolas, además de aguas negras y aguas servidas, tanto de la costa occidental, como de tierra adentro de Trinidad. Se usaron concentraciones de metales pesados no residuales para determinar la distribución espacial de metales pesados en sedimentos en el Golfo de Paria. Se extrajeron muestras de sedimentos superficiales en 37 estaciones, que incluían la boca de 11 ríos principales que fluyen al golfo. Las estaciones fueron muestreadas dos veces durante la época lluviosa (julio 1998 y noviembre/ diciembre 1998) y dos en la época seca (marzo 1999 y abril 1999). Se analizó en los sedimentos cobre (Cu), cinc (Zn), plomo (Pb), mercurio (Hg), cadmio (Cd), níquel (Ni), cromo (Cr), hierro (Fe), manganeso (Mn), aluminio (Al), Carbón Orgánico Total (COT) y tamaño de grano. El análisis de componentes principales muestra que los sedimentos de las bocas de los ríos con cuencas más deforestadas y con mayor impacto antropogénico, son distintos del resto. Esto se debió a concentraciones mayores de Pb, Zn, Cu y Hg (3.53-73.30 µg g-1, 45.8-313.9 µg g-1, 8.43-39.71 µg g-1 y 0.03-0.10 µg g-1, respectivamente). Los sedimentos más alejados de la costa también eran distintos por sus mayores concentraciones de Al, Fe, Cr y Mn (1.37-3.16 mg g-1, 9.51-18.91 mg g-1, 17.22-28.41 µg g-1 y 323.6–1,564.2 µg g-1, respectivamente). Cd y Pb fueron mayores en la época húmeda, mientras que Ni fue mayor en la época seca. Matrices de correlación de Pearson muestran que Pb, Zn, Cu y Hg estaban correlacionados entre si y con el COT. Se observó correlación. 40. también entre Al, Fe, Cr, Mn y Ni. Estos metales estaban correlacionados con el porcentaje de arcilla en los sedimentos. Pb, Zn, Cu y Hg son removidos preferiblemente por la materia orgánica que se asienta en la boca de los ríos, mientras que Al, Fe, Cr, Mn y Ni se asocian con las arcillas y son transportados lejos de la costa. Palabras clave: Metales pesados, distribución espacial, sedimentos, Trinidad, Caribe.. REFERENCES Buchanan, J. & K. Kain. 1971. The determination of organic matter in sediments, p. 49-50. In W. Holme & A. McIntyre (eds.). Methods for the Study of Marine Benthos. Blackwell Scientific, Oxford. Chen, M., L. Ma & W. Harris. 1999. Baseline concentrations of 15 trace elements in Florida surface soils. J. Environm. Qual. 28: 1173-1181. Doherty, G., G. Brunskill & M. Ridd. 2000. Natural and enhanced concentrations of trace metals in sediments of Cleveland Bay, Great Barrier Reef Lagoon, Australia. Mar. Poll. Bull. 41: 337-344. Environmental Canada. 1979. Analytical Methods Manual, Part 4. IWD (Inland Waters Directorate). Water Quality Branch, Ottawa, Canada. 34 p. Fergusson, J. (ed.). 1990. The Heavy Elements: Chemistry, Environmental Impact and Health Effects. Pergamon, Oxford. 614 p. Folk, R. 1974. Petrology of Sedimentary Rocks. Hemphill, Texas. 182 p. Forstner, U. & G. Wittmann. 1979. Metal Pollution in the Aquatic Environment. Springer, Berlin. 486 p. Oliver, B. 1973. Heavy metal levels of Ottawa and Rideau River sediments. Environ. Sci. Tech. 7: 135. Zitko, V. 1994. Principal component analysis in the evaluation of environmental data. Mar. Poll. Bull. 28: 218- 222.. INTERNET REFERENCES CCME. 1999. Canadian sediment quality guidelines for the protection of aquatic life. CCME (Canadian Council of Ministers of the Environment). (Downloaded: December 7, 1999, www.ec.gc.ca/ceqg-rcqe).. Rev. Biol. Trop. (Int. J. Trop. Biol. ISSN-0034-7744) Vol. 53 (Suppl. 1): 33-40, May 2005 (www.tropiweb.com).
(9)
Figure


Documento similar
The main objectives of this study were to evaluate the degree of Pb, Cu, Zn, Cd, Cr and Ni pollution using pollution indexes and geostatistical approach, and to assess metals
Considering the recognized antibacterial activity of Zn 2+ and the potential of MOFs in the progressive release of metals, the potential antimicrobial properties of these
Significant correlations were established between some biomarkers and heavy metals: AChE was correlated with Pb, Cd and Cu concentrations in water; IDH activity was cor- related with
In the “big picture” perspective of the recent years that we have described in Brazil, Spain, Portugal and Puerto Rico there are some similarities and important differences,
1. S., III, 52, 1-3: Examinadas estas cosas por nosotros, sería apropiado a los lugares antes citados tratar lo contado en la historia sobre las Amazonas que había antiguamente
In the previous sections we have shown how astronomical alignments and solar hierophanies – with a common interest in the solstices − were substantiated in the
Table 1 indicates which variables are used to train each of the three BDT discriminants for the (3j, 3b), (4j, 3b), and (4j, 4b) categories. Figures 1, 2 and 3 show the
The LR’s in the case of the KDF are produced from the Same Source (SS) and Different Source (DS) score distributions (examples are shown in the Figure 1)
