Optimization of nanofiltration membrane processes applied to grape must for the production of low alcohol wines
290
0
0
Texto completo
(2)
(3)
(4)
(5) Dr. Pedro Prádanos del Pico Catedrático del Departamento de Física Aplicada Universidad de Valladolid y Dr. Laura Palacio Martínez Profesora Titular del Departamento de Física Aplicada Universidad de Valladolid. Certifican que: como directores de la Tesis Doctoral titulada “OPTIMIZATION OF NANOFILTRATION MEMBRANE PROCESSES APPLIED TO GRAPE MUST FOR THE PRODUCTION OF LOW ALCOHOL WINES” presentada por D.ª Camila M. Salgado Faller, alumna del programa de doctorado en Ingeniería de Procesos y Sistemas, impartido por la Universidad de Valladolid, autorizan la presentación de la misma, considerando que el trabajo presentado constituye su tesis para optar al grado de Doctor, ya que se trata de un trabajo original y todos los resultados presentados y los análisis realizados son fruto de su investigación. Valladolid, a. Fdo. Pedro Prádanos del Pico. de. de 2015. Fdo. Laura Palacio Martínez.
(6)
(7) ACKNOWLEDGMENTS / AGRADECIMIENTOS. Por dónde empezar? Esta parte es tan difícil…. No quiero olvidar nada ni a nadie. Primero quiero agradecer al Ministerio de Educación Español por la beca FPU (AP2010-5769) que me fue otorgada para realizar este doctorado durante todos estos años. Quiero agradecer a la Universidad de Valladolid (UVa) por las becas que me concedió para realizar mis dos estancias de doctorado, dos experiencias maravillosas en todo sentido. Quiero agradecer también a mis dos directores: Pedro y Laura por todo su apoyo. Han sido grandes mentores, consejeros y amigos a lo largo de este doctorado y experiencia de vida… simplemente gracias por todo! A Antonio, por tratarme siempre como un igual a pesar de que siempre tuviste que orientarme! A Encarna, por la colaboración y apoyo en Palencia. Sin ella esto no hubiera sido posible. A todo el SMAP: Sarita, Moni, Alberto, Vero, Pedro, Laura, Antonio y José Ignacio son un grupo de investigación y de amigos espectacular!!! Thanks to Carla Brazinha and Joao Crespo for giving me the oportunity of doing part of my research at the Requimte (Universidade Nova de Lisboa) and also for being such great friends. A want to thank also Roland Haseneder, Dr. Repke and all my friends at the ITUN (TU Bergakademie Freiberg) for all your help and support during that wonderful second internship A lo largo de estos años he mantenido grandes amistades que la distancia no logró debilitar y que no puedo dejar de agradecer. A mis bell@s amig@s en la Argentina, que han sido un gran apoyo y motivo de alegría siempre. Mis amig@s en Bolivia, esas personas maravillosas que hace una eternidad amo y adoro. Todas estas amistades son las que me hacen sentir feliz de haber vivido en distintas ciudades y son aquellas por las que no puedo inclinarme hacia una nacionalidad. Pero durante estos cinco últimos años he hecho grandes amigos en España. Mi gran comisión de ocio: Victor, Julián, Pinto, Dani, Ana, Sori, Cris, ese manicomio portátil de personitas maravillosas y especiales que me llevaron a la cordura. Las chicas del mundo que conocí gracias al máster y que me acompañaron y soportaron a lo largo de taaaanto: Bea, Mafe, Pami, Marthy y Maria Eugenia….Gracias! Katia, mi gran amiga y compañera en este doctorado….No puedo dejar de mencionar a mis.
(8) argentinitos: Gloriani y Gonzalez! Una pareja divina que me devolvió el sentido de familia a pesar de estar tan lejos. Carla, no me alcanzan las palabras para agradecer y agradecerte el haberlos conocido! A Amado, ese gran guía personal y espiritual que me reorientó especialmente en la parte final de esta experiencia Por último quiero agradecer a mi familia: Mamá, Papá, Rodrigo, Ignacio, Mamina, Otto, Eli, Xime, Cande, Fran, Vingy y nuestro nuevo Felipe! Cada uno de ustedes a su manera me acompañó y apoyó para salir adelante en este periodo tan importante. Agradezco a la distancia y experiencia por permitirme aprender que son lo más grande que tengo, lo que nada ni nadie podrá quitarme jamás pase lo que pase. Los amo!!!. Gracias a todos. Gracias por ser, gracias por aparecer y gracias por estar!.
(9) TABLE OF CONTENTS. SUMMARY ................................................................................................... 1 RESUMEN ..................................................................................................15 Section I. Introduction and general methodology .........................................27 Chapter 1. From Grapes to wine. Analysis of current situation ....................31 1.1 Problematic and Motivation: Influence of climate change on grape maturation and wine quality .......................................................................31 1.2 Alcohol control techniques used in the grape and wine industry ..........32 1.3 Grape must and its composition ..........................................................35 1.3.1 Carbohydrates: Sugars in must ....................................................36 1.3.2 Organic acids ...............................................................................38 1.3.3 Minerals ........................................................................................38 1.3.4 Nitrogen compounds ....................................................................39 1.3.5 Phenolic compounds ....................................................................40 1.3.6 Aromatic compounds ....................................................................41 1.3.6.1 Terpens, Carotenoids and pyrazines ........................................41 1.3.6.2 C6-alcohols and aldehydes .......................................................42 1.4 Aims and outline of the PhD thesis ......................................................43 1.5 References..........................................................................................46 Chapter 2. Nanofiltration and Pervaporation membrane processes. ............51 Basic principles ...........................................................................................51 2.1 Introduction .........................................................................................51 2.2 Nanofiltration .......................................................................................51 2.2.1 Basic concepts .............................................................................51 2.2.2 Separation mechanisms ...............................................................54 2.2.3 Mass transport ..............................................................................55 2.2.4 Concentration Polarization. Film Theory .......................................56 2.2.5 Fouling mechanisms.....................................................................57 2.3 Pervaporation ......................................................................................58 2.3.1 Basic concepts .............................................................................58 2.3.2 Mass transport. Solution – diffusion theory ...................................60 2.4 References..........................................................................................63.
(10) Section II. Permeate flux decrease during the nanofiltration of grape juice. Study of the influence of the different molecular weight compounds ........... 67 Chapter 3. Influence of low and high molecular weight compounds on the permeate flux decline in nanofiltration of red grape must ............................ 71 Abstract .................................................................................................... 71 3.1 Introduction ........................................................................................ 72 3.2 Theory ................................................................................................ 74 3.2.1 Permeate Flux Limit ..................................................................... 74 3.2.2 Concentration Polarization. Film Theory ...................................... 76 3.2.3 Fouling mechanism and models .................................................. 77 3.3 Materials and Methods ....................................................................... 79 3.3.1 Membrane and Experimental Setup............................................. 79 3.3.2 Synthetic Solution and Must ........................................................ 81 3.3.3 Procedure .................................................................................... 82 3.3.4 Cleaning ...................................................................................... 83 3.3.5 Analytical Methods ...................................................................... 83 3.4 Results and Discussion ...................................................................... 84 3.4.1 Nanofiltration Processes .............................................................. 84 3.4.2 Fouling Analysis .......................................................................... 87 3.4.3 Evolution of concentration of sugars and membrane efficiency.... 88 3.4.4 Determination of the resistances to the permeate flux ................. 91 3.5 Conclusions........................................................................................ 94 3.6 Acknowledgements ............................................................................ 95 3.7 Nomenclature ..................................................................................... 96 3.8 References ......................................................................................... 98 Chapter 4. Fouling study of Nanofiltration membranes for sugar control in grape must. Analysis of resistances and the role of osmotic pressure ...... 105 Abstract .................................................................................................. 105 4.1 Introduction ...................................................................................... 106 4.2 Theory .............................................................................................. 107 4.2.1 Permeate flux decrease and retention model .......................... 107 4.2.2 Fouling mechanisms ............................................................... 108 4.2.3 Pressure drops along the membrane system .......................... 109 4.2.4 Specific cake resistance. Principles of cake filtration. ................ 110.
(11) 4.2.5 Pore size evolution ....................................................................112 4.3. Materials and methods ..................................................................113. 4.3.1 Membranes and experimental set-up .......................................113 4.3.2 Synthetic solution and commercial grape must ...........................114 4.3.3 Experimental protocol .................................................................114 4.3.4 Deposition factor (γ) ...................................................................116 4.3.5 Analytical methods .....................................................................116 4.3.6 SEM and AFM microscopy .........................................................116 4.4 Results and discussion......................................................................117 4.4.1 Permeate flux and permeability ..................................................117 4.4.2 Sugars retention and passage ....................................................118 4.4.3 Analysis of the fouling mechanisms ............................................120 4.4.4 Microscopy .................................................................................122 4.4.5 Resistances to the permeate flux................................................123 4.4.6 Evolution of pore radii .................................................................127 4.4.7 Pressure drops ...........................................................................129 4.5 Conclusions ......................................................................................130 4.6 Acknowledgements ...........................................................................131 4.7 Nomenclature ....................................................................................132 4.8 References........................................................................................134 4.9 Supplementary Material ....................................................................138 Section III. Scale-up a of nanofiltration process for sugar reduction of grape must. Elaboration of low alcohol content wines .........................................139 Chapter 5. Comparative Study of Red Grape Must Nanofiltration: Laboratory and Pilot Plant Scales ...............................................................................143 Abstract ...................................................................................................143 5.1 Introduction .......................................................................................144 5.2 Theory ...............................................................................................147 5.2.1 The Spiral Wound Module ..........................................................147 5.2.1.1 Flow conditions in a Spiral Wound Module..............................147 5.2.1.2 Mass- transport in spacer-filled channels ................................149 5.2.2 Permeate flux decrease .................................................................149 5.2.3 Concentration Polarization. Film theory ......................................150 5.2.4 Fouling mechanism. Cake Filtration ............................................151.
(12) 5.2.5 Retention model ........................................................................ 151 5.3 Materials and Methods ..................................................................... 152 5.3.1 Membrane and Experimental Set-up ......................................... 152 5.3.2 Must .......................................................................................... 153 5.3.3 Procedure .................................................................................. 154 5.3.4 Analytical methods .................................................................... 155 5.4 Results and Discussion .................................................................... 156 5.4.1 Permeate flux evolution ............................................................. 156 5.4.2 Efficiency of the spiral wound module ........................................ 157 5.4.2.1 Analysis of the filtrated musts ................................................ 157 5.4.2.2 Sugars rejection ..................................................................... 158 5.4.3 Resistance to the permeate flux ................................................ 159 5.4.4 Fouling mechanism ................................................................... 162 5.5 Conclusions...................................................................................... 163 5.6 Acknowledgments ............................................................................ 164 5.7 Nomenclature ................................................................................... 165 5.8 References ....................................................................................... 167 Chapter 6. Alcohol reduction in red and white wines by nanofiltration of musts before fermentation ........................................................................ 173 Abstract .................................................................................................. 173 6.1 Introduction ...................................................................................... 174 6.2 Theory .............................................................................................. 175 6.3 Materials and Methods ..................................................................... 176 6.3.1 Membrane and experimental set-up .......................................... 176 6.3.2 Grape musts .............................................................................. 177 6.3.3 Procedure .................................................................................. 178 6.3.3.1 Two-stage Nanofiltrations ...................................................... 179 6.3.3.2 Single-stage Nanofiltration ..................................................... 180 6.3.4 Winemaking process ................................................................. 181 6.3.5 Analytical methods .................................................................... 181 6.3.6 Consumer sensory test .............................................................. 182 6.4 Results and discussion ..................................................................... 183 6.4.1 Nanofiltration processes ............................................................ 183.
(13) 6.4.2 Analysis of the filtered musts ......................................................186 6.4.3 Production and analysis of wines ................................................189 6.4.4 Chemical and sensory characteristics of the resulting wines ......191 6.5 Conclusion ........................................................................................193 6.6 Acknowledgments .............................................................................193 6.7 Nomenclature ....................................................................................195 6.8 References........................................................................................196 6.9 Supplementary material ....................................................................199 Section IV. Aroma recovery of grape must using pervaporation. elaboration of a full flavored low alcohol content wine ..................................................203 Chapter 7. Experimental investigation of pervaporation membranes for aroma recovery in white grape must ..........................................................207 Abstract ...................................................................................................207 7.1 Introduction .......................................................................................208 7.2 Experimental .....................................................................................210 7.2.1 Materials .....................................................................................210 7.2.1.1 Model solution ........................................................................210 7.2.1.2 Verdejo Grape Juice ...............................................................210 7.2.1.3 Membranes tested ..................................................................211 7.2.2 Experimental Set-up ...................................................................213 7.2.3 Operating conditions ...................................................................213 7.2.4 Analytical Methods .....................................................................214 7.2.5 Methods of Calculation ...............................................................215 7.3 Results and discussion......................................................................217 7.3.1 Model solution experiments ........................................................217 7.3.2 Pervaporation of grape must ......................................................220 7.4 Conclusions ......................................................................................223 7.5 Acknowledgments .............................................................................223 7.6 Nomenclature ....................................................................................225 7.7 References........................................................................................226 Chapter 8. Application of pervaporation and nanofiltration membrane processes for the optimization of sugar reduction in grape must in order to produce a full flavored low alcohol content wine ........................................231 Abstract ...................................................................................................231.
(14) 8.1 Introduction ...................................................................................... 232 8.2 Materials and Methods ..................................................................... 233 8.2.1 Pervaporation experimental set up ............................................ 233 8.2.2 Nanofiltration experimental set up.............................................. 234 8.2.3 Verdejo white grape must .......................................................... 235 8.2.4 Experimental Procedure ............................................................ 236 8.2.4.1 Pervaporation ........................................................................ 237 8.2.4.2 Two-stage nanofiltration ......................................................... 237 8.2.5 Elaboration of the corresponding wines ..................................... 239 8.2.6 Analytical Methods .................................................................... 239 8.2.6.1 Oenological parameters ......................................................... 239 8.2.6.2 Volatile compounds................................................................ 240 8.2.7 Consumer sensory test .............................................................. 241 8.2.7.1 Overall liking .......................................................................... 241 8.2.7.2 Intensity scales ...................................................................... 242 8.2.7.3 Projective mapping ................................................................ 242 8.2.7.4 Data analysis ......................................................................... 242 8.3 Results and Discussion .................................................................... 243 8.3.1 Pervaporation experiments ........................................................ 243 8.3.2 Nanofiltration experiments ......................................................... 245 8.3.3 Analysis of the resulting musts .................................................. 247 8.3.4 Production and chemical analysis of wines ................................ 249 8.3.5 Sensory characteristics of the resulting wines ........................... 250 8.3.5.1 Overall liking .......................................................................... 250 8.3.5.2 Intensity scales ...................................................................... 251 8.3.5.3 Projective mapping ................................................................ 252 8.3.6 Aromatic profile of the resulting wines ....................................... 252 8.4 Conclusions...................................................................................... 255 8.5 Acknowledgments ............................................................................ 256 8.6 Nomenclature ................................................................................... 257 8.7 References ....................................................................................... 258 8.8 Supplementary material.................................................................... 260 Section V. Main conclusions & future work ............................................... 261.
(15) Conclusions...............................................................................................265 Future directions........................................................................................271.
(16)
(17) SUMMARY.
(18)
(19) Summary SUMMARY. As it is widely known, most of the compounds that determine the sensory characteristics of wines are produced during the ripening of grapes. Along this period, the concentration of sugars, aminoacids, phenolic compounds and potassium increase, while the content of organic acids, particularly malic acid, decreases. These changes do not necessarily occur simultaneously and therefore winemakers need to consider the technological maturity (i.e. sugar content and acidity), and also the phenolic (especially anthocyannins and tannins) and aroma maturity of grapes in order to set the harvest date. Along the last years, due to climate change, various world winemaking regions have provided evidence of modified vine development and fruit maturation patterns as a consequence of global warming. Among the most important climate change-related effects there is a higher sugar content, lower acidities and modification of varietal aroma compounds. Fermentation of this must leads to alcoholic degrees higher than desired, as they may be too burning in the mouth and mask the fruity aromas and taste of wine. Premature grape harvest and winemaking should affect the final wine quality, leading to more acid and less colored wines, because the phenolic maturity would not be yet fully achieved. A commendable oenological practice establishes that the quality of wines depends essentially on the maturity of phenolic components contained in the grape berries. Therefore, in order to produce a full flavored wine, the harvest should be carried out in the optimum ripeness of the fruits and then innovative techniques to reduce the final alcohol content should be applied. Winemakers have applied these methods mainly to two different sources: wine and grape must. The most used dealcoholisation method in the industry is the spinning cone column (SCC) for the separation of volatile components from liquids and slurries. This procedure requires several steps to remove first the wine aromas and afterwards alcohol and finally the aromas are returned to the dealcoholized wine. Because it is a time consuming and expensive process, other dealcoholization techniques have been used too. Some examples are the thermal processes such as distillation columns, evaporators, or freeze concentration. Heat-based processes can produce wines with very low alcohol content, however most of the volatile aroma compounds are also lost during the ethanol removal. Reverse osmosis (RO) is also used to reduce alcohol in wines, but the problem is that RO membranes are permeable to both alcohol and water, and after the filtration it is necessary to add water again to the dealcoholized wine. This creates legal problems in some countries where the addition of water is. 1.
(20) Summary forbidden by law. Membrane processes, namely dialysis, pervaporation and vacuum membrane distillation are also being used to get low-alcohol drinks. An adequate control of sugars in musts can also be useful to obtain low alcohol degree wines. Examples of this are the use of enzymes or yeasts that use sugars for cell growth. However these methods also produce high levels of microbiological side products such as gluconic acid or esters which alter the sensory quality of the resulting wine. Processes involving membranes have also been used for reducing the sugar content. If the molecular weight of sugars in must is taken into account, nanofiltration (NF) should be the membrane process to be chosen to control them. Several studies have revealed the feasibility of NF for sugar control in grape must and the alcohol reduction of the resulting wine. However, a slight loss of color and aroma intensity and a slender unbalancing of some important substances (potassium, malic and tartaric acid) were detected. Moreover, these experiments of must nanofiltration, showed that there are some problems that are common in membrane separation processes, among them especially relevant trouble is caused by fouling and the permeate flux decline. For all these reasons, the main scope of this PhD thesis is to optimize the nanofiltration process for sugar control in grape must in order to produce full flavored wines with reduced alcohol content. For this purpose different aspects had to be evaluated and studied. First of all, it was intended to analyze the reduction of the nanofiltration permeate volume flux (Jv) due to fouling, resistances (Rj) and osmotic pressure generated by the different compounds present in must. In that sense, a detailed method for the study of the individual influence in must NF of its main low and high molecular weight compounds (LMW and HMW respectively) was developed. For this purpose a synthetic solution containing the typical LMW of natural must, namely glucose, fructose, malic and tartaric acids, potassium, sodium, calcium and magnesium was nanofiltered. The results were compared with those obtained from the filtration, under the same operation conditions, of commercial red must; which, besides the already mentioned solutes, contains HMW such as polyphenols, polysaccharides and proteins. Experiments were carried out at laboratory scale using a NF270 flat sheet membrane from Dow Filmtech in a crossflow module. The rapid formation and thickening of the gel layer on the membrane surface, during must filtration caused extreme conditions of analysis: small increase in the concentration of sugars in the retentate and rapid decline in Jv, obtaining a small volume of permeate. In spite of this, the analytical method proposed enabled the individual study of the resistances and fouling mechanism generated by LMW and HMW. The results proved that HMW have. 2.
(21) Summary more influence on the permeate flux decrease since they are the main responsible of the fouling phenomenon (cake filtration fouling mechanism), while LMW contribute to the flux decay mostly through an increase of osmotic pressure during the process. Regarding the resistances generated individually by LMW and HMW (RfLMW and RfHMW respectively) two different evolutions were observed. RfLMW remained practically constant in comparison to the RfHMW which increased progressively until reaching a maximum, beyond which there is a progressive slight decrease. The decay of RfHMW at the end of the red must filtration suggested that the cake formed may be compressible causing an osmotic pressure increase which reduces the effective pressure drop across the cake and so its resistance to Jv. Moreover, the formation of the gel layer on the membrane surface changed the selectivity to sugars, but the compression of this cake increases the retention even more. According to these results, the next issue to be assessed consisted on the selection of the most suitable NF membrane. It should show an appropriate sugars retention (pore size), about 50%, and a low affinity to HMW (manufacturing polymer) in order to maintain substantially unaltered its retention characteristics due to the accumulation of these substances on the membrane surface. In this sense, the method previously proposed was used for the systematical study and comparison of different NF membranes. The parameters evaluated were membrane fouling, resistances to permeate flux and osmotic pressure gradients through the membrane system generated individually by LMW and HMW during grape must filtration. Here, the performance of three flat sheet NF membranes was studied: NF270, from Dow Filmtech; HL, from GE: Water & Proccess technologies, and KMS SR3 from Koch Membrane Systems. Figure 1a shows that, for the three membranes, the kinetics of fouling when HMW compounds were present included three consecutive steps: pore blocking followed by cake deposition and an increase in compression until arriving to compaction (arrows in Figure 1a). Moreover, it was observed that while the cake was being assembled, sugar retention increased and arrived to a maximum when the cake was completely built. During the process, the osmotic pressure of the system increased and the effective pressure decreased in the three membranes. Once again, RfHMW increased progressively until reaching a maximum beyond which a gradual small decrease was observed. Figure 1b shows the comparison of the resistances due to fouling for the three membranes studied. Relating the cake fouling mechanism with this resistances analysis for the three membranes it was observed that, the maximum RfHMW agreed fairly well with the beginning of the third fouling mechanism, where the cake starts to be compacted.. 3.
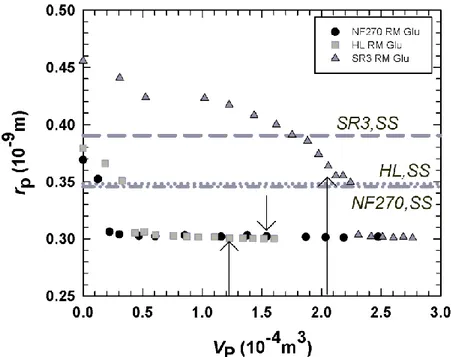
(22) Summary. Figure 1 (a) (t/VP) versus VP for each membrane during red must NF. Open symbols correspond to intermediate zone; filled symbols correspond to cake formation mechanism zone; (b) Comparison of the total fouling (Rf) resistance for the three membranes. Arrows point to the respective maxima. Apparent membrane pore size can also be used to study flux decay through the analysis of its evolution. In order to estimate pore size, a convection-difussion model was used. The model used considers only the steric partitioning in the interface, with the introduction of the applied pressure gradient term. According to it, the retention coefficient, R, is a function of the pore radius, rp. From a set of data, of Jv and R, the pore radius was estimated for the three membranes along the filtrations of the LMW model solution and grape must. In this way the evolution of the retention and effective pore radii was studied. Results showed that during the permeation of must, there was a continuous increase of retention while flow decreases slowly. This progressive increase of retention was so high that it seemed inappropriate to assume a single pore size. In this case, the model was applied to each measurement and the pore radius obtained as a function of the permeated volume. In Figure 2, the effective pore radii evaluated from must retention experiments are shown. It can be seen that there was a clear reduction of the effective pore size of the membrane (much slower, although a little larger, for the SR3 membrane). The mean pore radii for the synthetic solution are also shown here by horizontal lines. The evolution of retention and the effective pore size shows that for long filtration periods the three membranes show similar final effective pore size. In spite of the final convergence in equivalent pore radii, initial details do show differences between the membranes, especially between SR3 and the other two. Figure 2 shows a clear and pronounced drop of pore radii during the very first filtration moments for NF270 and HL. This happened as a consequence of the initial pore blocking mechanism. It appears clear that, for HL and NF270, pore blocking was the. 4.
(23) Summary main factor determining the effective pore size with a final smooth additional reduction of pore size caused by the formation of the cake. The SR3 membrane was only slightly influenced by pore blocking with a final deep reduction due to the cake deposit and its compaction. Vertical solid lines arrows in Figure 2 correspond to the maximal resistances. Thus, it seems clear that maximal resistance occurs when the trend of decrease in pore size due to the cake formation starts to stabilize. This is especially apparent for the SR3 membrane.. Figure 2.-Time evolution of pore radii calculated for each single data point of NF270 (Glu), HL (Glu), SR3 (Glu) of the red must NF process. As example the glucose (GLU) data are shown. Horizontal lines represent the average values obtained for the synthetic solution (SS) NF along the complete process. Arrows correspond to the maximum total fouling resistance for each membrane (according to Figure 1). The analysis of the flux decay and retention of sugar in musts showed that, two of the three membranes studied, HL and SR3 are appropriate to reduce the content of sugar of red must. Specifically SR3 showed the best passage of sugar and less fouling as shown in Figure 1a. Therefore SR3 membrane was selected to continue the studies. Membranes can be presented in several configurations such as: spiral wound, hollow fibers, tubular and plate-and-frame modules. Amongst them, spiral wound modules (SWM) are often preferred in industry because they offer a good balance between ease of operation, fouling control, permeation rate and packing density. Therefore, as a continuation of this research, the scale-up of the selected NF process was tested using the SR3 membrane in a spiral wound configuration. The analysis of the differences between red grape must NF at laboratory and at pilot plant scale using 5.
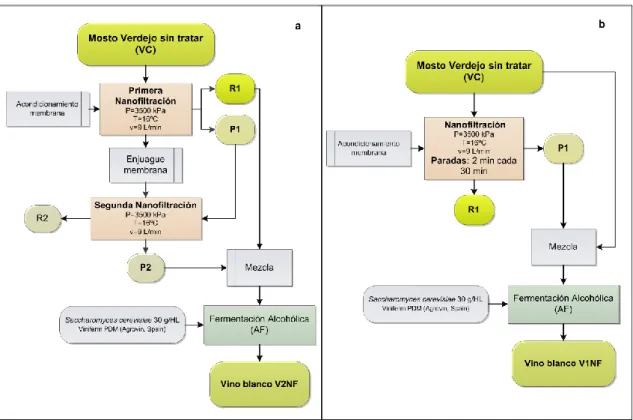
(24) Summary the same membrane were considered as the first stage of the optimization of the procedure for sugar reduction of must at a higher scale. Specifically the fouling mechanisms, sugars rejection and osmotic pressure were compared. For this purpose, the previous results obtained for the NF of grape must using the SR3 membrane in a flat sheet crossflow module were compared with those obtained for the filtration of must using the same membrane in a spiral wound module. Moreover, because in previous studies the increase of the osmotic pressure was considered to be a limiting factor of the permeate flux, the study of the increase of the applied transmembrane pressure was relevant. Therefore the effect of the variation of the applied pressure in the performance of the SWM was also analyzed in order to continue with the optimization process. The comparison of the performance of both modules allowed the analysis of the influence of feed spacers on fouling mechanism, time evolution of sugar retention and osmotic pressure during must nanofiltration. Results showed that the flow destabilization and eddy promotion caused by spacers in the SWM mitigated the rate at which the cake thickens and compacts on the membrane surface. The latter caused a less-sharp Jv decrease with more appropriate almost constant sugars rejection and small osmotic pressure differences. Furthermore, higher applied pressure promoted a higher membrane fouling and osmotic pressure that worsen the flux decay. In this sense, the optimization of the system wouldn’t consist in a simple increase of the applied transmembrane pressure but in promoting higher shear stress (presumably with a higher effective velocity) on the membrane surface combined with higher driving force (applied pressure). Thus, Jv would be increased and concentration polarization would be mitigated decreasing also the resistance toward mass transport (i.e. osmotic pressure and fouling). Aiming to select the most appropriate NF technique at pilot plant scale to reduce the alcohol content of wines different NF tests were carried out for sugar control before fermentation. Therefore the performance of single- stage and two-stage nanofiltration processes were compared for white must (Spanish Verdejo) while for red must (Spanish Garnacha) a two-stage procedure was tested. Moreover, during the single stage procedure 2-minutes-stops were performed every 30 minutes. In this way, only the osmotic pressure acts as driving force creating a backflush of permeate to the retentate. This overturn of the flow promotes shear, which may affect the deposition and detachment behavior of the fouling species on the membrane surface. Figure 3 provides as an example the scheme of the techniques tested and the mixtures of must white must carried out before fermentation.. 6.
(25) Summary. Figure 3. Scheme of the Nanofiltration procedures carried out for the Verdejo white must and ulterior fermentation. (a) two-stage and (b) single-stage nanofiltration. The analysis of the permeate flux of the different techniques showed that the use of backflush during the single-stage NF of Verdejo must was not appropriate since it caused lower permeate flow values. This means that it did not improve the productivity of the process. Apparently, the permeate backflush affects in an unexpected way the deposition of foulants and their attachment on the membrane surface, this is, on the growing cake surface. Results suggest that the re-suspension of the deposited molecules promoted by shear leads to a thinner cake or the formation of smaller aggregates. This may have higher resistance to the permeate flux and therefore be more effective in reducing the permeate flow. After the NF processes, permeate one (P1) of the single-stage or two (P2) of the two-stage were blended with untreated juice and with first retentate (R1) respectively. Mixtures were carried out in order to preserve the specific grape features linked to the high molecular weight components present the original must or retained in R1 but with lower sugar content in comparison to the original must. These blends were chemically analyzed revealing the feasibility of single-and-two- stage NF processes for sugar reduction in grape must without a significant alteration of important compounds such as polyphenols, malic and tartaric acids. Moreover, results showed that the. 7.
(26) Summary mixture (P2+R1) promoted a higher recovery of polyphenolic compounds (IPT) than with untreated must (P1+C). Three different Garnacha red wines were elaborated: A control made from the control must (GC) and two low alcohol content wines obtained from the mixture of musts (P2+R1): G2NF1 and G2NF2. Also, three different Verdejo white wines were manufactured: a control (VC), and two low alcohol content wines: one made from the mixture proceeding from the single-stage nanofiltration (P1+C): V1NF and one produced from the mixture (P2+R1) obtained from the two-stage nanofiltration process: V2NF. The corresponding wines obtained by adequate mixing of permeated and retained or control musts showed a 1 to 2 degrees alcohol reduction. Moreover, they were submitted to a sensory evaluation which revealed that none of the wine samples was particularly preferred by the consumers, showing that there were no significant differences between the control and the filtered wines. Furthermore, this evaluation showed that NF did not affect significantly the odor and color of the resulting red wines, since the G2NF1 had the highest color and odor acceptance. Regarding white wines, they showed the highest acceptance in flavor and overall liking. But sample V1NF presented lower persistence in mouth. This feature could be related, from the sensorial point of view, to a wine with a lower alcohol degree. Besides, Verdejo is a wine variety characterized by its aroma components (volatile compounds). That is why nanofiltration could be more effective in the loss of these compounds in this variety. All in all, it can be said that among the processes studied, the best NF technique is the two- stage process without backflush. This technique allows not only an appropriate sugar content reduction, but also the mixture (P2+R1) promotes a higher recovery of polyphenolic compounds (i.e. color). Besides it minimizes volume losses since the retentate of the first stage and the permeate of the second stage are used for the appropriate blend of must .Therefore, this technique could be applied at a larger scale for the production of low alcohol content wines. In order to minimize the resulting impairment of the aroma and flavor quality of the final wine, the primary aroma compounds could be recovered from the grape juice before NF and then added back to the filtered must before fermentation. In view of their intrinsic characteristics, namely high selectivity and possibility of operation at moderate temperatures, pervaporation (PV) is a membrane process that seems highly appropriate for the separation of dilute species in liquid solutions. Specifically, organophilic PV membranes have a high potential for recovering natural and naturalidentical aroma compounds, highly diluted in complex aqueous media. For the selection of the appropriate PV membrane the performance of two membranes was assessed. One was coated with polyether-block-amide (PEBA) and the other with. 8.
(27) Summary polydimethylsiloxane (PDMS). For this purpose, PV experiments were carried out using a model aqueous solution made of six of the main aroma compounds present in grape must. These substances were two aldehydes: Hexanal and Benzaldehyde and four alcohols:. isoamylalcohol,. 1-hexanol,. benzylalcohol. and. 2-phenylethanol.. The. concentration of each compound was in ppm levels. Results were then tested using natural grape must as feed of the experiments. The module used was a flat sheet crossflow module. During model solution experiments it was observed that both membranes have higher selectivity for aldehydes than for alcohols. But PEBA membrane was not selective to benzylalcohol since this compound could not be detected in its permeate. In general, PDMS membrane presented better permeation performance parameters. Both membranes showed a different permeation behavior during pervaporation of grape juice tests changing to a higher selectivity for alcohols. This means that probably aldehydes have stronger interactions than alcohols with the rest of the components of grape must. This study revealed the feasibility of pervaporation for natural aroma recovery in beverages to decrease aromatic depletion before their processing. Even though both membranes exhibited similar performance, PDMS showed the best permeation behavior to all compounds of interest and for both feeds. The last study of the present work evaluates the performance of the combination of pervaporation and nanofiltration at a higher pilot plant scale, for the elaboration of a full flavored low alcohol content wine. Based on the results obtained in the previous work, the PV SWM used was a PV-SR1 (Pervatech) with a PDMS based membrane inside for aroma recovery of grape must before NF and fermentation. Moreover, in order to reduce the time required for the NF procedure, the effective membrane area was increased in the first NF-stage (two NF SWMs arranged in parallel) and the effective crossflow velocity was increased in both stages. Two processes were studied and compared in this work in order to assess the effectiveness of PV for aroma recovery of grape must. The first process consisted of the use of a two stage NF process for the reduction of the sugar content of must. The second combined the use of PV for aroma recovery of grape must followed by the two-stage NF process for sugar reduction. A scheme that summarizes the steps and operating conditions of each process and the combination of them is depicted in Figure 4. Six different wine samples were obtained from the must blends shown in Figure 4. Two control wines (C1 and C2); two nanofiltered wines (2NF1 and 2NF2) and two pervaporated -nanofiltered wines (PV+2NF1 and PV+2NF2).. 9.
(28) Summary. Figure 4. Experimental steps carried out during the different methods proposed. Dashed blue arrows stand for PV; red dotted arrows are only for NF and purple arrows are common for both processes.. The assessment of the permeate flux showed that in terms of the PV tests the values were remarkably lower than those obtained in the previous test using the PDMS flat sheet module. This decrease is only attributable to the difference in the configuration of the modules used. On one hand the configuration in a SWM modifies the effectivity of the vacuum in the permeate side. On the other hand, as studied before, the presence of spacers modifies the hydrodynamic conditions in the retentate side modifying concentration polarization and fouling effects. Regarding the NF tests, the new experimental set up allowed the reduction of the NF time necessary for the intended sugar control. Moreover, the analysis of the aromatic profile revealed that the. 10.
(29) Summary mixture of musts (P1+R2+aromas) corresponding to the process PV+ 2NF exhibited an aroma content more similar to the original grape must with the exception of benzaldehyde and 1-hexanol. The wines produced were sensorial analyzed and Consumers’ overall liking scores showed that Sample C1 and (PV+2NF1) were the most liked. Moreover, results exhibited that consumers found the wine samples corresponding to the PV tests more similar to the control samples. The analysis of the aroma compounds of the resulting wines showed that in comparison to the most liked control wine, wines coming from the PV experiments had a more similar aromatic profile than the ones coming only from the NF tests. According to this study, it can be concluded that among the membrane processes assessed, the combination of PV and a 2 stage NF process presented the best results for the elaboration of a full flavored low alcohol content wine. Nevertheless mass transfer during the PV process needs to be enhanced. This can be presumably achieved by increasing the time of PV. Also a higher feed tangential flow or feed pressure should improve the aroma transfer if care was taken to avoid exceeding the maximal pressure drop through SWM recommended by the manufacturer.. 11.
(30)
(31) RESUMEN.
(32)
(33) Resumen RESUMEN. Como es ampliamente conocido, la mayoría de los compuestos que determinan las características sensoriales del vino son sintetizados durante la maduración de las uvas. A lo largo de este periodo, la concentración de azúcares, aminoácidos, compuestos fenólicos y sodio crece, mientras el contenido de ácidos orgánicos, principalmente el ácido málico, decrece. Estos cambios no ocurren necesariamente al mismo tiempo. Por lo tanto, para establecer la fecha de vendimia, los productores deben considerar la madurez tecnológica (es decir contenido de azúcares y acidez) y también la madurez fenólica (especialmente antocianos y taninos) y aromática de los frutos. A lo largo de los últimos años, debido al cambio climático, varias zonas productoras de vino han proporcionado evidencia de modificaciones en el desarrollo de las viñas y patrones de maduración de las bayas. Dentro de los efectos más importantes relacionados con el cambio climático se ha observado un mayor contenido de azúcares, menor acidez y la modificación de aromas varietales. La fermentación de estos mostos conduce a contenidos alcohólicos mayores a los deseados, puesto que estos vinos resultan demasiado ardientes en boca, lo cual enmascara los aromas y sabores frutales característicos. Una vendimia y fermentación anticipadas afectaría la calidad del producto puesto que se obtendrían vinos más ácidos y con menor color ya que el fruto no habría alcanzado su madurez fenólica. Las prácticas enológicas apropiadas establecen que la calidad de los vinos depende esencialmente de la madurez fenólica de los frutos. Por lo tanto, para elaborar un vino de calidad la vendimia debe ser realizada en la madurez adecuada de los frutos y luego reducir el contenido alcohólico final del producto mediante técnicas novedosas y adecuadas. Los productores han aplicado estos métodos principalmente a dos fuentes: vino y mosto de uva. El método de desalcoholización más utilizado en la industria alimentaria es la columna de cono giratorio mediante la cual se logra la separación de los compuestos volátiles de los líquidos. Este proceso requiere varias etapas para recuperar primero los aromas del vino, luego el alcohol y finalmente devolver los aromas al vino desalcoholizado. Puesto que ésta es una técnica cara y que requiere mucho tiempo, se han utilizado otros métodos de desalcoholización. Ejemplos de éstos son las columnas de destilación, evaporadores o concentradores por congelación. Los procesos térmicos de desalcoholización pueden producir vinos de baja graduación alcohólica, sin embargo, la mayoría de los compuestos volátiles son eliminados o deteriorados durante la recuperación del alcohol. La ósmosis inversa (OI) también se utiliza para la desalcoholización de vinos. El problema es que las. 15.
(34) Resumen membranas de OI son permeables tanto al alcohol como al agua y por lo tanto tras la filtración es necesaria la adición de agua al vino desalcoholizado. En algunos países esto genera problemas legales puesto que la adición de agua está prohibida por ley. Es conocido también que procesos de membrana tales como la diálisis, pervaporación y destilación por vacío con membranas también han sido utilizados para la producción de bebidas de baja graduación alcohólica. Un control adecuado de los azúcares del mosto también se considera útil para la obtención de vinos de bajo contenido alcohólico. Ejemplos de éstos es el uso de enzimas o levaduras que utilizan los azúcares para el crecimiento celular. Sin embargo, durante estos procesos, se generan elevadas cantidades de compuestos microbiológicos secundarios como ácido glucónico o diversos ésteres. Éstos alteran la calidad sensorial del vino final. También se han utilizado procesos de membrana para la reducción del contenido de azúcares en bebidas de fruta. Si se tiene en cuenta el peso molecular de los azúcares del mosto, la nanofiltración (NF) debe ser el proceso de membrana adecuado para controlarlos. Varios estudios han revelado la habilidad de la NF para el control de azúcares y la reducción del grado alcohólico del vino resultante. Sin embargo, se detectó una leve pérdida de color y de compuestos aromáticos además de un leve desajuste en la concentración de sustancias importantes como potasio y ácidos málico y tartárico. Conjuntamente, estos experimentos mostraron la existencia de problemas comunes en los procesos de separación por membrana. Entre éstos, los más importantes son los causados por el ensuciamiento de membrana y los relacionados con la disminución de flujo de permeado. Por las razones mencionadas, el objetivo principal de la presente tesis doctoral es la optimización del proceso de nanofiltración para el control de azúcares de mosto de uva con el objetivo de producir vinos de contenido alcohólico reducido que, a su vez, conserven sus características sensoriales. Para tal finalidad, se debieron evaluar y estudiar distintos aspectos. Primeramente, se realizó el análisis de la reducción del flujo de permeado (Jv) debido al ensuciamiento, las resistencias (Rj) y la presión osmótica generadas por los distintos compuestos característicos del mosto. En tal sentido, se desarrolló un método para el estudio de la influencia individual de los principales compuestos de alto y bajo peso molecular (LMW y HMW respectivamente) del mosto durante el proceso de NF. Para ello, se nanofiltró una disolución sintética que contenía los LMW característicos del mosto de uva, principalmente: glucosa, fructosa, ácidos málico y tartárico, potasio, sodio, calcio y magnesio. Los resultados fueron comparados con aquellos generados de la filtración (bajo las mismas condiciones de operación) de mosto tinto de uva. 16.
(35) Resumen comercial, el cual además de contener los solutos mencionados contiene HMW como polifenoles, polisacáridos y proteínas. Los experimentos se llevaron a cabo a escala laboratorio utilizado la membrana plana NF270 de Dow Filmtech en un módulo de flujo tangencial. La rápida formación y crecimiento de la capa de gel sobre la superficie de la membrana durante la NF de mosto, provocó condiciones extremas de análisis. Estas fueron un bajo incremento de la concentración de azúcares en el retenido y una rápida disminución de Jv, causando un pequeño volumen de permeado. A pesar de esto, el método analítico propuesto permitió el estudio de las resistencias y mecanismos de ensuciamientos generados individualmente por los LMW y HMW. Los resultados probaron que los HMW tienen mayor influencia sobre la disminución de Jv, puesto que son los principales responsables del fenómeno de ensuciamiento por formación de torta sobre la superficie de la membrana (cake filtration fouling mechanism). Mientras tanto, los LMW contribuyen a la caída de Jv principalmente a través del incremento de la presión osmótica durante el proceso. Respecto a las resistencias generadas individualmente por los LMW y HMW (RfLMW y RfHMW ) se observaron dos evoluciones diferentes. RfLMW se mantuvo prácticamente constante en comparación a RfHMW la cual aumentó progresivamente hasta alcanzar un máximo a partir del cual se observó una leve disminución. La caída de RfHMW al final de la filtración de mosto sugirió que la torta formada sobre la superficie de la membrana puede ser compresible, lo cual provoca un aumento de la presión osmótica. Ésto reduce la caída de presión efectiva a través de la torta formada y por lo tanto su resistencia a Jv. Además se observó que la formación de la capa de gel sobre la superficie de la membrana provocó el cambio de la retención de los azúcares, pero la compresión de esta capa aumento aún más la retención. De acuerdo a estos resultados, el siguiente aspecto que debía ser abordado era la selección de la membrana de NF más apropiada para el objetivo planteado. Para ello, ésta debe poseer una retención a los azúcares apropiada (tamaño de poro): aproximadamente 50% y baja afinidad hacia los HMW (polímero de fabricación) para evitar la acumulación de estas sustancias sobre su superficie y así conservar sus propiedades de retención sustancialmente inalteradas. En tal sentido, el método anteriormente propuesto se utilizó para el estudio sistemático y comparación de diferentes membranas de NF. Los parámetros evaluados fueron: ensuciamiento, resistencias al Jv y gradiente de presión osmótica a través del sistema de membrana generados individualmente por los LMW y HMW a lo largo de la NF de mosto tinto de uva. En este trabajo se estudió el funcionamiento de tres membranas de NF planas: NF270, de Dow Filmtech; HL, de GE: Water & Proccess technologies, y KMS SR3 de Koch Membrane Systems. La Figura 1a muestra que para las tres membranas el. 17.
(36) Resumen mecanismo de ensuciamiento, en presencia de los HMW estuvo compuesto de tres etapas consecutivas: bloqueo de poros, seguido de deposición de la torta y un crecimiento y compresión de la misma hasta alcanzar la compactación (flechas en la Figura 1a). A su vez, se observó un aumento en la retención de azúcares durante el crecimiento de la torta, el cual alcanzó un máximo cuando ésta estaba completamente formada. Para las tres membranas se observó que durante este proceso, la presión osmótica del sistema aumentó y por lo tanto la presión efectiva disminuyó. La RfHMW incrementó progresivamente hasta alcanzar un máximo a partir del cual se observó un leve decrecimiento. En la Figura 1b se muestra la comparación de las resistencias debidas al ensuciamiento (Rf) para las tres membranas estudiadas. Relacionando el mecanismo de ensuciamiento por formación de torta con las resistencias, se apreció que en los tres casos el máximo de Rf coincide con el comienzo del tercer mecanismo de ensuciamiento, es decir cuando la torta comienza a compactarse.. Figura 1 (a) (t/VP) versus VP para cada membrana durante la NF de mosto tinto. Los círculos blancos correponden al mecanismo intermedio, los símbolos coloreados representan en mecanismo de formación de torta. (b) Comparación de la resistencia total debida al ensuciamiento Rf para las tres membranas. Las flechas muestran el máximo en Rf correspondiente. Mediante el análisis de la evolución del tamaño de poro aparente también puede estudiarse la caída de flujo de permeado. El modelo utilizado considera únicamente la partición estérica en la interface con la introducción del término de gradiente de presión aplicada. De acuerdo a él, el coeficiente de retención, R, es una función del radio de poro rp. A partir de los valores de Jv y R obtenidos durante la filtración de LMW y de mosto tinto se estimó el radio de poro para las tres membranas. De esta forma, se estudiaron la evolución del radio de poro efectivo y la retención. Los resultados mostraron que durante la permeación de mosto ocurría un aumento progresivo en la retención mientras que el flujo disminuía lentamente. Este incremento 18.
(37) Resumen progresivo de la retención fue tan pronunciado que pareció inapropiado asumir un tamaño de poro único. En nuestro caso, el modelo fue aplicado para cada par de valores y así se obtuvo el radio de poro en función del volumen permeado. En la Figura 2 se muestra el radio de poro efectivo evaluado de los experimentos de filtración de mosto. Se puede apreciar una clara reducción en el tamaño de poro de la membrana el cual fue mucho más lento pero finalmente mayor para el caso de la membrana SR3. El radio de poro medio calculado para la disolución sintética se muestra en la figura mediante líneas horizontales.. Figura 2 Evolución del tamaño de poro calculado para cada par de valores de NF270 (Glu), HL (Glu), SR3 (Glu) en la filtración de mosto tinto. Como exemplo se muestran los valores generados para la glucosa (GLU). Las líneas horizontales representan los valores medios obtenidos durante la filtración de la disolución sintética (SS). Las flechas corresponden al máximo de la resistencia debida al ensuciamiento de cada membrana (de acuerdo a la Figura 1). La evolución de la retención y el tamaño efectivo de poro muestra que para periodos de filtración largos las tres membranas alcanzan un valor mínimo similar. A pesar de la convergencia final, los valores iniciales sí mostraron diferencias entre las tres membranas, especialmente entre la SR3 y las otras dos. La Figura 2 muestra una clara y pronunciada reducción del tamaño de poro durante los primeros instantes de filtración para las membranas NF270 y HL. Este suceso ocurrió como consecuencia del mecanismo inicial de bloqueo de poro. Claramente se aprecia que este mecanismo es el factor determinante del tamaño de poro de las membranas NF270 y HL en tanto que la formación de la torta ocasiona una pequeña disminución adicional del poro. 19.
(38) Resumen efectivo. En cambio la membrana SR3 fue mínimamente influenciada por el bloqueo de poros y se observó una pronunciada disminución final debida a la formación y compactación de la torta. Las flechas en la Figura 2 corresponden a los máximos observados en Rf. Por lo tanto, parece claro que el máximo en la resistencia ocurre cuando el tamaño de poro tiende a decrecer debido a la formación de la torta. Este hecho es especialmente notorio para la membrana SR3. El análisis de la disminución de flujo de permeado y la retención de azúcares demostró que dos de las tres membranas evaluadas, HL y SR3, son apropiadas para la reducción de azúcares en el mosto. Particularmente la SR3 mostró el mejor pasaje de azúcares y menor ensuciamiento como puede apreciarse en la Figura 1a. Por lo tanto la membrana SR3 fue seleccionada para la continuación de los estudios de la presente tesis. Como es sabido, las membranas pueden presentarse en diferentes configuraciones, tales como módulos en espiral, de fibras huecas, tubulares o de placas y marcos. Entre todos ellos, los módulos en espiral (SWM) son mayormente preferidos en la industria puesto que ofrecen una mejor relación entre facilidad de operación, ensuciamiento, flujo de permeado y densidad de empaquetamiento. Por lo tanto, como continuación de este trabajo se estudió el escalado del proceso de NF utilizando la membrana SR3 en una configuración en espiral. Para la optimización del proceso a mayor escala, se consideró apropiado primeramente analizar las diferencias principales entre las filtraciones de mosto a escala laboratorio y escala piloto utilizando la. misma. membrana.. Concretamente. se. compararon. los. mecanismos. de. ensuciamiento, retención de azúcares y presión osmótica. Para ello, los resultados obtenidos previamente, utilizando la membrana plana SR3 en el módulo de flujo tangencial, se compararon con aquellos obtenidos de la filtración de mosto de uva tinto utilizando la misma membrana en un SWM. Además, puesto que en el estudio previo se concluyó que la presión osmótica es un factor limitante en el flujo de permeado, se consideró apropiado el estudio de la influencia del incremento en la presión aplicada en el funcionamiento del SWM. La comparación del rendimiento de ambos módulos permitió el análisis de la influencia de los espaciadores en el mecanismo de ensuciamiento, evolución de la retención de azúcares y presión osmótica durante la filtración de mosto. Los resultados probaron que la desestabilización de flujo y la promoción de vórtices generada por los espaciadores en el SWM mitigaron la velocidad de crecimiento de la torta sobre la superficie de la membrana. Ésto se tradujo en una disminución menos pronunciada de Jv, una retención de azúcares constante y una diferencia de presión osmótica pequeña. A su vez, se observó que un incremento en la presión aplicada promueve un mayor ensuciamiento de la membrana. 20.
(39) Resumen y presión osmótica lo cual provocó una mayor disminución de Jv. En tal sentido, la optimización del proceso no consistiría en un simple incremento de la presión aplicada. Lo que debe hacerse es promover un mayor esfuerzo de corte sobre la superficie de la membrana (presumiblemente mediante una mayor velocidad efectiva) combinada con una mayor fuerza motriz (presión aplicada). De esta forma se incrementaría Jv y los efectos de la polarización por concentración se mitigarían reduciendo también las resistencias al transporte de masa (presión osmótica y ensuciamiento). Con el objetivo de seleccionar a escala piloto la técnica de NF más apropiada para la reducción del contenido de alcohol en vinos, se realizaron distintas pruebas de NF para la reducción de azúcares antes de la fermentación. Para ello se comparó el rendimiento de un proceso de etapa simple de NF y uno de doble etapa de NF utilizando mosto de uva blanco (Verdejo). A su vez se estudió el rendimiento en mosto tinto (Garnacha) de un proceso de doble etapa de NF. Además durante el proceso de etapa simple se realizaron paradas de 2 minutos cada 30 minutos. De esta forma sólo actúa como fuerza motriz la presión osmótica creando un flujo inverso desde el permeado hacia el retenido. Esta inversión en el sentido del flujo provoca esfuerzos de corte los cuales pueden afectar a la deposición y adhesión de los compuestos acumulados sobre la superficie de la membrana. La Figura 3 proporciona un esquema que ejemplifica las técnicas estudiadas y las mezclas de mosto blanco realizadas antes de la fermentación.. Figure 3 Esquema de los procesos de NF llevados a cabo para el mosto blanco Verdejo y posterior fermentación. (a) NF de doble etapa, (b) NF de etapa simple. 21.
(40) Resumen El análisis del flujo de permeado de las diferentes técnicas propuestas demostró que la aplicación del retro flujo durante la NF de etapa simple no fue adecuado, puesto que produjo una mayor caída de Jv. Esto significa que no mejoró la productividad del proceso. Aparentemente el retro flujo de permeado afecta inesperadamente el depósito y adhesión de las partículas sobre la superficie de membrana. Los resultados sugieren que la re-suspensión de las moléculas depositadas ocasionada por los esfuerzos de corte se traducen en la formación de una torta más delgada compuesta de agregados más pequeños. Ésta puede tener mayor resistencia al flujo de permeado y por lo tanto ser más efectiva en la reducción de Jv. Tras los procesos de NF, el primer permeado (P1) del proceso de etapa simple o el segundo (P2) del proceso de doble etapa se mezclaron respectivamente con mosto original o con el primer retenido (R1). Así estas mezclas preservan características de las uvas relacionadas con los HMW presentes en el mosto o retenidas en R1, pero con un contenido de azúcares menor al original. Las mezclas fueron analizadas químicamente revelando la habilidad de ambos procesos para la reducción de azúcares sin alterar significativamente la concentración de otros compuestos tales como polifenoles y ácidos málico y tartárico. A si mismo, los resultados mostraron que la mezcla (P2+R1) promueve una mayor recuperación de compuestos polifenólicos que la mezcla (P1+C). Se elaboraron tres vinos tintos de la variedad Garnacha: Un testigo (GC) y dos de baja graduación alcohólica a partir de la mezcla (P2+R1): G2NF1 y G2NF2. A su vez se elaboraron tres vinos blancos de la variedad Verdejo: un testigo (VC) y dos vinos de bajo contenido alcohólico, uno proveniente de la mezcla (P1+C): V1NF y otro producido a partir de la mezcla (P2+R1): V2NF. Los vinos obtenidos mostraron una reducción del contenido alcohólico entre 1 y 2 grados. Además éstos fueron evaluados sensorialmente por un panel de consumidores. Los resultados afirmaron que ninguno de los vinos fue particularmente preferido por los consumidores. Esto significó que no existieron diferencias significativas entre los vinos testigo y los nanofiltrados. A su vez, este análisis reveló que la NF no afectó el olor y color de los vinos obtenidos. Particularmente los vinos blancos presentaron los valores más altos en sabor y aceptabilidad global. Pero la muestra V1NF exhibió los valores de persistencia en boca más bajos. Este atributo puede estar relacionado sensorialmente con una baja graduación alcohólica. Además la variedad Verdejo se caracteriza por ser muy aromática, es decir por poseer una mayor cantidad de compuestos volátiles. Es por ello que la NF puede ser más efectiva en la pérdida de estos compuestos en esta variedad de vino.. 22.
(41) Resumen En general, puede decirse que entre los procesos estudiados, la mejor técnica de NF fue el proceso de doble etapa sin retro flujo. Este método permitió no solamente una correcta reducción de azúcares sino que a su vez la mezcla (P2+R1) promueve una mayor recuperación de compuestos polifenólicos (color) y una menor pérdida de volumen útil. Con la finalidad de minimizar el deterioro de la calidad aromática y de sabor detectados, los compuestos aromáticos primarios podrían ser recuperados de la alimentación antes de la NF y ser agregados nuevamente al mosto filtrado antes de la fermentación. Debido a sus características intrínsecas, principalmente alta selectividad y posibilidad de trabajo a temperaturas moderadas, la pervaporación (PV) parece ser el proceso de membrana más apropiado para la recuperación de compuestos altamente diluidos en matrices acuosas complejas. Para la selección de la membrana de PV más apropiada se evaluó el funcionamiento de dos membranas. Una de ellas recubierta. del. polímero. polyeter-block-amida. (PEBA). y. la. segunda. de. polydimetilsiloxano (PDMS). Para tal fin se llevaron a cabo experimentos de PV utilizando una disolución modelo acuosa compuesta de seis de los principales compuestos aromáticos característicos del mosto de uva. Estas sustancias fueron, dos aldehídos: hexanal y benzaldehído y cuatro alcoholes: alcohol isoamílico, 1- hexanol, alcohol bencílico y 2- feniletanol. La concentración de cada compuesto fue del orden de los ppm. Los resultados fueron luego comparados con aquellos generados de la PV de mosto de uva natural. Los experimentos se llevaron a cabo a escala laboratorio en un módulo de membrana de flujo tangencial. Durante los experimentos utilizando la disolución modelo, se observó que ambas membranas tienen una mayor selectividad hacia los aldehídos que hacia los alcoholes. Sin embargo, la membrana de PEBA no fue selectiva hacia el alcohol bencílico puesto que no se detectó su presencia en el permeado. En general la membrana de PDMS demostró mejores parámetros de funcionamiento. Ambas membranas exhibieron un comportamiento de permeado distinto durante la PV de mosto de uva. En este caso, ésta fue mayor hacia los alcoholes. Ello significa que probablemente los aldehídos poseen mayor interacción con los compuestos de la matriz del mosto que los alcoholes. Por lo tanto, este estudio reveló la habilidad de la PV para la recuperación de aromas naturales antes del procesado de bebidas con el objetivo de disminuir el deterioro aromático del producto. Finalmente, a pesar de que ambas membranas mostraron un rendimiento similar, la de PDMS presentó una mejor permeación hacia todos los compuestos de interés en ambas alimentaciones. El último estudio realizado en este trabajo, evalúa el funcionamiento de la combinación de los procesos de pervaporación y nanofiltración a escala piloto para la. 23.
Figure


+7


![Table 1.2 Classification of carbohydrates in winemaking according to origin and biological function [24]](https://thumb-us.123doks.com/thumbv2/123dok_es/2938497.552730/54.892.113.749.888.1028/table-classification-carbohydrates-winemaking-according-origin-biological-function.webp)
![Figure 2.1 Retention as a function of transmembrane pressure. Trends for UF,NF and RO [2]](https://thumb-us.123doks.com/thumbv2/123dok_es/2938497.552730/70.892.156.636.219.625/figure-retention-function-transmembrane-pressure-trends-uf-nf.webp)
Documento similar
If the concept of the first digital divide was particularly linked to access to Internet, and the second digital divide to the operational capacity of the ICT‟s, the
In the “big picture” perspective of the recent years that we have described in Brazil, Spain, Portugal and Puerto Rico there are some similarities and important differences,
1. S., III, 52, 1-3: Examinadas estas cosas por nosotros, sería apropiado a los lugares antes citados tratar lo contado en la historia sobre las Amazonas que había antiguamente
In the preparation of this report, the Venice Commission has relied on the comments of its rapporteurs; its recently adopted Report on Respect for Democracy, Human Rights and the Rule
H I is the incident wave height, T z is the mean wave period, Ir is the Iribarren number or surf similarity parameter, h is the water depth at the toe of the structure, Ru is the
In the previous sections we have shown how astronomical alignments and solar hierophanies – with a common interest in the solstices − were substantiated in the
It is generally believed the recitation of the seven or the ten reciters of the first, second and third century of Islam are valid and the Muslims are allowed to adopt either of
ABSTRACT Transformation of the Specialized Knowledge of Future Primary Teachers on Fraction Division
From the phenomenology associated with contexts (C.1), for the statement of task T 1.1 , the future teachers use their knowledge of situations of the personal
