INTRODUCTION
Cage aquaculture of fish releases inorganic nitro-gen (N) in the form of ammonium (NH4) and inor-ganic phosphorus (P) in the form of phosphate (PO4) excreted by the fish to the surrounding water. Almost
all or ganic waste is released as faeces, which sink out of the water column but may partly dissolve and enter the water eventually (Olsen & Olsen 2008, Wang et al. 2012). The release of inorganic N and P can potentially cause eutrophication. Most eutrophi-cation studies have focussed on the effects on
pri-© The authors 2017. Open Access under Creative Commons by Attribution Licence. Use, distribution and reproduction are unrestricted. Authors and original publication must be credited. Publisher: Inter-Research · www.int-res.com
*Corresponding author: [email protected]
Responses in bacterial community structure to
waste nutrients from aquaculture: an
in situ
microcosm experiment in a Chilean fjord
Lasse Mork Olsen
1,*, Klaudia L. Hernández
2, Murat Van Ardelan
3, Jose Luis Iriarte
4, 5,
K. Can Bizsel
6, Yngvar Olsen
71Norwegian Polar Institute, Fram Centre, 9296 Tromsø, Norway
2Facultad de Ecologia y Recursos Naturales, Universidad Andres Bello, 2520000 Viña del Mar, Chile 3Norwegian University of Science and Technology, Dept. of Chemistry, 7491 Trondheim, Norway
4Instituto de Acuicultura and Centro FONDAP de Investigación Dinámica de Ecosistemas Marinos de Altas Latitudes (IDEAL), Universidad Austral de Chile, 5480000 Puerto Montt, Chile
5COPAS-Sur Austral, Centro de Investigación Oceanográfica en el Pacífico Sur-Oriental (COPAS), Universidad de Concepción, 4030000 Concepción, Chile
6Dokuz Eylül University, Institute of Marine Sciences and Technology, Bakü Bulv. No. 100, 35340 Inciralt, Izmir, Turkey 7Norwegian University of Science and Technology, Dept. of Biology, 7491 Trondheim, Norway
ABSTRACT: Chilean salmon farms release inorganic nutrients excreted by the fish into the sur-rounding water in Patagonian fjords. The objective of this experiment from the Comau Fjord (42.2° S) in southern Chile was to study how increased input of ammonium (NH4) and phosphate (PO4) from salmon farms might affect the community structure of bacteria in surface waters where fish farms are located. We used microcosms (35 l) with NH4-N and PO4-P added to the natural sea-water in a gradient of nutrient-loading rates, with the same N:P ratio as in salmon aquaculture effluents. Additionally, we measured bacterial community structure at different depths in the Comau Fjord to assess the natural variation to compare with our experiment. We used denaturing gradient gel electrophoresis (DGGE) to create 16S rDNA fingerprints of the bacterial communities and monitored biological and environmental variables (chlorophyll a, inorganic nutrients, pH, microbial abundance). The nutrient-loading rate had a significant impact on the bacterial commu-nity structure, and the commucommu-nity dissimilarity between low and high nutrient additions was up to 78%. Of the measured environmental variables, phytoplankton abundance and increased pH from photosynthesis had a significant effect. We observed no significant changes in bacterial diversity, which remained at the same level as in the unmanipulated community. Thus, the bac -terial community of the fjord was not resistant, but resilient within the time frame and nutrient gradient of our experiment.
KEY WORDS: Aquaculture · Eutrophication · Microbial community · Bacterial diversity · Chile · Patagonia
O
PEN
PEN
mary production and resulting algal blooms (Ferreira et al. 2011), whereas very few have investigated the effects on the bacterial community structure. Seawa-ter contains 108−109bacteria l−1and hundreds of spe-cies in a community under normal natural conditions (Torsvik et al. 2002). Marine bacteria have important roles in the recycling of biomass and in biogeochem-ical cycling of essential elements for life, and they play an ecological role in the microbial food web (Azam et al. 1983, Falkowski et al. 2008, Gilbert & Neufeld 2014). Possible regulating factors for bac -terial community structure are inorganic nutrients (Fisher et al. 2000), the type and availability of or -ganic substrate (Cottrell & Kirchman 2000, Gómez-Consarnau et al. 2012), mortality from predation and virus infection (Langenheder & Jürgens 2001, Töpper et al. 2013), physicochemical variables like tempera-ture, salinity and pH (Krause et al. 2012, Campbell & Kirchman 2013) and possibly other biotic interactions such as allelopathy (Long & Azam 2001). Previous field studies indicated that bacterial community com-position and diversity changed after an increase in nutrient loading (Fisher et al. 2000, Schäfer et al. 2001). In the microbial ecosystem, this is likely to be the result of a complex response, with bottom-up effects from increased productivity and top-down effects from predation and some of the other regulat-ing factors mentioned above (Lebaron et al. 1999, Bohannan & Lenski 2000, Schäfer et al. 2001, Horner-Devine et al. 2003).
Very large changes in the bacterial community may disturb its functions and possibly favour species that might be harmful or a nuisance to aquatic organ-isms, including aquaculture fish, and to people. In soil microbiology, there is a concept of healthy soil, which harbours a healthy microbial community, i.e. one that is maintaining its biogeochemical processes, and sustainability of agriculture or land use can be related to it (Kennedy & Stubbs 2006). It might be useful to have a similar concept for the seawater microbial community to aid the management of coastal and fjord waters.
The Comau Fjord (42.2° S, northern Patagonia, Chile) is naturally prone to N-limitation of the pri-mary production in surface water (Iriarte et al. 2007, 2013) and has cage aquaculture activity along the shores. In an in situmicrocosm experiment, L. Olsen et al. (2014) studied how the microbial food web in the Comau Fjord responded to increased inorganic nutrient loading with a nitrogen to phosphorus ratio of 28 (mol:mol), typical for aquaculture (Olsen & Olsen 2008, Wang et al. 2012). The main result of that study was a positive linear biomass response to an
ammonium-loading gradient observed in the micro-autotrophic, micro-heterotrophic and meso-hetero-trophic functional groups, dominated by phytoplank-ton, ciliates and copepods, respectively (L. Olsen et al. 2014). This is similar to the response found in other temperate coastal waters (Olsen et al. 2006, 2007). Both in the Comau Fjord (L. Olsen et al. 2014) and in Atlantic water (Olsen et al. 2006), the relative contribution of bacteria to biomass decreased with increasing nutrient-loading rate.
Here we focussed on how bacterial community structure and diversity were affected by increased loading rate of inorganic nutrients with an aquacul-ture effluent N:P ratio, in the microcosm experiment described in L. Olsen et al. (2014). We used denatur-ing gradient gel electrophoresis (DGGE) to make 16S rDNA fingerprints of the bacterial communities, and we monitored environmental variables. In addition, we created a depth profile of bacterial community structure and environmental variables in the Comau Fjord for comparison with our experiments. By com-paring the community dissimilarity between treat-ments and comparing with the natural communities and literature values, we tried to quantify the impact of changes in nutrient loading. With direct gradient analysis (redundancy analysis), we tested whether the nutrient-loading gradient had a significant effect on the community and attempted to elucidate which environmental factors had the strongest effect.
MATERIALS AND METHODS
This study is partly based on the microcosm ex -periment described by L. Olsen et al. (2014). For a more detailed description of the experimental setup and methods, see that study.
Microcosm experiment
Experimental setup
pier and was pre-screened through a 100 µm net and mixed in a polyethylene container before all micro-cosm containers were filled. Copepods, mainly small calanoid species, were added to a concentration of 0.25 ind. l−1, equal to the in situ concentration. Pre-filtering and subsequent addition of copepods was done to ensure an equal abundance in all micro-cosms. The microcosms were incubated at 2 m depth to ensure stable in situtemperature. The irradiance in the microcosms ranged from 70 to 350 µmol pho-tons m−2s−1. The microcosms were mixed daily when they were taken up for sampling and/or nutrient addition (L. Olsen et al. 2014).
Nutrient addition
Ammonium and phosphate were added according to the 8 treatments summarized in Table 1. The N:P ratio was set to 28 (mol:mol), which is typical for nutrient emission from salmon farms (Wang et al. 2012). No nutrients were added to Treatment 1, and Treatment 2 was intended to mimic natural loading with an N:P ratio of 16 (Redfield 1958). Silicon was added to achieve an N:Si ratio of 1, which is the aver-age natural ratio (Redfield 1958). Three replicate microcosms were established for the 8 levels of nutri-ent addition, i.e. 24 containers in total. Nutrinutri-ents were added once every day in the afternoon. On sampling days, the nutrients were added after the sampling was finished.
Sampling and measurements
Every second day, 1 l water samples for chloro-phylla(chl a), pH and nutrients were measured on almost every sampling day, whereas flagellates were counted on Days 2, 8, 10 and 16, bacteria on Days 2, 6, 10 and 16, and phytoplankton on Days 0, 4, 10 and 16 (L. Olsen et al. 2014) were retrieved. The micro-cosms were mixed by carefully turning the contain-ers before sampling.
Samples for chl a analysis were collected on GFF filters before pigment extraction for 24 h in 90% ace-tone and measurement in a fluorometer (Turner TD 700) before and after acidification (Holm-Hansen & Riemann 1978). Nitrate, phosphate and silicic acid were measured in an auto-analyser (Technicon), described by Atlas et al. (1971). Ammonium was measured by the indophenol blue method (Grasshoff et al. 1983). Seawater pH was measured with a com-bined glass electrode with an Ag/AgCl reference electrode (Radiometer). The pH electrode was cali-brated with NBS buffer solutions at 20°C.
For counts of bacteria and nanoflagellates, 50 ml samples were preserved with glutaraldehyde (2% v/v) and stored in the dark at 4°C before the cells were counted by epifluorescence microscopy in a Zeiss Axiostar microscope. Bacteria were stained with DAPI on 0.2 µm black polycarbonate filters (Millipore) to a final concentration of 0.01% v/v (Porter & Feig 1980). Nanoflagellates (20 to 30 ml) were filtered stained with proflavine (3-6-diamidine-acridine hemi-sulfate) on 0.8 µm black polycarbonate filters (Millipore) to a final concentration of 0.033% w/v (Hass 1982). Phytoplankton, ciliates and zoo-plankton were counted by light microscopy as de -scribed in L. Olsen et al. (2014).
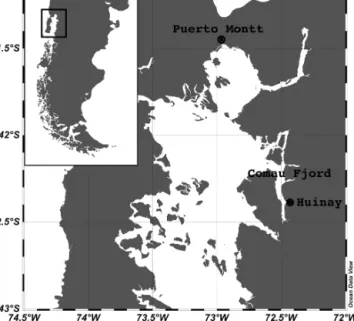
Fig. 1. Comau Fjord and Huinay Field Station in the Los Lagos region, Chile
Treatment LN LP N:P
T1 0.00 0.00
T2 0.30 0.019 16
T3 0.50 0.018 28
T4 0.70 0.025 28
T5 1.00 0.036 28
T6 1.40 0.050 28
T7 2.00 0.071 28
T8 3.00 0.107 28
Table 1. Loading rates (µmol l−1 d−1) for ammonium (L
N,
NH4-N) and phosphate (LP, PO4-P) and N:P ratio (mol:mol)
Polymerase chain reaction (PCR) and DGGE
On Day 16 (endpoint), water samples from repli-cate 1 of each of the 8 treatments were filtered onto 0.2 µm Isopore membrane filters (Millipore). In addi-tion, samples were taken on Days 6 and 10 from Treatments 4 and 6, representing medium and high nutrient-loading rates, respectively (Table 1). On Day 0 (d0), 1 sample was taken from the water from 10 m used for the experiment before it was distrib-uted to the microcosms, and an additional water sample was collected from 2 m depth. Genomic DNA was extracted from the collected membrane filters by using the PowerSoil DNA isolation kit (MoBio). After extraction, DNA was suspended in 50 µl of sterile Milli-Q water, and conserved at −80°C until used. DNA concentration was measured with a Qubit 2.0 fluorometer, using the Qubit assay wherein a dye flu-oresces when bound to DNA (Qubit 2.0 fluorometer user manual).
Bacterial 16S rDNA was amplified by PCR. First, fragments of 1500 bp were obtained with primers Eub27F and Eub1542R (Stackebrandt & Liesack 1993). Thereafter, DNA samples were amplified with the eubacterial primers 341f-gc and 915R (Muyzer & Ramsing 1995). PCR products were checked by elec-trophoresis on 1% agarose gels and subsequently stained with Sybersafe (0.5 mg ml−1). DGGE was performed according to Muyzer et al. (1993) in the D Gene System (BioRad). A denaturant gradient from 40 to 70% (100% denaturant was 7 M urea plus 40% [wt/vol] formamide), increasing in the direction of electrophoresis, was used. The gels were subjected to a constant voltage of 200 V for 6 h at 60°C, and after electrophoresis, they were stained for 20 min in 1.25× TAE containing 1× (final concentration) SYBR Green (Molecular Probes) and photographed under UV illumination. The DGGE band patterns were analysed with the Gel2k software version 1.2.6 (de -veloped by Svein Norland, University of Bergen, Norway). Gel2k quantified the intensities of the bands compared to the background of the lanes.
Depth profile sampling
On 24 January 2010, depth profile sampling was undertaken outside of Huinay Field Station approxi-mately in the middle of the Comau Fjord, which was considered to be a representative location of the fjord (Elizondo-Patrone et al. 2015), allowing deeper sam-pling than at the pier. At selected depths (5, 10, 15, 20, 40 and 100 m) samples were taken for chl a,
inorganic nutrients (NO3, PO4, Si, NH4), pH and for PCR-DGGE fingerprints of the bacterial community. These were analysed with the methods described for the main experiment. In addition, a sample from the brackish layer at 2 m depth was taken for community analysis at the start of the experiment on 18 January.
Statistical analysis
Dissimilarity matrices for the community samples were calculated from band intensities in the DGGE fingerprints from the 2 experiments and the depth profile samples. In this study, we focussed mainly on the difference in bacterial species composition be -tween samples, and therefore we chose to use the Bray-Curtis dissimilarity, which is a commonly used measure for species counts and ignores double zero samples (Legendre & Legendre 2012). The Bray-Curtis dissimilarity matrices were visualized with non-metric multidimensional scaling (NMDS) ordi-nations. In NMDS, the stress denotes the mismatch between the rank order of the dissimilarity in the data and of the dissimilarity in the ordination, and the samples are moved repeatedly until the stress reaches a minimum. This stress value is reported. The linear fit R2is the correlation between fitted val-ues and ordination distances. Increasing the number of dimensions in the ordination will reduce the stress, but the goal is to reduce the multidimensional data to as few dimensions as possible. Therefore, the num-ber of dimensions was chosen for which an accept-able stress value, i.e. below 0.1, was obtained.
The correlation between the Bray-Curtis dissi -milarity matrices for the phytoplankton community, presented in L. Olsen et al. (2014), and the bacterial community was assessed with Mantel tests. The bac-terial matrix from Day 16 (final) was tested against the matrices for the phytoplankton community from Day 16, and also from Day 10 to check for possible delayed effects of algal composition on the bacterial composition on Day 16. The data on the abundance of phytoplankton and other functional groups of plankton were obtained from L. Olsen et al. (2014). The environmental data matrix was standardized by the formula [(n −average n)/SD] + 3 to correct for the widely differing scales of the measured variables.
in L. Olsen et al. (2014), were also included in the analysis. The significance of the constraints or axes was assessed by permutation tests for RDA using 999 permutations (R documentation, package vegan ver-sion 1.16-32). All statistical analyses were performed in the R 2.9.1 platform (R Development Core Team 2008), except diversity, which was assessed with the Shannon diversity index calculated in PAST (Ham-mer et al. 2001). Approximate confidence intervals for the Shannon index were computed with a boot-strap procedure. We produced 9999 random samples, each with the same total number of individuals as in the original sample. For every individual in the ran-dom sample, the taxon was chosen with probabilities proportional to the original abundances. A 95% con-fidence interval was then calculated (PAST manual).
RESULTS
Microcosm experiment
Data on the concentrations of the inorganic nutri-ents, the abundance of all functional plankton groups
and the micro-phytoplankton community composi-tion were presented in L. Olsen et al. (2014). Nitrate and ammonium were almost depleted throughout the experiment, with a slightly higher ammonium con-centration measured in the highest addition treat-ments. Phosphate was not depleted in any treatment. Ammonium and phosphate were added in the same ratio in all treatments except in Treatment 2 (see Table 1), which mimicked natural nutrient loading. For statistical analysis involving the nutrient-loading gradient, ammonium was used, since it was the nutri-ent most likely to induce a response because it was the limiting nutrient, at least in the low addition treatments (L. Olsen et al. 2014).
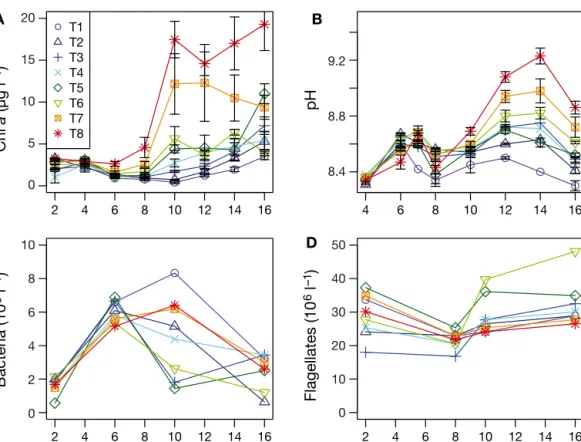
The chl aconcentration responded to the ammo-nium-loading gradient during the experiment (Fig. 2A). From Day 6 and throughout the experiment, linear regression showed a significant positive relationship (p < 0.05, not shown) between chl a concentration and ammonium-loading rate. The pH in the micro-cosms increased with increasing ammonium-loading rate (Fig. 2B). Bacterial abundance increased in all treatments initially from (1−2) × 109 l−1on Day 2 to (5−7) × 109l−1on Day 6. On Day 10 the abundance
2 4 6 8 10 12 14 16
A
Chl
a
(µg l
–1
)
Bacteria (10
9
l
–1
)
Flagellates (10
6
l
–1
)
T1 T2 T3 T4 T5 T6 T7 T8
4 6 8 10 12 14 16
B
pH
2 4 6 8 10 12 14 16
C
Day
2 4 6 8 10 12 14 16
D
Day
20
15
10
5
0
10
8
6
4
2
0
9.2
8.8
8.4
50
40
30
20
10
0
Fig. 2. Development of (A) chlorophyll a(chl a) concentration, (B) pH, (C) abundance of DAPI-stained bacteria and (D) proflavine-stained nanoflagellates from the microcosm experiment. T1−8 refer to the nutrient-loading treatments described in
increased to around 8 × 10⁹l–1in T1 and to around 6 × 10⁹l–1in T7 and 8, whereas it had started to decrease since Day 6 in all other treatments. On Day 16 the abundance was close to the initial level in all treat-ments (Fig. 2C). The abundance of flagellates varied between 20 and 40 million l−1 on Day 2, and remained between 20 and 30 million l−1for the other sampling days throughout the experiment, with the exception of Treatments 5 and 6, which showed slightly higher counts (Fig. 2D). We found no signifi-cant linear relationships between the abundances of bacteria or flagellates and the ammonium-loading rate, except for a negative relationship with bacteria on Day 6 (L. Olsen et al. 2014).
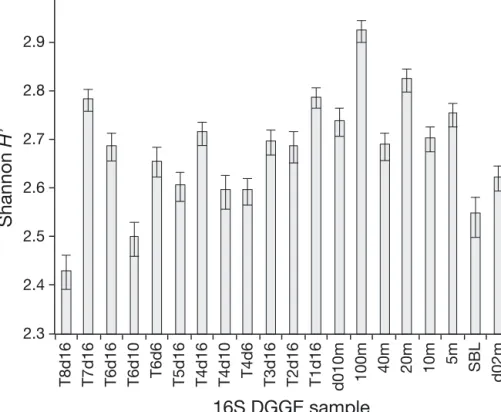
The NMDS ordination and Bray-Curtis dissimilar-ity matrix (Fig. 3A,B) show how the bacterial commu-nity composition changed during the experiment. We have samples from Days 6 and 10 only for Treatments 4 and 6. The communities in these 2 treatments fol-lowed a similar successional pattern from Day 0 to Day 16 (white arrows in Fig. 3A). The other treat-ments also had a succession and were removed from the Day 0 community, but low and high treatments diverged on Day 16 (grey arrows in the ordination, Fig. 3A). RDA of the community data for all treat-ments on Day 16 with the nutrient (ammonium)-loading rate as the only constraint indicated that ammonium significantly constrained the bacterial community composition at this time (p < 0.05, not shown). The number of DGGE bands obtained was 20 to 24 at all times in all treatments. The Shannon diversity index varied between 2.5 and 3 in the samples from the microcosm experiment (Fig. 4).
According to a linear regression of the Shannon index as a function of the ammonium-loading gradi-ent, on Day 16 there was no significant effect of the gradient on diversity (p = 0.077). The RDA ordination based on the DGGE band matrix from all samples from the microcosm experiment is shown in Fig. 5. The permutation test indicated significance of the constraints on microbial community structure when all constraints (environmental variables) were in cluded (p = 0.036). When testing for individual en -vironmental variables as constraints, ammonium-loading rate (LN), pH, chl a and phytoplankton abundance were significant (p < 0.05). The Mantel tests for correlation between the community dissimi-larity matrix of bacteria on Day 16 with the matrices for phytoplankton on Days 10 and 16 did not show a significant correlation, suggesting that neither past nor present algal community composition had a sig-nificant impact on bacterial community composition.
Depth profiles of environmental variables and bacterial community fingerprints in the fjord
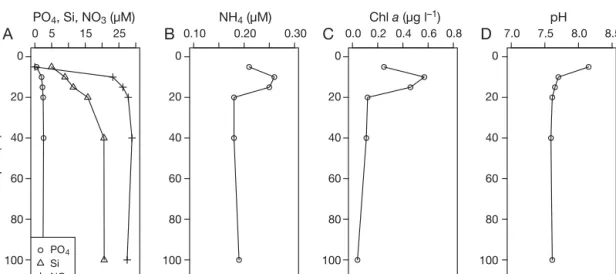
The depth profiles from the middle of the fjord showed that nitrate (NO3) and silicon (Si) were de -pleted and phosphate (PO4) was reduced to 0.5 µM, at 5 m depth, whereas all started to increase at 10 m (Fig. 6). At 100 m, the concentrations of NO3, Si and PO4 were 28, 21 and 2.4 µM, respectively. The am -monium (NH4) concentration showed a small peak of ~0.25 µM at 10 and 15 m, whereas it showed values around 0.15 µM in deeper water (Fig. 6). The profile Fig. 3. (A) Non-metric multidimensional scaling (NMDS) ordination where the distances between samples are based on the ranks of the Bray-Curtis dissimilarities between 16S DGGE fingerprints from the 8 treatments (T1−8, Table 1) and Day 0 (d0) of the microcosm experiment, with day (d) number denoted. The figure shows axis 1 and 2 of a 3-dimensional ordination (stress = 0.054, R2= 0.98). The white arrows indicate the direction of bacterial community succession of T4 and T6 (encircled), and the
for chl a followed the ammonium vertical pattern, showing a subsurface maximum in concentration at 10 and 15 m of 0.5−0.6 µg chl a l−1, decreasing at deeper waters (0.2 µg l−1; Fig. 6). The pH was 7.6 in the deep water and increased to 8.2 from 10 to 5 m depth (Fig. 6).
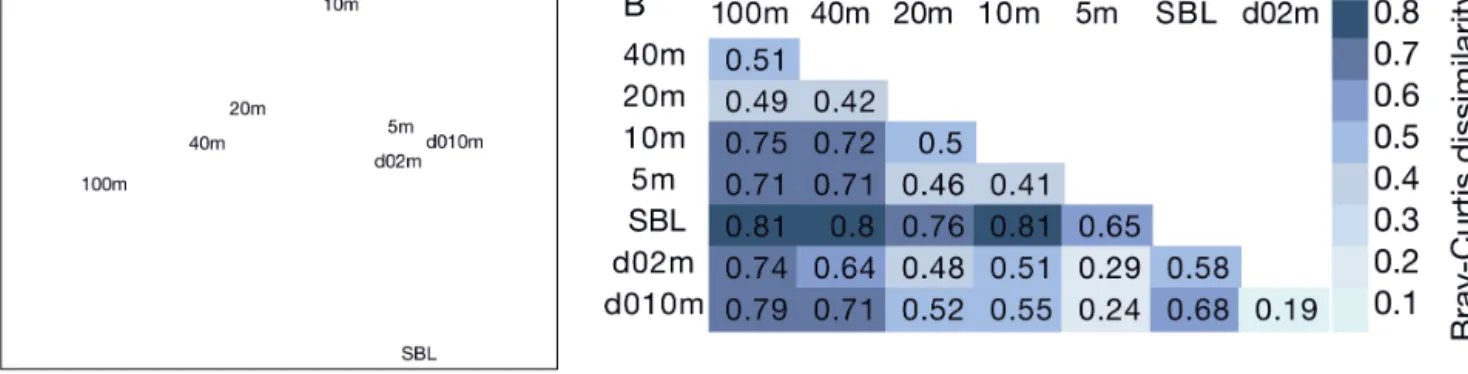
Bacterial community structure was similar for the sample from 5 m in the middle of the fjord and the 2 samples from 2 and 10 m at the Huinay pier on Day 0 of the experiment. The sample from 10 m in the mid-fjord depth gradient was 40−50% dissimilar from those samples, and the community composition was increasingly different at 20, 40 and 100 m depth (Fig. 7A,B). The sample at the surface boundary layer had a very different bacterial community (Fig. 7A,B). The Shannon diversity index for the bacterial DGGE fingerprints in the depth gradient was between 2.6 and 2.9, with the lowest value for the surface bound-ary layer (Fig. 4).
DISCUSSION
Bacterial community structure in the nutrient-loading gradient
Treatments 4 and 6 showed a similar succession in the structure of the bacterial community, whereas in treatments with higher or lower nutrient-loading
rates, the communities diverged on Day 16, as seen in the NMDS ordination (Fig. 3A). The high Bray-Curtis dissi milarity between the Day 0 bacterial community and the communities in all samples from Day 16, in-cluding the low nutrient-loading treatments (Fig. 3B), suggested that the experimental con ditions, including the pumping and re-distribution of the water from 10 m depth to the microcosm containers, contributed to drive the succession initially. On Day 16, the loading rate was a significant constraint on community structure according to the RDA direct gradient ana -lysis. This suggests that the community dissimilarity between the treatments on Day 16 (Fig. 3A,B) was pri-marily caused by the different nutrient-loading rates. A time series study from a coastal site in California (USA) showed that the bacterial community at 5 m depth studied with automated ribosomal inter genic spacer analysis, another fingerprinting method, could change by about 50% in a month, measured as Bray-Curtis dissimilarity (Fuhr man et al. 2015). The maximum dissimilarity was found between winter and summer, with approximately 60% change. Over 10 yr, the average change in community structure was 60%. Thus, the highest dissimilarity of 78% observed in our nutrient-loading gradient of the microcosm experiment on Day 16 (Fig. 3B) was higher than the difference between summer and winter samples and the average 10 yr change reported by Fuhrman et al. (2015). The maximum
2.3
2.4
2.5
2.6
2.7
2.8
2.9
3
T8d16
T7d16
T6d16
T6d10
T6d6
T5d16
T4d16
T4d10
T4d6
T3d16
T2d16
T1d16
d010m
100m
40m
20m
10m
5m
SBL
Shannon
H
’
d02m
16S DGGE sample
Fig. 4. Shannon diversity index (H’) calculated from the 16S DGGE fingerprints for the com-munities in the main microcosm experiment with Treatments 1−8 (T1−8, see Table 1) on different experimental days (d), the depth gradient in the Comau Fjord from 5 to 100 m, the surface boundary layer (SBL) and the samples from 2 and 10 m at Huinay pier at the start of the main microcosm exper-iment (d0). Error bars denote 95% confidence intervals calculated by
dissimilarity between the communities from surface and deep water in the Comau Fjord at the time of the experi-ment was 75%, whereas the dissimilar-ity between the communities at 10 m depth close to the shore and in the mid-dle of the fjord several days apart was 55% (Fig. 7B). It seems that the surface bacterial community of the fjord can be quite dynamic with around 50% change on short temporal or spatial scales. In comparison, the coastal surface com -munity studied by Fuhrman et al. (2015) changed 30 to 40% in a few days. More stable environmental conditions in deeper waters lead to more stable community composition and is presumably the rea-son for the bigger difference between surface and deeper waters observed by us and by others (Ghiglione et al. 2008, Fuhrman et al. 2015, Yu et al. 2015).
The nutrient-loading gradient in our experiment caused a variation in com-munity structure of the same magnitude as the maximal natural depth variation in the fjord, and higher than the varia-tion in the top 10 m of the water column. The bacterial diversity was not signifi-cantly affected by the ammonium-loading rate on Day 16 according to linear re -gression (p = 0.077). It was comparable to the diversity of the natural commu-nity, which was similar between depths (Fig. 4). Our finding that the diversity
– 4 –2 0 2 4 6 8
Fig. 5. Redundancy analysis (RDA) plot based on the square root-transformed DGGE band intensity matrix and standardized environmental variables (NH4:
ammonium, NO3: nitrate, Si: silicon, LN: ammonium-loading rate, chl a:
chloro-phyll aand abundance of bacteria, flagellates and phytoplankton) from all sam-ples from the microcosm experiment. The environmental variables are shown as vectors. The samples are represented by treatment number (T1−8, see Table 1) and day number (d); d0 is the Day 0 sample. Small circles indicate DGGE bands representing bacterial species. Of the variance, 89% was constrained by the components (axes), i.e. environmental variables. The proportion of the total vari-ance explained by the first 2 axes was 41%, and of the constrained part of the variance, the first 2 axes covered 46%. The permutation test for RDA indicated significance of the constraints on microbial community structure when all con-straints (environmental variables) were included (p = 0.036). When testing for in-dividual environmental variables as constraints, ammonium-loading rate (LN),
pH, chlorophyll a(chl a) and phytoplankton abundance were significant (p < 0.05)
Depth (m)
was maintained suggests that the bacterial commu-nity re mained healthy, following the theory that diversity ensures stability and functional resilience (Girvan et al. 2005).
PCR-DGGE detects all populations constituting more than 1% of the bacterial community (Muyzer & Smalla 1998, Fromin et al. 2002), potentially leaving rare species undetected (Torsvik et al. 2002). For this reason, DGGE is best suited for studying the composition of the dominant bacterial community. We were able to separate 20 to 24 different DGGE bands in our samples. Similar numbers have been found in natural seawater in other studies (Murray et al. 1998, Olsen et al. 2013). With our general bacteria-specific primer, the 16S DGGE bands represent bac-terial species, but some bands can originate from chloroplasts from eu karyotic algae, which also have 16S ribosomal DNA.
Bacterial community structure and environmental variables
According to the RDA analysis, the ammonium-loading rate was a significant constraint on bacterial community structure, but the concentration of the nutrients was not. Testing with individual environ-mental variables revealed that phytoplankton abun-dance, chl aand pH were significant constraints. All of these variables had a positive response to the ammonium-loading gradient, and chlorophyll and pH are closely linked to phytoplankton abundance. Photosynthesis in phytoplankton can induce a pH increase in seawater if not totally counteracted by respiration in phytoplankton and grazers (Falkowski & Raven 1997). The uptake of inorganic carbon during a bloom can be faster than the resupply by
diffusion, and the pH can increase to > 9 during blooms in eutrophic natural waters (Hansen 2002). Therefore, the pH increase we observed was not an experi mental artefact of our microcosms, but probably represents a maximum situation with very little mixing of the water column. Because the increase in pH is a direct consequence of increased per volume photosynthesis, it is difficult to distin-guish the pH effect from the effects of increased phytoplankton abundance in our analysis. Not many studies have investigated how the bacterial com -munity associated with phytoplankton responds to changes in the pH, but according to laboratory studies with phytoplankton and bacteria, there was a response in the bacterial community composition due to a photo synthesis-induced pH increase (Olsen 2005). Krause et al. (2012) concluded that a small reduction in pH due to ocean acidification resulted in an altered bacterial community, suggesting that some seawater bacteria are indeed sensitive to changes in pH. According to this, pH can have a direct influence on the community composition of bacteria.
The concentration of inorganic nutrients did not have a significant impact on the bacterial community structure (Fig. 5). Nitrogen limitation in the low-addi-tion treatments (L. Olsen et al. 2014) might have selected for bacteria that are good competitors for the nutrient, whereas in the high-addition treatments, the selection was stronger for other traits such as predator resistance (Bohannan & Lenski 2000, Horner-Devine et al. 2003). The ammonium was nearly depleted in all microcosms because it was immedi-ately taken up by the cells, so these effects might have been undetectable by our RDA analysis of en -vironmental variables, but were indirectly reflected in the significant effect of ammonium-loading rate. Fig. 7. (A) Non-metric multidimensional scaling (NMDS) ordinations based on the ranks of the Bray-Curtis dissimilarities between 16S DGGE fingerprints from the depth profile including the surface boundary layer (SBL) in the Comau Fjord and samples from 10 and 2 m depth at Huinay pier taken on Day 0 of the microcosm experiment. The figure shows axis 1 and 2 of
In addition to inorganic nutrients, heterotrophic bacteria depend on organic matter for growth, and can also exploit organic forms of the nutrients. Because fish release almost all their organic waste in particulate form, i.e. faeces, they contribute little to dissolved organic matter in the upper water column, although the particulate waste may eventually dis-solve from the sediments (Wang et al. 2012). Without an allochthonous source of organic matter, hetero -trophic bacteria depend on organic matter from phytoplankton and organisms at other trophic levels in the food web, i.e. directly or indirectly from the primary producers. Different bacteria have different preferences for organic substrates (Cottrell & Kirch-man 2000, Gómez-Consarnau et al. 2012), and phyto-plankton blooms can modify the bacterial community by the production of different types of organic sub-strates (Buchan et al. 2014, Taylor et al. 2014).
In our microcosm experiment, the micro-phyto-plankton community structure changed throughout the nutrient-addition gradient and was significantly constrained by the loading rate (L. Olsen et al. 2014). As revealed by the Mantel test, no significant corre-lation was found between bacterial community struc-ture on Day 16 and the phytoplankton community structure on Day 16 or Day 10. Different phyto -plankton species have different associated bacterial satellite communities (Schäfer et al. 2002, Sapp et al. 2007), but those were laboratory studies with single phytoplankton species in culture. In a mixed natural community with many phytoplankton species, as observed in our experiment, such species-specific effects may be difficult to detect.
We did not find that flagellate abundance had a significant impact on the bacterial community struc-ture. That the bacterial abundance was reduced to the initial level after an initial increase indicates that it became predator-controlled. The increase in bacte-rial abundance was similar in all treatments, includ-ing T1 with no nutrient addition, suggestinclud-ing that the initial increase could be due to a container effect of the microcosms. Lebaron et al. (1999) observed a similar response in bacterial abundance in nutrient-addition experiments. In seawater mesocosms, those authors observed a 10-fold increase in the number of heterotrophic protozoans followed by a decrease in bacterial numbers, i.e. predator−prey dynamics. Our counts of proflavine-stained flagellates included all autotrophic, mixotrophic and heterotrophic cells (L. Olsen et al. 2014). This may have obscured a possible abundance response in the bacterivorous fraction of the flagellates. Lebaron et al. (1999) concluded that the observed changes in bac terial community
struc-ture measured by DGGE fingerprinting was a com-bined effect of bottom-up effects on bacterial produc-tivity, coupled with top-down effects of predation. It is not unlikely that predation also had some impact in our experiment along with other unmeasured vari-ables, such as virus in fection (Töpper et al. 2013) and allelopathy (Long & Azam 2001).
Concluding remarks
The nutrient-loading rate had a significant effect on the bacterial community structure of the Comau Fjord, and the increase in phytoplankton abundance, and pH increase as a consequence, were the strongest forcing factors. However, the bacterial diversity was not significantly affected. According to rough calcula-tions in L. Olsen et al. (2014), the maximum theoretical ammonium loading from salmon aquaculture in the Comau Fjord, based on the number of fish-farm con-cessions, is approximately 1 µmol l−1d−1, i.e. the mid-dle value in our experimental gradient. The answer to our question whether nutrients from fish farms can change the bacterial community is yes, but since the diversity of the community was maintained, it appears to be a healthy response to increased primary produc-tion. In this study, we only investigated the response of the bacterial community. Other environmental im-pacts, such as increased sedimentation of organic matter and subsequent anoxia in the bottom sedi-ments, may be more appropriate for determining the limits for sustainability. Our experiment covered the time period of an algal bloom caused by an increased nutrientloading rate, i.e. shortterm effects of eutrophi -cation. Fish aquaculture is a long-term activity contin-uously releasing nutrients to the fjord. Therefore, long-term effects should be studied to account for e.g. changing environmental conditions due to seasons (Y. Olsen et al. 2014).
Acknowledgements. We thank Cristina Dorador, Adrian Levrel, Harriet de Ruiter, Ingvil Jensen, Pamela A. Labbe Ibanez, Mauricio Espinoza, Nelson Silva and all of our friends and colleagues at the Huinay Field Station for assis-tance and technical help. This experiment was undertaken as a part of the WAFOW project at the Norwegian University of Science and Technology (NTNU), Department of Biology, financed by the Norwegian Research Council (project 193661). L.M.O. was partly funded by the NRC project CIN-TERA (no. 216607) at NTNU.
LITERATURE CITED
sea-water nutrient analyses (revised). Tech Rep 215. De -partment of Oceanography, Oregon State University, Corvallis, OR
Azam F, Fenchel T, Field JG, Grey JS, Meyer-Reil LA, Thingstad F (1983) The ecological role of water-column microbes in the sea. Mar Ecol Prog Ser 10: 257−263 Bohannan BJM, Lenski RE (2000) Linking genetic change to
community evolution: insights from studies of bacteria
and bacteriophage. Ecol Lett 3: 362−377
Buchan A, LeCleir GR, Gulvik CA, González JM (2014) Master recyclers: features and functions of bacteria asso-ciated with phytoplankton blooms. Nat Rev Microbiol 12: 686−698
Campbell BJ, Kirchman DL (2013) Bacterial diversity, com-munity structure and potential growth rates along an estuarine salinity gradient. ISME J 7: 210−220
Cottrell MT, Kirchman DL (2000) Natural assemblages of
marine proteobacteria and members of the
Cytophaga-Flavobactercluster consuming low- and high-molecular-weight dissolved organic matter. Appl Environ Microbiol 66: 1692−1697
Elizondo-Patrone C, Yanniceli B, Olsen LM, Molina V, Her-nandez K (2015) Nitrifying microbial assemblages response to ammonium enrichment from salmon farming activities in a Chilean Fjord. Estuar Coast Shelf Sci 166: 131−142
Falkowski P, Raven JA (1997) Aquatic photosynthesis. Blackwell, Oxford
Falkowski PG, Fenchel T, Delong EF (2008) The microbial engines that drive Earth’s biogeochemical cycles. Sci-ence 320: 1034−1039
Ferreira JG, Andersen JH, Borja A, Bricker SB and others (2011) Overview of eutrophication indicators to assess en -vironmental status within the European Marine Strategy Framework Directive. Estuar Coast Shelf Sci 93: 117−131 Fisher MM, Klug JL, Lauster G, Newton M, Triplett EW (2000) Effects of resources and trophic interactions on freshwater bacterioplankton diversity. Microb Ecol 40: 125−138
Fromin N, Hamelin J, Tarnawski S, Roesti D and others (2002) Statistical analysis of denaturing gel electrophore-sis (DGGE) fingerprinting patterns. Environ Microbiol 4: 634−643
Fuhrman JA, Cram JA, Needham DM (2015) Marine micro-bial community dynamics and their ecological interpre-tation. Nat Rev Microbiol 13: 133−146
Ghiglione JF, Palacios C, Marty JC, Mével G and others (2008) Role of environmental factors for the vertical dis-tribution (0−1000 m) of marine bacterial communities in the NW Mediterranean Sea. Biogeosciences 5: 1751−1764 Gilbert JA, Neufeld JD (2014) Life in a world without
microbes. PLOS Biology 12: e1002020
Girvan MS, Campbell CD, Killham K, Prosser JI, Glover LA (2005) Bacterial diversity promotes community stability and functional resilience after perturbation. Environ Microbiol 7: 301−313
Gómez-Consarnau L, Lindh MV, Gasol JP, Pinhassi J (2012) Structuring of bacterioplankton communities by specific dissolved organic carbon compounds. Environ Microbiol 14: 2361−2378
Grasshoff K, Ehrhardt M, Kremling F (1983) Methods of seawater analysis, 2nd edn. Verlag Chemie, Weinheim Hammer Ø, Harper DAT, Ryan PD (2001) PAST: Paleonto-logical Statistics software package for education and
data analysis. Palaeontol Electron 4: 4. http:
//palaeo-electronica.org/2001_1/past/issue1_01.htm
Hansen PJ (2002) Effect of high pH on the growth and
sur-vival of marine phytoplankton: implications for species succession. Aquat Microb Ecol 28: 279−288
Hass L (1982) Improved epifluorescence microscopy for ob -serving planktonic micro-organisms. Ann Inst Oceanogr 58: 261−266
Holm-Hansen O, Riemann B (1978) Chlorophyll a determi-nation: improvements in methodology. Oikos 30: 438−447 Horner-Devine MC, Leibold MA, Smith VH, Bohannan BJM (2003) Bacterial diversity patterns along a gradient of primary productivity. Ecol Lett 6: 613−622
Iriarte JL, Gonzalez HE, Liu KK, Rivas C, Valenzuela C (2007) Spatial and temporal variability of chlorophyll and primary productivity in surface waters of southern Chile (41.5–43° S). Estuar Coast Shelf Sci 74: 471−480
Iriarte JL, Pantoja S, González HE, Silva G and others (2013) Assessing the micro phytoplankton response to nitrate in Comau Fjord (42°S) in Patagonia (Chile), using a micro-cosms approach. Environ Monit Assess 185: 5055−5070 Kennedy AC, Stubbs TL (2006) Soil microbial communities
as indicators of soil health. Ann Arid Zone 45: 287−308 Krause E, Wichels A, Gimenez L, Lunau M, Schilhabel MB,
Gerdts G (2012) Small changes in pH have direct effects
on marine bacterial community composition: a
micro-cosm approach. PLOS ONE 7: e47035
Langenheder S, Jürgens K (2001) Regulation of bacterial biomass and community structure by metazoan and pro-tozoan predation. Limnol Oceanogr 46: 121−134
Lebaron P, Servais P, Troussellier M, Courties C and others (1999) Changes in bacterial community structure in sea-water mesocosms differing in their nutrient status. Aquat Microb Ecol 19: 255−267
Legendre P, Legendre L (2012) Numerical ecology, 3rd English edn. Elsevier Science BV, Amsterdam
Long RA, Azam F (2001) Antagonistic interactions among marine pelagic bacteria. Appl Environ Microbiol 67: 4975−4983
Murray AE, Preston CM, Massana R, Taylor LT, Blakis A, Wu K, DeLong EF (1998) Seasonal and spatial variability of bacterial and archaeal assemblages in the coastal waters near Anvers Island, Antarctica. Appl Environ Microbiol 64: 2585−2595
Muyzer G, Ramsing NB (1995) Molecular methods to study the organization of microbial communities. Water Sci Technol 32: 1−9
Muyzer G, Smalla K (1998) Application of denaturing gra -dient gel electrophoresis (DGGE) and temperature gra-dient gel electrophoresis (TGGE) in microbial ecology. Antonie Leeuwenhoek 73: 127−141
Muyzer G, De Waal EC, Uitierlinden AG (1993) Profiling of complex microbial populations by denaturing gradient gel electrophoresis analysis of polymerase chain reac-tion-amplified genes coding for 16S rRNA. Appl Environ Microbiol 59: 695−700
Olsen LM (2005) Interactions between marine osmo- and phagotrophs in different physicochemical environments. PhD thesis, Norwegian University of Science and Tech-nology, Trondheim
Olsen LM, Ardelan MV, Hewes CD, Holm-Hansen O and others (2013) Microbial biogeography during austral summer 2007 in the surface waters around the South Shetland Islands, Antarctica. Aquat Microb Ecol 70: 131−140
Olsen Y, Olsen LM (2008) Environmental impact of aqua -culture on coastal planktonic ecosystems. In: Tsukamoto K, Kawamura T, Takeuchi T, Beard TD, Kaiser MJ (eds) Fisheries for global welfare and environment. Terrapub, Tokyo, p 181−196
Olsen Y, Agustí S, Andersen T, Duarte CM and others (2006) A comparative study of responses in planktonic food web structure and function in contrasting European coastal waters exposed to experimental nutrient addition. Limnol Oceanogr 51: 488−503
Olsen Y, Andersen T, Gismervik I, Vadstein O (2007) Proto-zoan and metaProto-zoan zooplankton-mediated carbon flows in nutrient-enriched coastal planktonic communities. Mar Ecol Prog Ser 331: 67−83
Olsen Y, Reinertsen H, Sommer U, Vadstein O (2014) Responses of biological and chemical components in North East Atlantic coastal water to experimental nitro-gen and phosphorus addition — a full scale ecosystem study and its relevance for management. Sci Total Environ 473-474: 262−274
Porter K, Feig Y (1980) The use of DAPI for identifying and counting aquatic microflora. Limnol Oceanogr 25: 943−948 R Development Core Team (2008) R: a language and en -vironment for statistical computing. R Foundation for Statistical Computing, Vienna
Redfield AC (1958) The biological control of chemical factors in the environment. Am Sci 46: 205−221
Sapp M, Schwaderer AS, Wiltshire KH, Hoppe HG, Gerdts G, Wichels A (2007) Species-specific bacterial communities in the phycosphere of microalgae? Microb Ecol 53: 683−699
Schäfer H, Bernard L, Courties C, Lebaron P and others (2001) Microbial community dynamics in Mediterranean nutrient-enriched seawater mesocosms: changes in the genetic diversity of bacterial populations. FEMS Micro-biol Ecol 34: 243−253
Schäfer H, Abbas B, Witte H, Muyzer G (2002) Genetic diversity of satellite bacteria present in cultures of mar-ine diatoms. FEMS Microbiol Ecol 42: 25−35
Stackebrandt E, Liesack W (1993) Nucleic acids and classifi-cation. In: Goodfellow M, O’Donnell AG (eds) Handbook of new bacterial systematics. Academic Press, London, p 151−194
Taylor JD, Cottingham SD, Billinge J, Cunliffe M (2014) Seasonal microbial community dynamics correlate with phytoplankton-derived polysaccharides in surface coastal waters. ISME J 8: 245−248
Töpper B, Thingstad TF, Sandaa RA (2013) Effects of differ-ences in organic supply on bacterial diversity subject to viral lysis. FEMS Microbiol Ecol 83: 202−213
Torsvik V, Øvreås L, Thingstad TF (2002) Prokaryotic di -versity— magnitude, dynamics, and controlling factors. Science 296: 1064−1066
Wang X, Olsen LM, Reitan KI, Olsen Y (2012) Discharge of nutrient wastes from salmon farms: environmental effects, and potential for integrated multi-trophic aqua-culture. Aquacult Environ Interact 2: 267−283
Yu Z, Yang J, Liu L, Zhang W, Amalfitano S (2015) Bacterio-plankton community shifts associated with epipelagic and mesopelagic waters in the Southern Ocean. Sci Rep 5: 12897
Editorial responsibility: Megan La Peyre, Baton Rouge, Louisiana, USA