Tuning the copper(II) coordination properties of cyclam by subtle chemical
modifications
iNathalie Camus
a, Nathalie Le Bris
a, Selbi Nuryyeva
b,c, Matthieu Chessé
b, David Esteban-Gómez
d,
Carlos Platas-Iglesias
d, Raphaël Tripier
a*and Mourad Elhabiri
b†a
Université de Bretagne Occidentale, UMR 6521 CNRS, SFR ScInBioS, UFR des Sciences et Techniques, 6 avenue Victor le Gorgeu, C.S. 93837, 29238 Brest Cedex 3, France
b Laboratoire de Chimie Bioorganique et Médicinale, UMR 7509 CNRS-Université de Strasbourg, ECPM, 25 Rue
Becquerel, 67087 Strasbourg Cedex, France
c New York University Abu Dhabi (NYUAD), PO Box 129188, Abu Dhabi, United Arab Emirates
d Universidade da Coruña, Centro de Investigacións Científicas Avanzadas (CICA) and Departamento de Química,
Facultade de Ciencias, 15071, A Coruña, Galicia, Spain
Dalton Transactions, volume 46, issue 34, pages 11479–11490, 14 September 2017
Received 01 March 2017, accepted 27 July 2017, first published 27 July 2017
How to cite:
Tuning the copper(II) coordination properties of cyclam by subtle chemical modifications. N. Camus, N. Le Bris, S. Nuryyeva, M. Chessé, D. Esteban-Gómez, C. Platas-Iglesias, R. Tripier and M. Elhabiri,
Dalt. Trans., 2017, 46, 11479–11490. DOI: 10.1039/C7DT00750G.
Abstract
The acid–base and copper(II) coordination properties of three previously described cyclam derivatives are reported. Potentiometry, mass spectrometry, UV-vis absorption spectroscopy, electrochemistry and theoretical calculations were combined to investigate the protonation and binding properties of Bn-cyclam-EtOH (L1), oxo-cyclam-EtOH (L2) and oxo-Bn-cyclam-EtOH (L3). These three cyclams are C -functionalized by a hydroxyethyl pendant arm and display either one N-benzyl group and/or an amide replacing one macrocyclic secondary amine. The N-benzylic substitution has a significant effect of lowering the basicity of the corresponding protonation sites, while the presence of the amide function lowers the first protonation constants of the ligands. Regardless of the system considered, ESI mass spectrometry showed that only monocupric chelates are formed. Compared to the literature data, the stability constants measured by potentiometry (pCu L1 = 14.67; pCu L2 = 16.95; pCu L3 = 15.28) showed that: (i) the C-appended group has a negligible influence on Cu2+ complexation, (ii) N-benzylation decreases the cupric complex stability, and (iii) the “oxo” function significantly increases the stability of the Cu2+
complex. Furthermore, UV-vis absorption versus pH measurements are in excellent agreement with the potentiometric titrations and show an equal involvement of the four nitrogen atoms in L1 and the strong binding properties of L2 and L3 related to the deprotonation of the carboxamide. The electrochemistry parameters determined by cyclic voltammetry showed the predominance of the [CuL1]2+, [CuL2-H]+and [CuL3-H]+ species but also the irreversibility of the three Cu2+/Cu+ systems. Finally, density functional theory (DFT) and multiconfigurational CASSCF/NEVPT2 calculations confirmed that the protonation of the cupric complexes occurs at the oxygen atom of the amide group of the “oxo” ligands, which is in agreement with the experimental data.
Keywords: coordination compounds; DFT calculations; copper complexes; cyclam derivatives
Introduction
The extraordinary binding properties towards transition metal ions of azacycloalkane-based ligands and especially tetraazacycloalkanes, such as cyclam (1,4,8,11-tetraazacyclotetradecane), are now well recognized.1 The high affinity of this aza backbone for copper(II), described by the HSAB principle,2 is increasingly being used in numerous applications including the detection of cations and anions,3 catalysis4 and medicine.5 For such uses, the azamacrocycle scaffold is generally modified or functionalized to fine-tune properties such as complexation and dissociation kinetics, thermodynamic stability, and the relative stability of the Cu2+ and Cu+ oxidation states, among others. Hence, the effect of N -functionalization has been intensively studied and evaluated for a large variety of applications.6 However, the replacement of one or more amine groups of cyclam by an amide group has not been well investigated. This kind of chemical modification gives the so-called “oxo-” or “polyoxo-cyclam” ligands, which show features of both oligopeptides and saturated cyclic amines. They possess unusual acid–base properties due to the easy deprotonation of the amide proton(s). Protonation of these oxo-Cu2+ complexes may occur on the amide group either at the negatively charged nitrogen atom, with the metal–nitrogen bond being converted to a metal–oxygen bond,7–10 or at the carbonyl oxygen without breaking the metal–nitrogen bond.11 By taking advantage of the interesting properties of copper(II) complexes, the amide proton(s) on polyoxo-cyclam ligands can be replaced making them especially attractive as functional catalysts, in biological models of metalloproteins, systems for oxygen uptake and radiopharmaceuticals.
The C-functionalization of the macrocyclic skeleton is another interesting subtle modification that confers the macrocycle with an additional functionality for further derivatisation without alteration to its coordination properties. C-functionalization is usually accomplished at the β-N position of the cyclam backbone, so the additional arm is not expected to be involved in the coordination to the metal ion while allowing the metal complex to be anchored on a biomolecule, solid support, organic moiety, etc. However, there are only a few reports on physico-chemical approaches that investigate the real effect of the latter modification on the coordination properties, particularly when the appended group presents a heteroatom able to interact either with the macrocycle and/or the coordinated metal ion.12
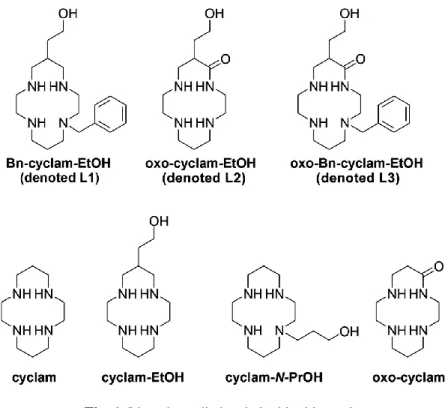
We recently described the synthesis of cyclams C-functionalized on one carbon atom in the β-N position of the macrocycle, and also reported their assessment as 64Cu chelators in new radiopharmaceuticals.13 Among the various C-functionalized cyclams that have been synthesized, those bearing a hydroxyethyl function have been thoroughly investigated. Interestingly, the so-called cyclam-EtOH (Fig. 1) displayed acid–base and copper(II) coordination properties that are similar to the parent cyclam ligand. On the other hand, the synthetic routes that have been developed to obtain C-functionalized cyclams led to various key intermediates displaying a cyclic amide function that replaced an amine one and/or a regio-specific insertion of an N-benzyl function (oxo-cyclam-EtOH and oxo-Bn-cyclam-EtOH, Fig. 1). These synthetic intermediates thus deserve thorough physico-chemical investigations to analyse their properties for which, to the best of our knowledge, no information is available in the literature.
potentiometric titrations, electrospray mass spectrometry, UV-vis absorption spectrophotometry, electrochemistry and theoretical calculations. Their properties will be discussed with respect to the simple cyclam, cyclam-EtOH, cyclam-N-PrOH and other oxo-cyclam derivatives.
Fig. 1. Ligands studied and cited in this work.
Results and discussion
Ligand synthesis
The three ligands investigated herein were synthesized by following previously reported procedures involving bisaminal chemistry.13a,c This methodology is based on an organic template effect obtained by the condensation of a linear tetraamine with a dicarbonyl derivative (glyoxal or butanedione). This is followed by the cyclization of the resulting bisaminal with an α,β-unsaturated lactone (α-methylene-γ-butyrolactone), affording the double advantage (following various workups) of simultaneous amidation and selective
mono-N-benzylation of the macrocycle.
Protonation properties
The acid–base properties of ligands L1–L3 (Fig. 1) have been investigated by means of potentiometric (L1– L3) and 1H NMRversus pH titration (L1 and L3) measurements. The experimental titration curves are available in the ESI (Fig. S1–S3, S23 and S24i), whereas the protonation constants are gathered in Table 1. For the cyclam-based system L1, four protonation constants can be anticipated from the four ionizable amino sites. For the oxo-cyclams L2 and L3, only three protonation constants were characterized. For L1, only the two highest protonation constants were accurately determined, similar to other related cyclam derivatives (Table S2, ESIi). A good agreement was obtained between the values determined in H2O by potentiometry
and those evaluated by 1H NMR in D2O, which were corrected for isotope effects. 14
The other protonation constants were estimated to be lower than 2 (logK013 = 2.43
15
/2.2722 and logK014 = 1.97 15
mainly due to the electrostatic repulsions between the positive charges resulting from the successive protonations of the secondary (or tertiary) amines. For the oxo-cyclams, the three pKa values that were
accurately calculated are in excellent agreement with the literature data available for closely related systems (Table S2, ESIi). For L3, the value of the first protonation constant determined by 1H NMR (i.e. logK011 =
10.8 recalculated assuming an isotope correction step) is in reasonably good agreement with that determined in H2O by potentiometry.
cyclam unit. The logarithmic value of K011 for L1 (logK011 = 11.77(4)) is indeed comparable to the measured
one in closely related systems such as cyclam (logK011 = 11.29, 16
measured for the closely related cyclam-EtOH (logK011 = 10.14).
The relative magnitude of the second protonation constant is usually considered as a measure of the difficulty to protonate close to a positively charged centre. This second protonation constant is indeed lower than the first one because of the electrostatic interaction between the two positive charges borne by the ammonium cations (ΔlogKH = 2.77 for L1, ΔlogKH∼ 1.76 for cyclam-N-PrOH and ΔlogKH∼ 1 for cyclam
and cyclam-EtOH). Besides, it is worth mentioning that the N-benzylic substitution has also a significant effect of lowering the basicity of the corresponding protonation site. This feature was observed, for instance, on simple models such as 5-benzyldipropylenetriamine for which a decrease of more than two orders of magnitude was observed after the benzylic N-alkylation of the central secondary amine (Table S2, ESIi).20
amino function. The measured logK011values (10.31(2) for L2 and 10.38(2) for L3) are in excellent
agreement with the data obtained for the related oxo-cyclams lacking hydroxyethyl pendant arms. This can be explained by structural and electronic effects. Resonance effects centred on the amide unit result in a residual positive charge on the C O carbon that contributes to a lower K011 value as a result of an
electrostatic effect. Following this effect, the amide unit (C sp2) has also a propensity to impose coplanarity on the N4 binding system. With respect to the cyclam analogues, oxo-cyclam ligands display K012 values that
are three orders of magnitude lower. These correspond to a much stronger electrostatic repulsions between adjacent ammonium cations that are induced by the presence of the carbonyl unit. It is noteworthy that the hydroxyethyl side arm has no effect on the protonation properties of L1–L3ligands. This is in contrast to the cyclam substituted on one nitrogen atom by a 3-hydroxypropyl group, which induces a decrease in both the ligand basicity and the stability of the metal complexes due to intramolecular hydrogen bonds between the hydroxyl group and the macrocyclic amines. The shorter hydroxyethyl pendant arm is unlikely to behave in a similar fashion. As a consequence, ligand L2 displays comparable protonation constants to the analogous oxo-cyclam7 lacking a hydroxyethyl substituent (logK011 = 10.31(2) versus 10.22; logK012 = 6.84(3) versus
7.02; logK013 = 2.62(6) versus 3.20). As already discussed for L1, N-alkylation with a benzylic moiety for
L3 markedly alters the protonation properties of the oxo-cyclam scaffold. The second protonation constant is further decreased by more than two orders of magnitude with respect to L2 (logK012 = 4.80(4) for L3 versus
6.84(3) for L2). The third protonation constants of L2 and L3 are comparable to the values of oxo-cyclam derivatives reported in the literature (logK013∼ 2.9–3.4).
7,10
Coordination properties with Cu2+
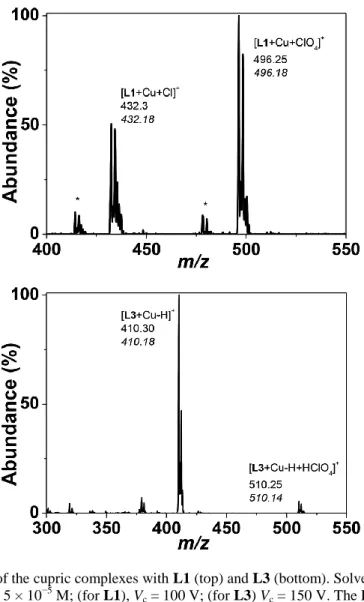
Mass spectrometry investigation: deprotonation of the amide unit. Prior to the physico-chemical investigations of the cupric complexes with ligands L1–L3, an ESI-MS study was carried out to elucidate the stoichiometry and the nature of the complexes formed in solution. Fig. 2 displays the ESI-MS spectra of the cupric complexes characterized with L1 and L3 (Fig. S4–S6, ESIi, depict the ESI-MS spectra of ligands L1– L3 and the cupric complexes with L2). Table 2 summarizes the results calculated from the ESI-MS spectra. Regardless of which system was considered, positively monocharged species were observed. For the free ligands, ionization occurs mainly through protonation. It is noteworthy that fragmentation occurs only for L1 even under mild conditions (low skimmer voltage) and corresponds either to the loss of the benzyl substituent or to dehydration of the hydroxyethyl pendant arm. For the oxo-containing ligands L2 and L3, no such fragmentations could be observed. With respect to the metal complexes, only monocupric chelates were characterized. For the cupric complexes with L1, ionization takes place primarily through the addition of counter-anions such as chloride and perchlorate arising out of the ligand or the cupric salt, respectively. It is noteworthy that fragments resulting from the loss of a water molecule at the hydroxyethyl substituent are still observed for the cupric complexes with L1. This suggests the absence of interactions between this substituent and the cyclam core, as has been shown for the protonated species (vide supra). For L2 and L3, ionization of the cupric complexes occurs mainly through deprotonation of the NH amide function. This was already suggested for the oxo-cyclam derivatives7–10 but never evidenced by mass spectrometric methods. Similar to L1, the addition of perchlorate counter-anions (resulting from the copper salt used) is also prone to form positively monocharged cupric species. These two cupric species with L2 (or L3) likely correspond to the species in equilibrium.
However, it was found that L1(pCu = 14.67) is stabilized with respect to cyclam-N-PrOH (pCu = 12.70) as a consequence of the absence of interaction with the hydroxyethyl pendant arm. Indeed, it has been demonstrated for cyclam-N-PrOH that intramolecular hydrogen bonding of the propanol chain with the cyclam scaffold preorganizes the ligand against complexation and thereby destabilises the cupric complexes.18 To a certain extent, the cupric complexes with L1 are destabilised with respect to cyclam-EtOH (pCu = 18.04) or cyclam (pCu = 20.04) as a consequence of N-alkylation that tends to decrease the overall basicity of the ligand (for L1: logK011 + logK012 = 20.77 and for cyclam-N-PrOH: logK011 + logK012 =
20.24 versus for cyclam-EtOH: logK011 + logK012 = 21.3 and for cyclam: logK011 + logK012 = 21.89 15
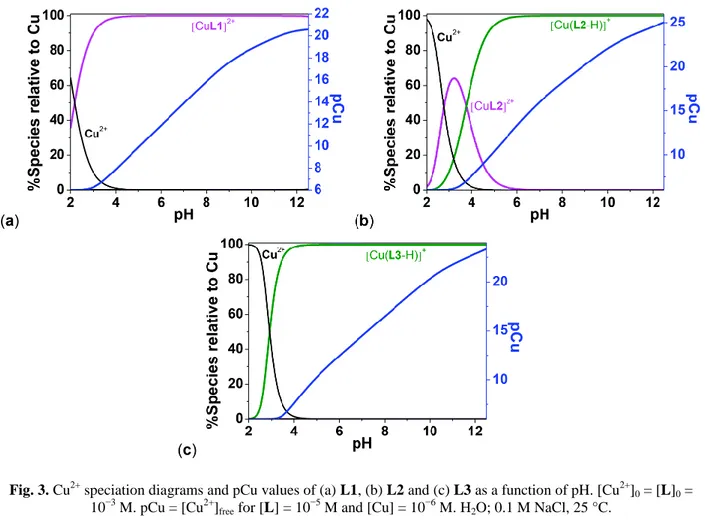
). Steric hindrance brought by the N-benzylation may also partially explain this destabilisation. The speciation diagram measured for the Cu2+ complex with L1 (Fig. 3) shows that the monocupric chelate predominates in a broad pH range from 3 to 12, the complex dissociating at acidic pH values (pH < 3). In addition to the expected monocupric chelate [CuL2]2+, the potentiometric titration data of the monooxo-tetraamine system L2 undoubtedly showed the formation of the monodeprotonated complex [Cu(L2-H)]+ with an associated acidic pKa value of 3.87(6). The Cu
2+
coordination properties of L2 (pCu = 16.72) are comparable to those of the unsubstituted monooxo-cyclam (pCu = 17.62, Table 3) and demonstrate a negligible influence of the hydroxyethyl substitution. The measurement of the pCu values at pH 7.4 for L2(pCu = 16.95) also suggested a stabilization of the cupric complex with respect to L1 (pCu = 14.67) and only a moderate destabilisation with respect to cyclam-EtOH (pCu = 18.04), thus indicating that on subtle modification of the cyclam to monooxo-cyclam scaffolds, the Cu2+ complexation properties are preserved while allowing the decrease of the global charge of the cupric complex. Upon deprotonation of the amide function of [CuL2]2+, a possible resonance stabilisation of the resulting carboximidate anions likely imposes coplanarity on the N4 donor set. This process is undoubtedly triggered by copper(II) complexation and deprotonation of the cupric complex. The Cu2+ speciation diagram of L2 also shows that the Cu2+monochelates predominate in a broad pH range (3 < pH < 12). Similar to L1versus cyclam-EtOH, the decrease of basicity due toN -benzylation for L3 (logK011 + logK012 = 15.18) – with respect to L2 (logK011 + logK012 = 17.15) – is a
plausible explanation of the destabilisation of the Cu2+ complexes with L3 (pCu = 15.28). As a matter of fact, only the deprotonated cupric complex [Cu(L3-H)]+ was accurately characterized (logK11−1 = 9.91(4)).
Again, comparison of the Cu2+ coordination properties of L3 withL1 or cyclam-N-PrOH (Table 3) demonstrates that the incorporation of an oxo function within the cyclam core has a tendency to increase the stability of the corresponding cupric complexes (Fig. S25–S27, ESIi).
Fig. 2. ESI-MS spectra of the cupric complexes with L1 (top) and L3 (bottom). Solvent: H2O; positive mode.
(a) [Cu2+]0 = [L1]0 = [L3]0 = 5 × 10⁻⁵ M; (for L1), Vc = 100 V; (for L3) Vc = 150 V. The ESI-MS spectra were limited
to the areas of interest. No peaks of interest were detected in the excluded m/z regions.
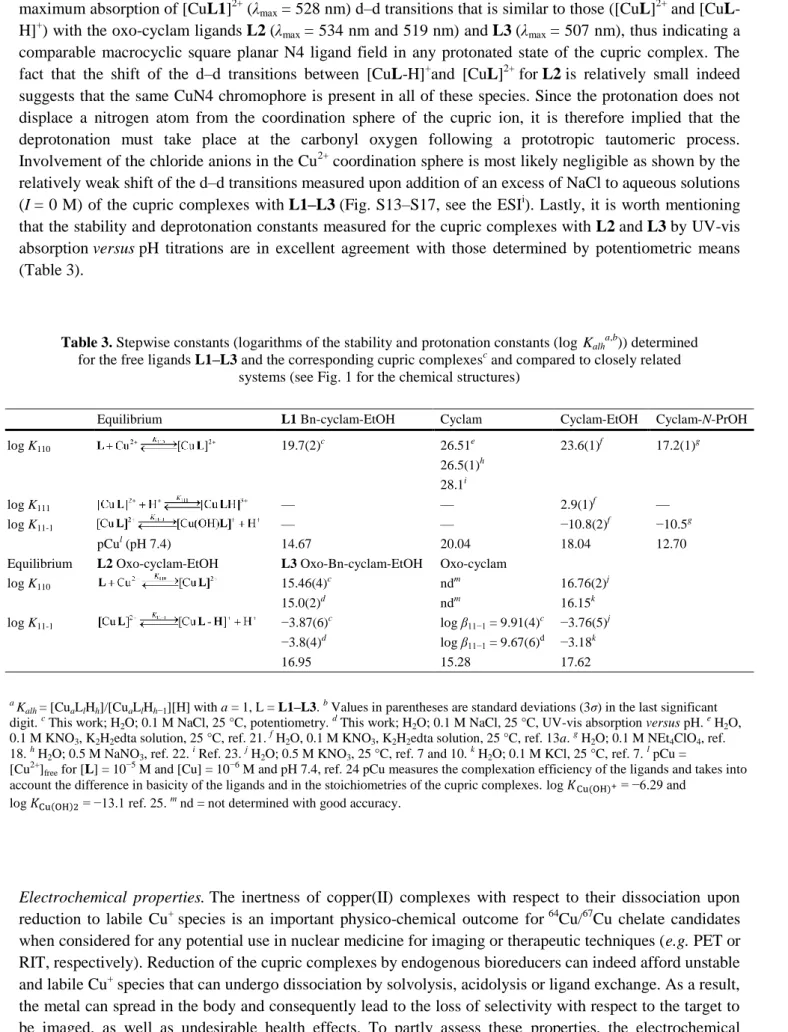
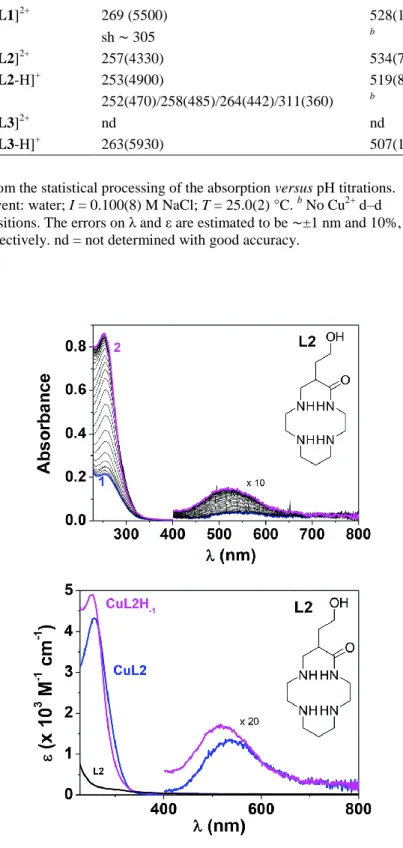
UV-vis absorption versus pH measurements. In addition to the potentiometric investigations described above, a UV-vis absorption spectrophotometric characterisation of the monocupric complexes as a function of pH has also been performed. The cupric complexes with L1–L3 (i.e. prepared by mixing equimolar amounts of both the ligand and Cu2+ perchlorate) all displayed interesting spectroscopic signatures such as an intense N → Cu2+
charge transfer (LMCT)26 absorption in the UV region and weaker Cu2+ d–d transitions in the visible spectral window (Table 4). For L1, which is lacking an oxo unit in the cyclam skeleton, no spectral variation was observed in agreement with the high stability of the L1 cupric complex (Table 3) and the absence of (de)protonation reactions on a broad pH range (Fig. S10, see the ESIi). The spectral characteristics of the Cu2+ d–d transitions (λmax = 528 nm) with ligand L1 suggested a distorted square planar
N4 geometry in agreement with equal involvement of the four nitrogen atoms to Cu2+ binding.27 The cupric complexes with the oxo-containing cyclam ligands L2 andL3 stand in an interesting contrast since a large spectral variation can be observed under acidic pH (Fig. 4 and Fig. S11, see the ESIi for L2 and Fig. S12, see the ESIi for L3), which is in agreement with the deprotonation of the carboxamide unit shown by ESI-MS or potentiometric results (vide supra).
Firm binding to the cupric centre and concomitant deprotonation of the carboxamide (i.e. leading to carboximidate anion) are characterized by a large hyperchromic shift of the N → Cu2+
ligand L1 (Table 4) suggesting a similar N4 coordination arrangement. This was further evidenced by the suggests that the same CuN4 chromophore is present in all of these species. Since the protonation does not displace a nitrogen atom from the coordination sphere of the cupric ion, it is therefore implied that the deprotonation must take place at the carbonyl oxygen following a prototropic tautomeric process. Involvement of the chloride anions in the Cu2+ coordination sphere is most likely negligible as shown by the relatively weak shift of the d–d transitions measured upon addition of an excess of NaCl to aqueous solutions (I = 0 M) of the cupric complexes with L1–L3 (Fig. S13–S17, see the ESIi). Lastly, it is worth mentioning that the stability and deprotonation constants measured for the cupric complexes with L2 and L3 by UV-vis absorption versus pH titrations are in excellent agreement with those determined by potentiometric means (Table 3).
Table 3. Stepwise constants (logarithms of the stability and protonation constants (logKalh a,b
)) determined for the free ligands L1–L3 and the corresponding cupric complexesc and compared to closely related
systems (see Fig. 1 for the chemical structures)
Equilibrium L1 Bn-cyclam-EtOH Cyclam Cyclam-EtOH Cyclam-N-PrOH
log K110 19.7(2)c 26.51e 23.6(1)f 17.2(1)g
Equilibrium L2 Oxo-cyclam-EtOH L3 Oxo-Bn-cyclam-EtOH Oxo-cyclam
log K110 15.46(4)c ndm 16.76(2)j account the difference in basicity of the ligands and in the stoichiometries of the cupric complexes. log 𝐾Cu(OH)+= −6.29 and
log 𝐾Cu(OH)2 = −13.1 ref. 25. m nd = not determined with good accuracy.
CV voltamperograms were recorded in water at pH 7.4 (HEPES 0.05 M + 0.095 M NaClO4) as an electrolyte
support at 25 °C with a glassy carbon working electrode. Fig. S18–S20 (see the ESIi) display the CV graphs measured for millimolar solutions of CuL (L = L1–L3).
Under these experimental conditions, the cupric complexes predominate under doubly positively charged species for L1([CuL1]2+) and positively monocharged species for either L2 or L3 ([CuL2-H]+ and [CuL3 -H]+, Fig. 3). For the sake of clarity, the CV of a millimolar solution of Cu(ClO4)2 has been recorded as well.
For [CuL1]2+ at pH 7.4, an irreversible reduction wave at Epc = −0.88 V versus Ag/AgCl/(3 M KCl) can be
observed without clear support of re-oxidation of the cuprous complex. Instead, an oxidation peak characteristic of Cu0 to Cu2+ close to +0.2 V versus Ag/AgCl/(3 M KCl) is observed. This so-called anodic stripping or redissolution peak (caused by the redissolution of metallic copper) is a clear signature of Cu0 formation due to the dismutation of dissociated Cu+ ions. This suggests that the electrogenerated Cu+ complex derived from ligand L1 is unstable and dissociates during the timescale of the electrochemical experiment.28 Moreover, no oxidation of the cupric complex to Cu3+ can be observed. For [CuL2-H]+, the electrochemical measurements also indicated an irreversible cathodic signal at Epc = −0.50 V versus
Ag/AgCl/(3 M KCl) and an irreversible oxidation peak at Epa = +0.34 V versus Ag/AgCl/(3 M KCl).
Cathodic and anodic signals related to the redissolution and redox processes of metallic copper can be also detected. Similar to [CuL1]2+, the [CuL2-H]+ species displays a comparable CV profile with an irreversible reduction peak at −0.87 V versus Ag/AgCl/(3 M KCl). The reduction process observed for the Cu2+ complex with L1 or L3 (Epc = −0.66 V/NHE) is well below the estimated potential threshold (−0.40 V/NHE) for
typical bioreductants, which suggests that complex dissociation upon Cu2+ reduction in biological media is unlikely. However, the irreversibility of this electrochemical process, arising from the stereochemical constraints induced by the chelating unit for Cu+ species, is a limitation that has to be taken into account for further development.
Fig. 3. Cu2+ speciation diagrams and pCu values of (a) L1, (b) L2 and (c) L3 as a function of pH. [Cu2+]0 = [L]0 =
Table 4. UV-vis absorption spectrophotometric parameters of the cupric complexes formed with ligands L1–L3a
λmax (ελmax)/nm (M−1 cm−1)
Species N → Cu2+ LMCT Cu2+ d–d
L1 251(340)/257(315)/264(240) b
sh ∼ 320
[CuL1]2+ 269 (5500) 528(150)
L2 sh ∼ 305 b
[CuL2]2+ 257(4330) 534(70)
[CuL2-H]+ 253(4900) 519(85)
L3 252(470)/258(485)/264(442)/311(360) b
[CuL3]2+ nd nd
[CuL3-H]+ 263(5930) 507(130)
a From the statistical processing of the absorption versus pH titrations.
Solvent: water; I = 0.100(8) M NaCl; T = 25.0(2) °C. b No Cu2+ d–d transitions. The errors on λ and ε are estimated to be ∼±1 nm and 10%, respectively. nd = not determined with good accuracy.
Fig. 4. (Top) UV-vis absorption spectrophotometric versus pH titration of the Cu2+ complex with ligand L2. (Bottom) Electronic absorption spectra of L2 and its cupric complexes. Solvent: water; I = 0.100(8) M NaCl;
T = 25.0(2) °C; [L2]0 = [Cu2+]0 = 1.87 × 10⁻⁴ M; (1) pH = 2.31; (2) pH = 6.55.
Theoretical calculations. Attempts to obtain single crystals suitable for X-ray diffraction measurements of the cupric complexes with the oxo-cyclam ligands L2 and L3 were unfortunately unsuccessful. Thus, the structures of the [CuL2]2+ and [CuL2-H]+ complexes were investigated using density functional theory (DFT) calculations. The X-ray structures of the Cu2+complex with the parent oxo-cyclam ligand show that the ligand adopts a trans-III conformation.29 The ligand provides a square-planar coordination to the Cu2+ ion both in its protonated and deprotonated forms, with two additional oxygen donor atoms of water molecules or perchlorate anions providing weak axial coordination (Cu–O distances in the range 2.34–2.84 Å).30 Thus, we performed geometry optimizations of the [Cu(L2-H)(H2O)n]
+
and [Cu(L2)(H2O)n]
2+
systems (n = 0–2) at the TPSSh/TZVP level, which showed the calculated structures to be in good agreement with the reference crystallographic data.31,32 Geometry optimizations of the [Cu(L2-H)(H2O)2]
+
and [Cu(L2)(H2O)2] 2+
systems resulted in the expulsion of one of the water molecules from the metal coordination environment, while the water molecule in [Cu(L2-H)(H2O)] involving the amide nitrogen atom that is lengthened upon protonation of the amide oxygen atom by ca. 0.05 Å. The calculated bond distances of the metal coordination environments are in good agreement with those reported for the parent complexes of oxo-cyclam.30
Table 5. Electrochemical parameters measured for the Cu2+ complexes with L1–L3 in water at pH 7.4.a
Reduction peak Oxidation peak
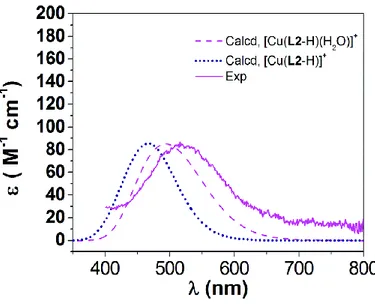
The structure of Cu2+ complexes of L2 in solution was further assessed by comparing the experimental d–d absorption bands with the calculated ones for the model systems shown in Fig. 5. This was achieved by using multireference CASSCF/NEVPT2 calculations (see Computational details below), which showed good results for the prediction of d–d transitions of first-row transition metal complexes.33 Conversely, time-dependent DFT was found to perform poorly.34 The active space consisted of 9 electrons in the five Cu-based 3d orbitals (CAS(9,5)).
Our calculations performed on [Cu(L2-H)]+ show a simulated absorption spectrum with a maximum at 465 nm, which represents an important deviation from the experimental value (519 nm, Table 4). The absorption profile calculated for [Cu(L2-H)(H2O)]
+
shows a maximum at 495 nm, which is in reasonably good agreement with the experimental value (Fig. 6). The absorption spectrum calculated for the protonated complex [Cu(L2)(H2O)]
2+
presents a maximum at the same wavelength, while its intensity is slightly reduced and the absorption profile experiences a slight red shift (Fig. S21, see the ESIi). These results are qualitatively in good agreement with the experimental data and therefore confirm that complex protonation occurs at the oxygen atom of the amide group of the ligand. The good agreement between the experimental spectra and those calculated for the [Cu(L2-H)(H2O)]
+
and [Cu(L2)(H2O)] 2+
molecule is weakly bound to the metal ion in aqueous solution, providing a square pyramidal coordination environment in agreement with the absence of interactions with chloride anions (vide supra, Fig. S13–S17, see the ESIi). The broad envelope of the d–d absorption bands calculated for both [Cu(L2-H)(H2O)]
+
and [Cu(L2)(H2O)]
2+
is the result of the contribution of four excitations with comparable oscillator strengths in the range of 460–546 nm for [Cu(L2-H)(H2O)]+ and 472–563 nm for [Cu(L2)(H2O)]2+ (Table S1 and Fig.
S22, see the ESIi).
Fig. 5. Structures of (a) [CuL2(H2O)]2+, (b) [CuL2-H(H2O)]+, (c) [CuL2]2+, and (d) [CuL2-H]+ obtained with
DFT calculations (TPSSh/TZVP). Bond distances of the metal coordination environments are given in Å.
Conclusions
physico-chemical parameters of the modified cyclam-based chelators. The N-benzyl pendant unit has a major influence by decreasing the basicity of the corresponding protonation sites, while the presence of an “oxo”-part lowers the first protonation constant. ESI-MS measurements provided evidence for the exclusive formation of 1 : 1 cupric chelates. Positively monocharged species were systematically characterized. The stability constants measured by pH-metric means then showed that the C-appended group has a negligible influence, while N-benzylation destabilises the corresponding cupric complexes. By contrast, the “oxo” function significantly increases the stability of the Cu2+ complexes. UV-vis absorption versus pH measurements demonstrated the comparable involvement of the four nitrogen atoms in L1. Furthermore, the high binding constants measured for the copper(II) species with L2 and L3 were clearly linked to the deprotonation of the carboxamide unit. Cyclic voltammetry revealed the main presence of the [CuL1]2+, [CuL2-H]+ and [CuL3-H]+ species and also the irreversibility of these three systems. Last but not the least, theoretical calculations confirmed that the (de)protonation occurs at the oxygen atom of the amide group for the “oxo” ligands.
Fig. 6. Visible absorption spectrum of the Cu2+ complex of L2 recorded at pH = 6.55 (solid pink line) and absorption profiles calculated using NEVPT2 calculations based on the CAS(9,5) wave function
(dotted blue and dashed pink lines).
C-Functionalized cyclams and especially “oxo”-C-functionalized cyclams appear to be very attractive ligands for copper(II) complexation, the additional C-appended group presenting no deleterious effect. For biomedical applications (e.g. PET imaging), this supplementary function can then be used for bioconjugation with an adequate vector. On the other hand, N-alkylation has the detrimental effect of altering the physico-chemical properties of the Cu2+ chelates and has to be substituted by a chelating function. The latter must also have the ability to stabilise the chelates independent of their oxidation states, an important outcome in 64Cu-PET imaging.
Experimental section
Starting materials and solvents
and O2-free argon (Sigma Oxiclear cartridge) before use. All stock solutions were prepared by weighing
solid products on an AG 245 Mettler Toledo analytical balance (precision 0.01 mg). The ionic strength was maintained at 0.100(8) M (ESIi) with sodium chloride (NaCl, Carlo-Erba-SDS Phar. Eur. 99–100.5%), and all measurements were carried out at 25.0(2) °C. The metal stock solutions (∼5–6 × 10⁻² M) were freshly prepared by the dissolution of appropriate amounts of the corresponding solid perchlorate salts in water saturated with argon. Copper(II) perchlorate (Cu(ClO4)2·6H2O, Fluka, purum p.a., 99.3%) is a commercial
product, which was used without further purification. The metal contents of the solutions were determined according to the classical colorimetric titrations.35
Caution! Perchlorate salts combined with organic ligands are potentially explosive and should be handled in small quantities and with adequate precautions.36
Potentiometric titrations
The potentiometric titrations of ligands L1 (1.34 × 10⁻³ M), L2 (1.36 × 10⁻³ M), and L3 (1.36 × 10⁻³ M) and their cupric complexes (1.1 ≤ [M]tot/[L]tot < 1.24) were performed using an automatic titrator system 794
Basic Titrino (Metrohm) with a combined glass electrode (Metrohm 6.0234.500, Long Life) filled with 0.1 M NaCl in water and connected to a microcomputer (tiamo light 1.2 program for the acquisition of the potentiometric data). The combined glass electrode was calibrated as a hydrogen concentration probe by titrating known amounts of hydrochloric acid (∼10−1 M from HCl, Sigma-Aldrich, puriss p.a., >37%) with CO2-free sodium hydroxide solution (∼10−1 M from NaOH, BDH, AnalaR, 98%).37 The HCl and NaOH
solutions were freshly prepared just before use and titrated with sodium tetraborate decahydrate (B4Na2O7·10H2O, Fluka, puriss, p.a., >99.5%) and potassium hydrogen phthalate (C8H5KO3, Fluka, puriss,
p.a., >99.5%), respectively, using methyl orange (RAL) and phenolphthalein (Prolabo, purum) as the indicators. The cell was thermostated at 25.0 ± 0.2 °C by the flow of a Lauda E200 thermostat. A stream of argon, pre-saturated with water vapor, was passed over the surface of the solution. The Glee program37 was applied for the glass electrode calibration (standard electrode potential E0/mV and slope of the electrode/mV
pH−1) and to check carbonate levels of the NaOH solutions used (<5%). The potentiometric data of L1– L3 and their cupric complexes (about 300 points collected over the pH range 2.5–11.5) were refined with the Hyperquad 200038 program which uses non-linear least-squares methods.39 Potentiometric data points were weighted by a formula allowing greater pH errors in the region of an end-point than elsewhere. The three potentiometric titrations were treated as single sets, for each system. The quality of fit was judged by the values of the sample standard deviation, S, and the goodness of fit, χ2, (Pearson's test). At σE = 0.1 mV
(0.023 σpH) and σV = 0.005 mL, the values of S in different sets of titrations were between 0.6 and 1.2,
and χ2 was below 99. The scatter of residuals versus pH was reasonably random, without any significant systematic trends, thus indicating a good fit of the experimental data. The successive protonation constants were calculated from the cumulative constants determined using the program. The uncertainties in the log
K values correspond to the added standard deviations in the cumulative constants. The distribution curves of the protonated species of L1–L3 and their cupric complexes as a function of pH were calculated using the Hyss program.40
Spectrophotometric titrations versus pH
25.0(2) °C (Lauda E200). The free hydrogen ion concentration was measured with a combined glass electrode (Metrohm 6.0234.500, Long Life) and an automatic titrator system 794 Basic Titrino (Metrohm). The Ag/AgCl reference glass electrode was filled with NaCl (0.1 M) (NaCl, Carlo-Erba-SDS Phar. Eur. 99– 100.5%) and was calibrated as a hydrogen concentration probe as described above. The initial pH was adjusted to ∼2–3 with HCl (Sigma-Aldrich, puriss p.a., >37%), and the titrations of the cupric complexes were then carried out by the addition of known volumes of NaOH solutions (BDH, AnalaR) with an Eppendorf microburette. Special care was taken to ensure that complete equilibration was attained. Absorption spectraversus pH were recorded using a Varian CARY 50 spectrophotometer fitted with Hellma optical fibers (Hellma, 041.002-UV) and an immersion probe made of quartz SUPRASIL (Hellma, 661.500-QX). The temperature was maintained at 25.0(2) °C with the help of a Lauda E200 thermostat.
1
H NMR versus pH titrations
To confirm the pKa values of L1 and L3 ligands, the 1
H NMR spectra of 20 mM samples of L1 and L3 in D2O (Merck Uvasol) containing 0.1 M NaCl (Carlo-Erba-SDS Phar. Eur. 99–100.5%) were recorded at 298
K, on a Bruker 500 spectrometer operating at 500 MHz for 1H. 3-(Trimethylsilyl)propionic-2,2,3,3-d4 acid
sodium (TSP, Sigma-Aldrich, 98 atom% D) was used as an internal1H standard. The combined glass electrode (Metrohm 6.0234.500, Long Life) filled with 0.1 M NaCl in water was calibrated as a hydrogen concentration probe by using a set of commercial Merck buffered solutions (pH 1.68, 4.00, 6.86, 7.41 and 9.18). The pH* values (pH in D2O solutions measured with the combined glass electrode calibrated with H2O
buffers) of the samples were adjusted using small volumes of concentrated DCl (Sigma-Aldrich, 35 wt% in D2O, >99 atom % D) or NaOD (Sigma-Aldrich, 40 wt% in D2O, 99 atom % D). WinEQNMR
41
was used to fit the NMR raw data and provided the p𝐾a∗ values (i.e. pKa measured in D2O), which compare well with
those determined in H2O by using a pH-metric method. The pKas reported were obtained by converting the
protonation constants measured in D2O – p𝐾a∗ – into constants valid in H2O by using the expression p𝐾a=
0.929 × p𝐾a∗+ 0.42.14
Analysis and processing of the spectroscopic data
The spectrophotometric data were analyzed with the Specfit42–44 program which adjusts the absorptivities and the stability constants of the species formed at equilibrium. Specfit uses factor analysis to reduce the absorbance matrix and to extract the eigenvalues prior to the multiwavelength fit of the reduced data set according to the Marquardt algorithm.45,46
Electrospray mass spectrometric measurements
Electrospray mass spectra of cupric complexes with L1–L3 were obtained with an Agilent Technologies 6120 quadrupole equipped with an electrospray (ESI) interface. Solutions (5 × 10⁻⁵ M) of the Cu2+ complexes with L1–L3 have been prepared in water in the absence of any background salt. The sample solutions were continuously introduced into the spectrometer source with a syringe pump (KD Scientific) with a flow rate of 800 μL h−1. For electrospray ionization, the drying gas was heated at 250 °C and its flow was set at 6 L min−1. The capillary exit voltage was fixed at 5 kV and the skimmer voltage was varied from 100 to 170 V in order to optimize the signal responses. Scanning was performed from m/z = 100 to 1000 and no fragmentation processes were observed under our experimental conditions.
Electrochemistry
and Ag/AgCl/(3 M KCl) as the reference electrode (+210 mV vs. NHE, normal hydrogen electrode).47 Prior to each measurement, the surface of the GC electrode was carefully polished with a 0.3 μm aluminium oxide suspension (Escil) on a silicon carbide abrasive sheet of grit 800/2400. The GC electrode was then abundantly washed with water and dried with a paper towel and argon. The electrode was installed into the voltammetry cell along with the platinum wire counter electrode and the reference electrode. 10 mL of the buffered aqueous solutions containing ca. 10−3 M of the cupric complexes with L1–L3 were vigorously stirred and purged with O2-free (Sigma Oxiclear cartridge) argon for 15 minutes before the voltammetry
experiment was initiated, and it was maintained under an argon atmosphere during the measurement step. The cyclic voltammograms were recorded at room temperature (23(1) °C) in buffered aqueous solution at pH 7.4 (5 mM HEPES, 4-(2-hydroxyethyl)-1-piperazineethanesulfonic acid) and 95 mM NaClO4 as the
supporting and inert electrolyte.48 The voltage sweep rate was varied from 50 to 1000 mV s−1 and several cyclic voltammograms were recorded from +1.2 V to −2.0 V. Peak potentials were measured at a scan rate of 200 mV s−1 unless otherwise indicated.
Computational details
The geometries of the [Cu(L2-H)(H2O)n]
+
and [Cu(L2)(H2O)n]
2+
systems (n = 0–2) were optimized at the TPSSh/TZVP level49,50 using the Gaussian 09 package (Revision D.01).51 Bulk solvent effects (water) were included by using the integral equation formalism variant of the polarizable continuum model (IEFPCM),52 which models the solute cavity as an envelope of spheres with an appropriate radii centred on atoms or atomic groups. The universal force field radii (UFF)53 scaled by a factor of 1.1 were used to define the solute cavities. No symmetry constraints have been imposed during the optimizations. The stationary points found on the potential energy surfaces as a result of geometry optimizations were checked to represent energy minima rather than saddle points using frequency analysis. The default values for the integration grid (75 radial shells and 302 angular points) and the SCF energy convergence criteria (10−8) were used in all calculations.
Nonrelativistic energy levels and wave functions were computed using the Complete Active Space Self-Consistent Field (CASSCF) method54 along with the TZVP basis set and the ORCA program package (Version 3.0.3).55 CASSCF calculations were performed by using an active space including nine electrons distributed into the five Cu 3d-based molecular orbitals (CASS(9,5)). The CASSCF wavefunctions were subsequently analyzed using the N-electron valence perturbation theory to second order (NEVPT2)56 to account for dynamic correlation. The RIJCOSX approximation57 was used to speed up both CASSCF and NEVPT2 calculations with the aid of the Def2-TZVPP/JK auxiliary basis set58 as constructed automatically by ORCA. The spin–orbit contribution was considered employing the spin–orbit mean field approach (SOMF) using the one-center approximation to the exchange term (SOMF(1X)).42 The convergence tolerances and integration accuracies of the calculations were increased from the defaults using the available TightSCF and Grid7 options (for Cu). Solvent effects (water) were taken into account by using the conductor-like screening model (COSMO)59 as implemented in ORCA. Absorption spectra were calculated by using the CASSCF/NEVPT2 level including spin–orbit coupling effects by the quasi-degenerate perturbation theory (QDPT).60 The absorption profiles were simulated using Gaussian functions with a half width at half height of 3000 cm−1.
Conflicts of interest
Acknowledgments
R. T. acknowledges the Ministère de l'Enseignement Supérieur et de la Recherche and the Centre National de la Recherche Scientifique. M. E. thanks the Centre National de la Recherche Scientifique (CNRS). M. E. is also grateful to the New York University Abu Dhabi Undergraduate Research Program for the summer research funding for S. N. C. P.-I. and D. E.-G. acknowledge the Centro de Supercomputación de Galicia (CESGA) for providing the computer facilities.
References
1. (a) R. Delgado, V. Félix, L. M. P. Lima and D. W. Price, Dalton Trans., 2007, 2734–2743; (b) L. M. P. Lima, D. Esteban-Gómez, R. Delgado, C. Platas-Iglesias and R. Tripier, Inorg. Chem., 2012, 51, 6916–6927; (c) L. M. P. Lima, Z. Halime, R. Marion, N. Camus, R. Delgado, C. Platas-Iglesias and R. Tripier, Inorg. Chem., 2014, 53, 5269–5279.
2. R. S. Drago, Inorg. Chem., 1973, 12, 2211–2212.
3. (a) P. Scrimin and L. J. Prins, Chem. Soc. Rev., 2011, 40, 4488–4505; (b) F. Bartoli, A. Bencini, L. Conti, C. Giorgi, P. Paoli, P. Rossi, B. Valtancoli, N. Le Bris and R. Tripier, Org. Biomol. Chem., 2016, 14, 8309–8321.
4. G. Neri, J. J. Walsh, C. Wilson, A. Reynal, J. Y. C. Lim, X. Li, A. J. P. White, N. J. Long, J. R. Durrant and A. J. Cowan, Phys. Chem. Chem. Phys., 2015, 17, 1562–1566.
5. (a) C. R. Munteanu and K. Suntharalingam, Dalton Trans., 2015, 44, 13796–13808; (b) X. Liang and P. J. Sadler,Chem. Soc. Rev., 2004, 33, 246–266; (c) C. J. Anderson and M. J. Welch, Chem. Rev., 1999, 99, 2219–2234.
6. (a) M. D. Bartholomä, Inorg. Chim. Acta, 2012, 389, 36–51; (b) S. J. Archibald, Annu. Rep. Prog. Chem., Sect. A: Inorg. Chem., 2009, 105, 297–322.
7. Y. Sun, D. Chen, A. E. Martell and M. J. Welch, Inorg. Chim. Acta, 2001, 324, 180–187.
8. R. Machida, E. Kimura and M. Kodama, Inorg. Chem., 1983, 22, 2055–2061.
9. E. Kimura, T. Koike, R. Machida, R. Nagai and M. Kodama, Inorg. Chem., 1984, 23, 4181–4188.
10. L. C. Siegfried and T. A. Kaden, J. Phys. Org. Chem., 1992, 5, 549–555.
11. P. Antunes, R. Delgado, M. G. B. Drew, V. Felix and H. Maecke, Inorg. Chem., 2007, 46, 3144– 3153.
12. (a) F. Kou, S. Zhu, H. Lin, W. Chen, Y. Chen and M. Lin, Polyhedron, 1997, 16, 2021–2028; (b) S. Zhu, F. Kou, H. Lin, M. Lin and Y. Chen, Inorg. Chem., 1996, 35, 5851–5859; (c) T. Benabdallah and R. Guglielmetti, Bull. Soc. Chim. Fr., 1988, 5, 821–827; (d) V. Bernhardt, K. A. Byriel, C. H. L. Kennard and P. C. Sharpe, Inorg. Chem., 1996, 35, 2045–2052.
14. A. Kręźel and W. Bal, J. Inorg. Biochem., 2004, 98, 161–166.
15. E. Suet and A. Laouenan, Talanta, 1986, 33, 721–727.
16. R. D. Hancock, R. J. Motekaitis, J. Mashishi, I. Cukrowski, J. H. Reibenspies and A. E. Martell, J. Chem. Soc., Perkin Trans. 2, 1996, 1925–1929.
17. M. Micheloni, A. Sabatini and P. Paoletti, J. Chem. Soc., Perkin Trans. 2, 1978, 828–830.
18. P. J. Davies and K. P. Wainwright, Inorg. Chim. Acta, 1999, 294, 103–108.
19. V. Frenna, N. Vivona, G. Consiglio and D. Spinelli, J. Chem. Soc., Perkin Trans. 2, 1985, 1865– 1868.
20. R. J. Motekaitis, A. E. Martell and D. A. Nelson, Inorg. Chem., 1984, 23, 275–283.
21. Y. Moriguchi, M. Hashimoto and K. Sakata, Fukuoka Kyoiku Daigaku Kiyo, Dai-3-bunsatsu: Sugaku, Rika, Gijutsuka Hen, 1990, 43.
22. V. J. Thom, G. D. Hosken and R. D. Hancock, Inorg. Chem., 1985, 24, 3378–3381.
23. R. M. Smith, A. E. Martell and R. J. Motekaitis, Critical Stability Constants Database 46, version 5, NIST, Gaithersburg, MD, 1998.
24. W. R. Harris, C. J. Carrano and K. N. Raymond, J. Am. Chem. Soc., 1979, 101, 2213–2214.
25. R. N. Patel, R. P. Shrivastava, N. Singh, S. Kumar and K. B. Pandeya, Indian J. Chem., 2001, 40A, 361–367.
26. A. Sornosa Ten, N. Humbert, B. Verdejo, J. M. Llinares, M. Elhabiri, J. Jezierska, C. Soriano, H. Kozlowski, A.-M. Albrecht-Gary and E. Garcia-Espana, Inorg. Chem., 2009, 48, 8985–8997.
27. N. Wei, N. N. Murthy and D. K. Karlin, Inorg. Chem., 1994, 33, 6093–6100.
28. D. Grujicic and B. Pesic, Electrochim. Acta, 2002, 47, 2901–2912.
29. X. Liang and P. J. Sadler, Chem. Soc. Rev., 2004, 33, 246–266.
30. L. Siegfried, M. Neuburger, M. Zehnder and T. A. Kaden, J. Chem. Soc., Chem. Commun., 1994, 951–952.
31. A. Rodríguez-Rodríguez, Z. Halime, L. M. P. Lima, M. Beyler, D. Deniaud, N. Le Poul, R. Delgado, C. Platas-Iglesias, V. Patinec and R. Tripier, Inorg. Chem., 2016, 55, 619–632.
32. M. Le Fur, M. Beyler, N. Le Poul, L. M. P. Lima, Y. Le Mest, R. Delgado, C. Platas-Iglesias, V. Patinec and R. Tripier, Dalton Trans., 2016, 45, 7406–7420.
33. S. Ye, C. Kupper, S. Meyer, E. Andris, R. Naveátil, O. Krahe, B. Mondal, M. Atanasov, E. Bill, J. Roithová, F. Meyer and F. Neese, J. Am. Chem. Soc., 2016, 138, 14312–14325.
34. S. P. de Visser, M. G. Quesne, B. Martin, P. Comba and U. Ryde, Chem. Commun., 2014, 50, 262– 282.
35. Méthodes d'Analyses Complexométriques avec les Titriplex®, ed. E. Merck, Darmstadt, 1975.
37. P. Gans and B. O'Sullivan, Talanta, 2000, 51, 33–37.
38. (a) P. Gans, A. Sabatini and A. Vacca, HYPERQUAD2000, Leeds, U.K., and Florence, Italy, 2000; (b) P. Gans, A. Sabatini and A. Vacca, Talanta, 1996, 43, 1739–1753.
39. P. Gans, Data Fitting in the Chemical Sciences, John Wiley & Sons, Chichester, 1992.
40. L. Alderighi, P. Gans, A. Ienco, D. Peters, A. Sabatini and A. Vacca, Coord. Chem. Rev., 1999, 184, 311–318.
41. M. J. Hynes, J. Chem. Soc., Dalton Trans., 1993, 311–312.
42. H. Gampp, M. Maeder, C. J. Meyer and A. D. Zuberbühler, Talanta, 1985, 32, 95–101.
43. H. Gampp, M. Maeder, C. J. Meyer and A. D. Zuberbühler, Talanta, 1985, 32, 251–264.
44. H. Gampp, M. Maeder, C. J. Meyer and A. D. Zuberbühler, Talanta, 1985, 32, 1133–1139.
45. D. W. Marquardt, J. Soc. Ind. Appl. Math., 1963, 11, 431–441.
46. M. Maeder and A. D. Zuberbühler, Anal. Chem., 1990, 62, 2220–2224.
47. D. T. Sawyer, A. Sobkowiak and J. L. Roberts Jr., Electrochemistry for Chemists, 2nd edn, Wiley, New York, 1995, p. 192.
48. K. Izutsu, Electrochemistry in Nonaqueous Solutions, Wiley, 2002.
49. J. M. Tao, J. P. Perdew, V. N. Staroverov and G. E. Scuseria, Phys. Rev. Lett., 2003, 91, 146401.
50. A. Schaefer, C. Huber and R. Ahlrichs, J. Chem. Phys., 1994, 100, 5829–5835.
51. M. J. Frisch, G. W. Trucks, H. B. Schlegel, G. E. Scuseria, M. A. Robb, J. R. Cheeseman, G. Scalmani, V. Barone, B. Mennucci, G. A. Petersson, H. Nakatsuji, M. Caricato, X. Li, H. P. Hratchian, A. F. Izmaylov, J. Bloino, G. Zheng, J. L. Sonnenberg, M. Hada, M. Ehara, K. Toyota, R. Fukuda, J. Hasegawa, M. Ishida, T. Nakajima, Y. Honda, O. Kitao, H. Nakai, T. Vreven, J. A. Montgomery Jr., J. E. Peralta, F. Ogliaro, M. Bearpark, J. J. Heyd, E. Brothers, K. N. Kudin, V. N. Staroverov, R. Kobayashi, J. Normand, K. Raghavachari, A. Rendell, J. C. Burant, S. S. Iyengar, J. Tomasi, M. Cossi, N. RegaJ. M. Millam, M. Klene, J. E. Knox, J. B. Cross, V. Bakken, C. Adamo, J. Jaramillo, R. Gomperts, R. E. Stratmann, O. Yazyev, A. J. Austin, R. Cammi, C. Pomelli, J. W. Ochterski, R. L. Martin, K. Morokuma, V. G. Zakrzewski, G. A. Voth, P. Salvador, J. J. Dannenberg, S. Dapprich, A. D. Daniels, Ö. Farkas, J. B. Foresman, J. V. Ortiz, J. Cioslowski and D. J. Fox, Gaussian 09, Revision D.1, Gaussian, Inc., Wallingford CT, 2009.
52. J. Tomasi, B. Mennucci and R. Cammi, Chem. Rev., 2005, 105, 2999–3094.
53. A. K. Rappe, C. J. Casewit, K. S. Colwell, W. A. Goddard III and W. M. Skiff, J. Am. Chem. Soc., 1992, 114, 10024–10035.
54. P.-A. Malmqvist and B. O. Roos, Chem. Phys. Lett., 1989, 155, 189–194.
55. F. Neese, The ORCA Program System, Wiley Interdiscip. Rev.: Comput. Mol. Sci., 2012, 2, 73–78.
Cimiraglia, S. Evangelisti, T. Leininger and J.-P. Malrieu, J. Chem. Phys., 2001, 114, 10252; (d) C. Angeli and R. Cimiraglia, Theor. Chem. Acc., 2002, 107, 313.
57. (a) F. Neese, F. Wennmohs, A. Hansen and U. Becker, Chem. Phys., 2009, 356, 98–109; (b) R. Izsak and F. Neese, J. Chem. Phys., 2011, 135, 144105; (c) T. Petrenko, S. Kossmann and F. Neese, J. Chem. Phys., 2011, 134, 054116; (d) S. Kossmann and F. Neese, Chem. Phys. Lett., 2009, 481, 240– 243.
58. F. Weigend and R. Ahlrichs, Phys. Chem. Chem. Phys., 2005, 7, 3297–3305.
59. S. Sinnecker, A. Rajendran, A. Klamt, M. Diedenhofen and F. Neese, J. Phys. Chem. A, 2006, 110, 2235–2245.
60. (a) D. Ganyushin and F. Neese, J. Chem. Phys., 2006, 125, 024103; (b) F. Neese, J. Chem. Phys., 2005,122, 034107.
i Electronic supplementary information (ESI) available: Potentiometric titrations of L1–L3 and their cupric complexes,
![Fig. 5. Structures of (a) [CuL2(H 2 O)] 2+ , (b) [CuL2-H(H 2 O)] + , (c) [CuL2] 2+ , and (d) [CuL2-H] + obtained with DFT calculations (TPSSh/TZVP)](https://thumb-us.123doks.com/thumbv2/123dok_es/4008747.677299/12.892.167.725.145.732/fig-structures-cul-cul-obtained-calculations-tpssh-tzvp.webp)