Data Article
Data on the main working conditions with
in
fl
uence on the development of hearing loss
amongst the occupational population in Spain
Jesús P. Barrero
a, S. García-Herrero
a, M.A. Mariscal
a,n,
Available online 5 September 2018a b s t r a c t
Obtaining reliable and objective data on certain working condi-tions is necessary to analyse the causes and variables that can influence the development of hearing loss amongst the working population. Objective occupational data have been collected from a heterogeneous sample of 1418 workers in Spain, see“How activity type, time on the job and noise level on the job affect the hearing of the working population. Using Bayesian networks to predict the development of hipoacusia”(Barrero et al., 2018) [1]. Among the main factors analysed are the noise levels to which these workers are exposed, measured at their respective workstations, and the assessment of their hearing status, evaluated by audiometric medical tests. These factors provide information to predict the development of hypoacusia.
&2018 The Authors. Published by Elsevier Inc. This is an open access article under the CC BY license (http://creativecommons.org/licenses/by/4.0/).
Speci
fi
cations Table
Subject area
Population health
Speci
fi
c subject area
Occupational health and safety
Contents lists available at
ScienceDirect
journal homepage:
www.elsevier.com/locate/dib
Data in Brief
https://doi.org/10.1016/j.dib.2018.08.054
2352-3409/&2018 The Authors. Published by Elsevier Inc. This is an open access article under the CC BY license (http://creativecommons.org/licenses/by/4.0/).
DOI of original article:https://doi.org/10.1016/j.ssci.2018.07.011
nCorresponding author.
Type of data
Tables,
fi
gures
How data were acquired
Sound level meters, noise dosimeters and audiometric medical testing
Data format
Filtered, processed
Experimental factors
Occupational conditions from 1418 workers.
Experimental features
Noise levels exposure and audiometric medical tests
Data location
Spain
Data accessibility
Data is with this article.
Related research article
Jesús P.Barrero, Susana García-Herrero, Miguel A. Mariscal and J.M.
Gutierrez, How activity type, time on the job and noise level on the
job affect the hearing of the working population. Using Bayesian
networks to predict the development of hypoacusia. Safety Science,
Volume 110, Part A, December 2018, pp. 1
–
12.
https://doi.org/10.1016/
j.ssci.2018.07.011
.
Value of data
The dataset shows the average noise levels to which workers from different sectors of activity are
exposed and can be used to match data from other countries or sectors of activity.
The dataset can be used to show different aspects of occupational exposure to noise, such as daily
noise exposure (hours), number of years in the workplace, noise exposure in previous employment,
noise protection system based on hearing protection or time limitation.
The dataset can be useful for researchers to see the results of the audiometric studies carried out on
workers. The workers hearing health has been compared to international indices of auditory
assessment.
The dataset provides information for future health and safety at work studies, with special interest
for Health and Safety Technical Experts and medical professionals.
1. Data
Medical and occupational environment data were collected over a period of approximately two
years from a sample of 1418 workers from different activity sectors, ages and nationalities, who were
working in the provinces of Burgos and Valladolid, Spain. Ingemédica S.L., an occupational health and
safety consultancy, has collaborated with the University of Burgos to collect the data.
The dataset was designed to answer the basic questions of how and why some workers develop
hypoacusia. The variables are classi
fi
ed as demographic and personal factors (meaning those that
characterise a speci
fi
c population) occupational factors (those related to the working conditions in
different companies) and non-occupational factors (those that are manifested outside the work
environment)
[1]
.
Data from 1418 workers have been obtained including demographic/personal data (age, gender,
height, weight, nationality, blood pressure, etc), data on occupational factors (the type of sector or
activity of the company where these people work, job title, noise levels, daily exposure, number of
years at work, the use or not of hearing protection, whether or not there is any limitation of
tem-porary exposure to noise, occupational exposure to noise in previous employment, exposure to
ototoxic agents) and data on non occupational factors (pre-existing auditive diseases, and the use of
medicines that may have otic side effects).
All the data were anonymised and collected with the consent of the companies and individuals
involved.
2. Experimental design, materials and methods
The necessary data has been achieved through two main lines of work. The
fi
rst, focused on
obtaining the data referring to the noise levels at the workstations, has been carried out using sound
level meters and noise dosimeters. These measurements have been made by quali
fi
ed occupational
hygienists. The second line of work was consisted of carrying out medical tests which included
audiometries and questionnaires. The questionnaire, based on Occupational Health Surveillance
Protocols, was developed by the Department of Health and Welfare of the Junta de Castilla y León and
authorised by the Ministry of Health and Consumer Affairs of Spain
[2]
. In compliance with the Health
Surveillance Protocols and the current Spanish regulations on Health and Safety at work
[3
,
4]
the
audiometric tests were carried out by specialised personnel (occupational physicians and nurses)
using audiometers and soundproofed cabins.
This section considers the frequencies and categories associated with the main occupational
fac-tors selected as in
fl
uential in the development of hearing loss:
2.1. Noise level
2.1.1. Noise level of the sample
The results of the noise levels were divided into four groups, in keeping with Spanish Royal Decree
286/2006.
The
groups
are:
Low (LAeq.d
o
80 dB
and
LPeak
o
135 dB),
Moderate
(LAeq.
d
Z
80 dB
o
85 dB
and
LPeak
Z
135 dB
o
137 dB),
High
(LAeq.d
Z
85 dB
o
87 dB
and
LPeak
Z
137 dB
o
140 dB) and Very High (LAeq.d
Z
87 dB and LPeak
Z
140 dB). The percentage
frequency of each would be 30.68%, 46.54%, 7,69% and 15.09%, respectively.
2.1.2. Noise level by activity sector
The sample has been divided into the traditional economic sectors which are: Construction,
Agriculture/Livestock, Industry and Services. The percentage frequency of each would be 54.16%,
0.35%, 22.85% and 22.64%, respectively.
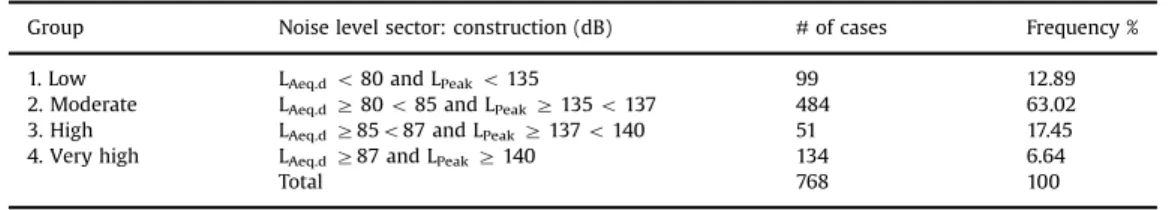
Sector: Construction.
The noise level distribution for the sample related to the construction sector can be seen in
Table 1
.
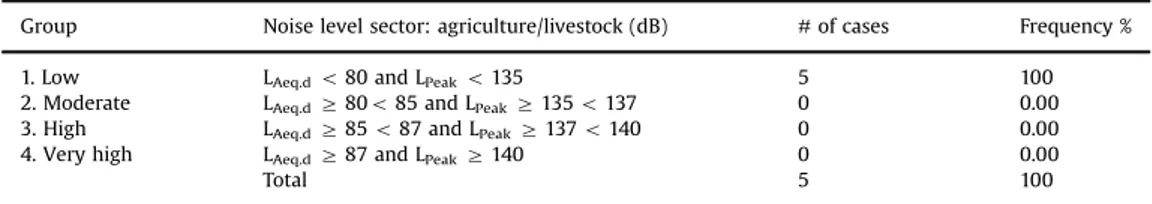
Sector: Agriculture/Livestock
Table 2
shows the noise level distribution related to the sector of Agriculture/Livestock.
Table 1
Noise level distribution in the construction sector. Source: Compiled by authors.
Group Noise level sector: construction (dB) #of cases Frequency %
1. Low LAeq.do80 and LPeako135 99 12.89 2. Moderate LAeq.dZ80o85 and LPeakZ135o137 484 63.02 3. High LAeq.dZ85o87 and LPeakZ137o140 51 17.45 4. Very high LAeq.dZ87 and LPeakZ140 134 6.64
Sector: Industry
Noise level distribution for the industry related sample can be seen in
Table 3
.
Sector: Services
Noise level distribution for the sample related to the Services sector can be seen in
Table 4
.
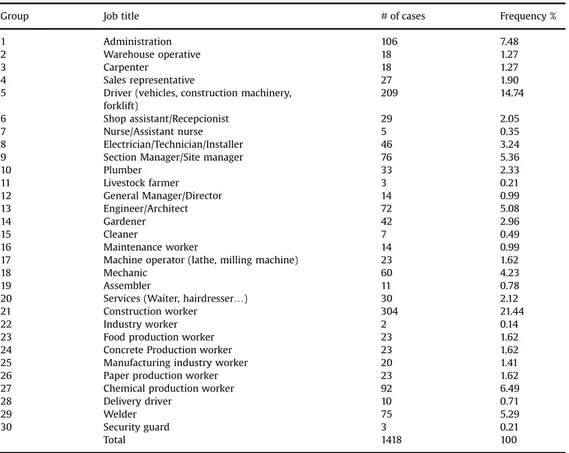
2.1.3. Noise level by job title
Table 5
shows how the sample is distributed according to the different jobs analysed.
Table 3
Noise level distribution in the industry sector. Source: Compiled by authors.
Group Noise level sector: industry (dB) #of cases Frequency %
1. Low LAeq.do80 and LPeako135 119 36.76 2. Moderate LAeq.dZ80o85 and LPeakZ135o137 98 30.25 3. High LAeq.dZ85o87 and LPeakZ137o140 55 16.98 4. Very high LAeq.dZ87 and LPeakZ140 52 16.05
Total 324 100
Table 4
Noise level distribution in the services sector. Source: Compiled by authors.
Group Noise level sector: services (dB) #of cases Frequency %
1. Low LAeq.do80 and LPeako135 212 66.04 2. Moderate LAeq.dZ80o85 and LPeakZ135o137 78 24.30 3. High LAeq.dZ85o87 and LPeakZ137o140 3 0.93 4. Very high LAeq.dZ87 and LPeakZ140 28 8.72
Total 321 100
Table 2
Noise level distribution in Agriculture/Livestock sector. Source: Compiled by authors.
Group Noise level sector: agriculture/livestock (dB) #of cases Frequency %
1. Low LAeq.do80 and LPeako135 5 100 2. Moderate LAeq.dZ80o85 and LPeakZ135o137 0 0.00 3. High LAeq.dZ85o87 and LPeakZ137o140 0 0.00 4. Very high LAeq.dZ87 and LPeakZ140 0 0.00
Job title: Administration
Table 6
shows the noise level distribution for the administration personnel.
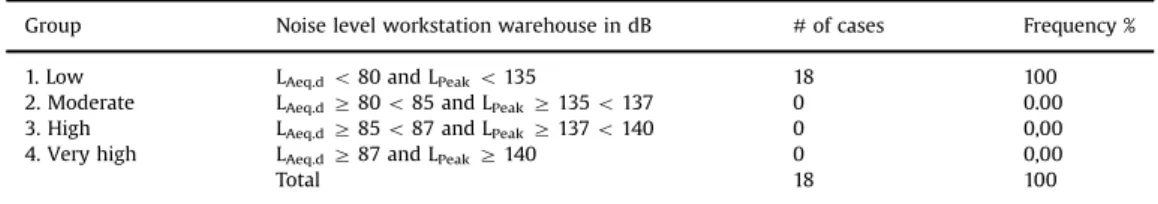
Job title: Warehouse operative
The noise level distribution for warehouse operatives is presented in
Table 7
.
Table 6Noise level distribution for the administration personnel. Source: Compiled by authors.
Group Noise level workstation administration (dB) #of cases Frequency %
1. Low LAeq.do80 and LPeako135 106 100
Distribution by job title. Source: Compiled by authors.
Group Job title #of cases Frequency %
1 Administration 106 7.48
2 Warehouse operative 18 1.27
3 Carpenter 18 1.27
4 Sales representative 27 1.90
5 Driver (vehicles, construction machinery, forklift)
209 14.74
6 Shop assistant/Recepcionist 29 2.05
7 Nurse/Assistant nurse 5 0.35
8 Electrician/Technician/Installer 46 3.24 9 Section Manager/Site manager 76 5.36
10 Plumber 33 2.33
11 Livestock farmer 3 0.21
12 General Manager/Director 14 0.99
13 Engineer/Architect 72 5.08
14 Gardener 42 2.96
15 Cleaner 7 0.49
16 Maintenance worker 14 0.99
17 Machine operator (lathe, milling machine) 23 1.62
18 Mechanic 60 4.23
19 Assembler 11 0.78
20 Services (Waiter, hairdresser…) 30 2.12
21 Construction worker 304 21.44
22 Industry worker 2 0.14
23 Food production worker 23 1.62
24 Concrete Production worker 23 1.62 25 Manufacturing industry worker 20 1.41 26 Paper production worker 23 1.62 27 Chemical production worker 92 6.49
28 Delivery driver 10 0.71
29 Welder 75 5.29
30 Security guard 3 0.21
Job title: Carpenter
Table 8
shows the noise level distribution for the carpenter's workstation.
Job title: Sales representative
The noise level distribution for the sales representative position can be seen in
Table 9
.
Job title: Driver
Table 10
shows the noise levels for the driver position.
Table 7
Noise level distribution for the warehouse operatives .Source: Compiled by authors.
Group Noise level workstation warehouse in dB #of cases Frequency %
1. Low LAeq.do80 and LPeako135 18 100 2. Moderate LAeq.dZ80o85 and LPeakZ135o137 0 0.00 3. High LAeq.dZ85o87 and LPeakZ137o140 0 0,00 4. Very high LAeq.dZ87 and LPeakZ140 0 0,00
Total 18 100
Table 8
Noise level distribution for the carpenter's workstation. Source: Compiled by authors.
Group Noise level carpenter's workstation (dB) #of cases Frequency %
1. Low LAeq.do80 and LPeako135 0 0.00 2. Moderate LAeq.dZ80o85 and LPeakZ135o137 4 22.22 3. High LAeq.dZ85o87 and LPeakZ137o140 0 0,00 4. Very high LAeq.dZ87 and LPeakZ140 14 72.78
Total 18 100
Table 9
Noise level distribution for the sales manager position. Source: Compiled by authors.
Group Noise level workstation sales representative in dB #of cases Frequency %
1. Low LAeq.do80 and LPeako135 25 92,59 2. Moderate LAeq.dZ80o85 and LPeakZ135o137 1 3,70 3. High LAeq.dZ85o87 and LPeakZ137o140 0 0,00 4. Very high LAeq.dZ87 and LPeakZ140 1 3,70
Total 27 100
Table 10
Noise level distribution for the driver position. Source: Compiled by authors.
Group Noise level driver (vehicles, construction machinery, etc) in dB #of cases Frequency %
1. Low LAeq.do80 and LPeako135 10 4.78 2. Moderate LAeq.dZ80o85 and LPeakZ135o137 52 24.88 3. High LAeq.dZ85o87 and LPeakZ137o140 19 9.09 4. Very high LAeq.dZ87 and LPeakZ140 128 61.24
Job title: Shop assistant/receptionist
The noise level distribution for the shop assistant/receptionist is shown in
Table 11
.
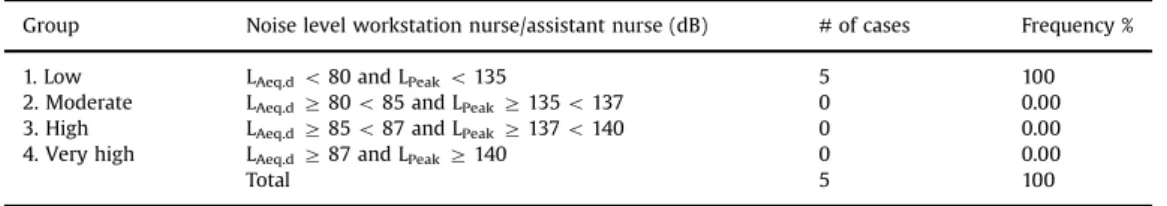
Job title: Nurse/Assistant nurse
Table 12
shows the noise level distribution for nurse/assistant nurse position.
Job title: Electrician/Technician/Installer
The noise level distribution for the electrician, technician and installer workstations is shown in
Table 13
.
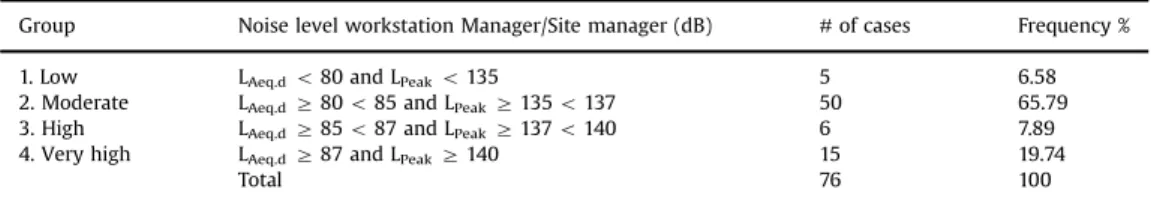
Job title: Section Manager/Site manager
Table 14
shows the noise level distribution for the workstation: Manager/Site manager.
Table 11
Noise level distribution for the shop assistant/receptionist. Source: Compiled by authors.
Group Noise level shop assistant/recepcionist (dB) #of cases Frequency %
1. Low LAeq.do80 and LPeako135 25 86.21 2. Moderate LAeq.dZ80o85 and LPeakZ135o137 4 13.79 3. High LAeq.dZ85o87 and LPeakZ137o140 0 0.00 4. Very high LAeq.dZ87 and LPeakZ140 0 0.00
Total 29 100
Table 12
Noise level distribution for nurse/assistant nurse position. Source: Compiled by authors.
Group Noise level workstation nurse/assistant nurse (dB) #of cases Frequency %
1. Low LAeq.do80 and LPeako135 5 100 2. Moderate LAeq.dZ80o85 and LPeakZ135o137 0 0.00 3. High LAeq.dZ85o87 and LPeakZ137o140 0 0.00 4. Very high LAeq.dZ87 and LPeakZ140 0 0.00
Total 5 100
Table 13
Noise level distribution for the Electrician/Technician/Installer workstations. Source: Compiled by authors.
Group Noise level workstation Electrician/Technician/Iinstaller in dB #of cases Frequency %
1. Low LAeq.do80 and LPeako135 29 63.04 2. Moderate LAeq.dZ80o85 and LPeakZ135o137 17 36.96 3. High LAeq.dZ85o87 and LPeakZ137o140 0 0.00 4. Very high LAeq.dZ87 and LPeakZ140 0 0.00
Job title: Plumber
The noise level distribution for the plumber's workstation can be seen in
Table 15
.
Job title: General Manager/Director
The noise level distribution for the General Manager/Director is shown in
Table 16
.
Job title: Engineer/Architect
Table 17
shows the noise level distribution for the Engineer/Architect position.
Table 16
Noise level distribution for General Manager/Director. Source: Compiled by authors.
Group Noise level workstation General Manager/Director (dB) #of cases Frequency %
1. Low LAeq.do80 and LPeako135 11 78.57 2. Moderate LAeq.dZ80o85 and LPeakZ135o137 2 14.29 3. High LAeq.dZ85o87 and LPeakZ137o140 1 7.14 4. Very high LAeq.dZ87 and LPeakZ140 0 0.00
Total 14 100
Table 17
Noise level distribution for Engineer/Architect position. Source: Compiled by authors.
Group Noise level workstation Engineer/Architect (dB) #of cases Frequency %
1. Low LAeq.do80 and LPeako135 66 91.67 2. Moderate LAeq.dZ80o85 and LPeakZ135o137 6 8.33 3. High LAeq.dZ85o87 and LPeakZ137o140 0 0.00 4. Very high LAeq.dZ87 and LPeakZ140 0 0.00
Total 72 100
Table 14
Noise level distribution for the Manager/Site manager workstation. Source: Compiled by authors.
Group Noise level workstation Manager/Site manager (dB) #of cases Frequency %
1. Low LAeq.do80 and LPeako135 5 6.58 2. Moderate LAeq.dZ80o85 and LPeakZ135o137 50 65.79 3. High LAeq.dZ85o87 and LPeakZ137o140 6 7.89 4. Very high LAeq.dZ87 and LPeakZ140 15 19.74
Total 76 100
Table 15
Noise level distribution for plumber workstation. Source: Compiled by authors.
Group Noise level workstation plumber in dB #of cases Frequency %
1. Low LAeq.do80 and LPeako135 19 57.58 2. Moderate LAeq.dZ80o85 and LPeakZ135o137 14 42.42 3. High LAeq.dZ85o87 and LPeakZ137o140 0 0.00 4. Very high LAeq.dZ87 and LPeakZ140 0 0.00
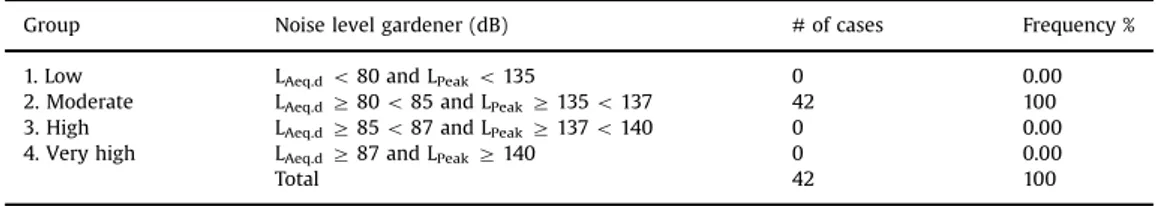
Job title: Gardener
The noise level distribution for the gardener position is shown in
Table 18
.
Job title: Cleaner
Table 19
shows the noise level distribution for the cleaners.
Job title: Production operator
The job title
“
production operator
”
includes several job titles, e.g. construction worker, industry
worker, food production worker, concrete production worker, manufacturing industry worker, paper
production worker and chemical production worker.
Table 20
shows the noise level distribution for
the production operator.
Table 18
Noise level distribution for gardener position. Source: Compiled by authors.
Group Noise level gardener (dB) #of cases Frequency %
1. Low LAeq.do80 and LPeako135 0 0.00 2. Moderate LAeq.dZ80o85 and LPeakZ135o137 42 100 3. High LAeq.dZ85o87 and LPeakZ137o140 0 0.00 4. Very high LAeq.dZ87 and LPeakZ140 0 0.00
Total 42 100
Table 19
Noise level distribution for the cleaners position. Source: Compiled by authors.
Group Noise level cleaner (dB) #of cases Frequency %
1. Low LAeq.do80 and LPeako135 4 57.14 2. Moderate LAeq.dZ80o85 and LPeakZ135o137 3 42.86 3. High LAeq.dZ85o87 and LPeakZ137o140 0 0.00 4. Very high LAeq.dZ87 and LPeakZ140 0 0.00
Total 7 100
Table 20
Noise level distribution for production operator. Source: Compiled by authors.
Group Noise level production operator (dB) #of cases Frequency %
1 LAeq.do80 and LPeako135 94 15.04 2 LAeq.dZ80o85 and LPeakZ135o137 394 63.04 3 LAeq.dZ85o87 and LPeakZ137o140 83 13.28 4 LAeq.dZ87 and LPeakZ140 54 8.64
Job title: Delivery driver
Table 21
shows the noise level distribution for the delivery driver position.
Job title: Welder
Table 22
shows the noise level distribution for the welder workstation.
●
Job title: Security guard
Table 23
shows the noise level distribution for the security guard position.
2.2. Exposure
2.2.1. Daily noise exposure (hours)
Table 24
shows the daily noise exposure in hours.
Table 21
Noise level distribution for the delivery driver position. Source: Compiled by authors.
Group Noise level workstation delivery driver in dB #of cases Frequency %
1 LAeq.do80 and LPeako135 10 100
Noise level distribution for welder operator position. Source: Compiled by authors.
Group Noise level welder (dB) #of cases Frequency %
1. Low LAeq.do80 and LPeako135 0 0.00
Noise level distribution for the security guard position. Source: Compiled by authors.
Group Noise level security guard (dB) #of cases Frequency %
1. Low LAeq.do80 and LPeako135 3 100
Daily noise exposure (hours). Source: Compiled by authors.
Group Daily noise exposure (h) #of cases Frequency %
1 o8 52 3.67
2 8 1129 79.62
3 48 237 16.71
2.2.2. Years on the job
Fig. 1
shows the distribution of the sample according to the number of years the employees have
been at their work locations. The average is 10.2 years, with a minimum value of 0 years and a
maximum of 49 years.
This variable has been discretized as shown in
Table 25
.
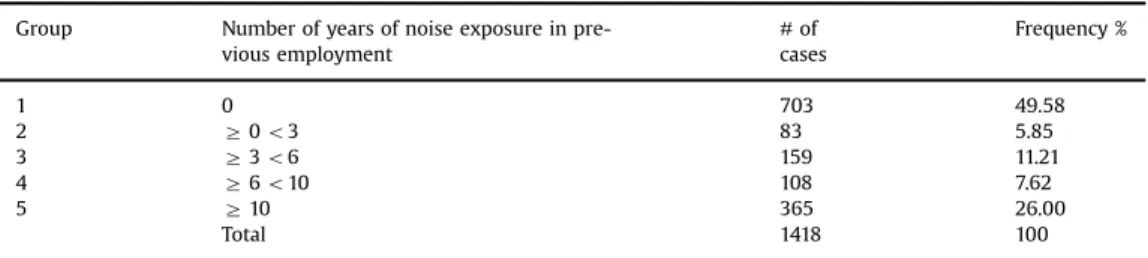
2.2.3. Number of years of noise exposure in previous jobs
Fig. 2
shows the sample distribution according to the number of years of noise exposure in
previous employment. The average is in 5.2 years, with a minimum value of 0 years and a maximum
of 46 years.
Table 26
shows the sample distribution according to the number of years in previous employment.
Fig. 1. Sample distribution by the years on the job.Source: Compiled by authors.
Table 25
Sample distribution by years on the job. Source: Compiled by authors.
Group Years on the job #of cases Frequency %
1 o3 230 16.22
2 Z3o6 317 22.36
3 Z6o10 249 17.56
4 Z10o16 335 23.62
5 Z16 287 20.00
Total 1418 100
2.2.4. Noise protection system based on hearing protection
The sample is divided into two unique groups, depending on whether or not the worker uses
hearing protection as a noise protection system. The results of the distribution can be seen in
Table 27
.
2.2.5. Noise protection system based on time limits
Table 28
shows the sample distribution by noise protection based on time limits.
2.2.6. Occupational exposure to ototoxic agents
The sample has been divided into two groups, depending on whether the worker has been
exposed to ototoxic agents or not, such as: carbon monoxide, lead, benzene and mercury. The results
of their distribution in the two groups can be seen in
Table 29
.
Table 27
Distribution of the sample by the use of hearing protection. Source: Compiled by authors.
Group Use of hearing protection #of cases Frequency %
1 No 986 69.53
2 Yes 432 30.47
Total 1418 100
Table 28
Noise protection system based on time limits. Source: Compiled by authors.
Group Noise protection system based on time limits
#of cases Frequency %
1 No 1261 88.93
2 Yes 157 11.07
Total 1418 100
Table 26
Sample distribution of the number of years of noise exposure in previous employment. Source: Compiled by authors.
Group Number of years of noise exposure in pre-vious employment
Sample distribution by exposure to ototoxic agents. Source: Compiled by authors.
Group Occupational exposure to ototoxic agents #of cases Frequency %
1 No 1338 94.36
2 Yes 80 5.64
2.3. The sample
'
s auditory health. Results of the audiometric study
Below are the overall results of the hearing tests performed. Sal, ELI and Global Hearing Loss
Percentages have been used to analyse these results.
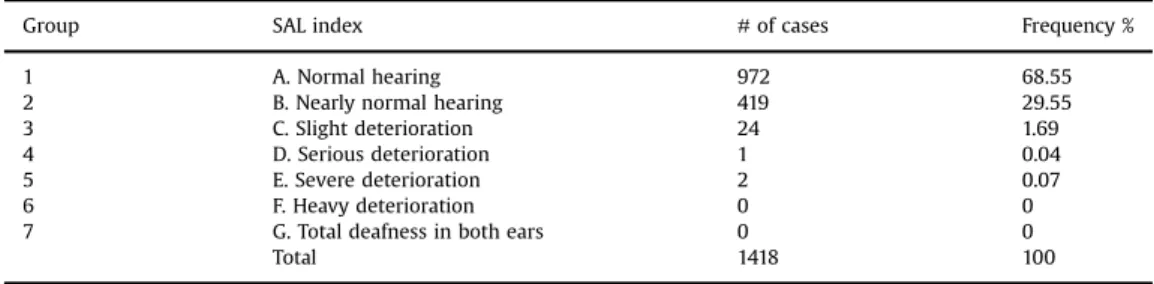
2.3.1. SAL index
The SAL index (Speech Average Loss), evaluates the conversation frequencies in 500 Hz, 1000 Hz
and 2000 Hz to then perform the arithmetic mean of the hearing loss in decibels of those frequencies.
The SAL index classi
fi
es the results from A to G depending on the worsening of hearing; SAL-A
meaning both ears are within normal limits and SAL-G total deafness
[2]
.
Table 30
shows the
dis-tribution of the sample in accordance with the SAL index.
2.3.2. ELI index
The ELI index (Early Loss Index) is calculated by subtracting a correction value for presbycusis from
the loss in the frequency of 4000 Hz (weighting the loss by age and by gender). The frequency of 4000
Hz is evaluated and the acoustic traumas are classi
fi
ed according to an increasing scale A-B-C-D-E,
from higher to lower auditory capacity, assessing the two ears individually
[2]
.
Table 31
shows the sample distribution according to the ELI Index.
2.3.3. Percentage of Global Hearing Loss
This variable has been classi
fi
ed by establishing groups in Percentage of Hearing Loss intervals.
This index considers each ear individually (monaaural) and both ears collectively (binaural)
[2]
.
With respect to the Hearing Loss Percentage Index for the Right Ear, the average is a hearing loss of
1.45%, with a minimum value of 0% and a maximum value of 88.13%. In reference to the Hearing Loss
Percentage Index for the Left Ear, the average is 1.66%, with a minimum value of 0% and a maximum
Table 30Sample distribution according to SAL index. Source: Compiled by authors.
Group SAL index #of cases Frequency %
1 A. Normal hearing 972 68.55
2 B. Nearly normal hearing 419 29.55
3 C. Slight deterioration 24 1.69
4 D. Serious deterioration 1 0.04
5 E. Severe deterioration 2 0.07
6 F. Heavy deterioration 0 0
7 G. Total deafness in both ears 0 0
Total 1418 100
Table 31
Sample distribution according to ELI Index. Source: Compiled by authors.
Group ELI index Right ear Left ear
#of cases
Frequency % #of cases
Frequency %
1 A. Normal excellent 590 41.61 477 33.64 2 B. Normal good 271 19.11 285 20.10
3 C. Normal 221 15.59 240 16.93
4 D. Suspected deafness
116 8.18 148 10.44
5 E. Clear indication of deafness
220 15.00 268 19.00
value of 91.12%. Once it has been discretized and divided into groups. Finally, with respect to the
Binaural Percentage Index, the average is 1%, with a minimum value of 0% and a maximum of 67%.
Table 32
shows the results obtained.
Transparency document. Supporting information
Transparency data associated with this article can be found in the online version at
http://dx.doi.
org/10.1016/j.dib.2018.08.054
.
References
[1] Barrero, et al., How activity type, time on the job and noise level on the job affect the hearing of the working population. Using Bayesian networks to predict the development of hypoacusia, Saf. Sci. 110 (Part A) (2018) 1–12.https://doi.org/ 10.1016/j.ssci.2018.07.011.
[2]M. Uña, E. García, A. Betegón, Protocolo de vigilancia sanitaria específica para los/las trabajadores/as expuestos al ruido, Centro de Publicaciones de la Secretaría Técnica del Ministerio de Sanidad y Consumo, Madrid (2000) 1–77.
[3] Ley31/1995, Ley de Prevención Riesgos Laborales, 31/1995, de 8 de noviembre, 1995.
[4] RD 286, RD REAL DECRETO 286/2006, de 10 de marzo, sobre la protección de la salud y la seguridad de los trabajadores contra los riesgos relacionados con la exposición al ruido, 2006.
Table 32
Sample distribution according to Hearing Loss Percentage Index. Source: Compiled by authors.
Group % Hearing loss Right ear Left ear Binaural
#of cases Frequency % #of cases Frequency % #of cases Frequency %
1 0 1299 91.61 1256 88.58 1221 86.11 2 Z0o15 70 4.94 103 7.26 163 11.50 3 Z15o30 32 2.26 35 2.47 28 1.97
4 Z30o45 6 0.42 16 1.13 4 0.28
5 Z45 11 1 8 1.00 2 0.00