Topological properties of polar food webs
12
0
0
Texto completo
(2) 16. Mar Ecol Prog Ser 474: 15–26, 2013. ation of ice loss in the Arctic (Stroeve et al. 2007, Duarte et al. 2012a). The Antarctic Peninsula is the only Antarctic region that has experienced a significant increase in temperature during recent years, with twice the warming rate observed in other Antarctic regions since 1950 (McClintock et al. 2008, Turner et al. 2009), but sea ice cover in 2012 was near its maximum for the post-1978 period of satellite assessments (Stammerjohn et al. 2012). Warming of polar regions triggers other environmental changes that may add to the effects of warming in polar ecosystems, including reduced ice extent, enhanced sea surface warming, and underwater light penetration, among others (Duarte et al. 2012b). Polar biota is particularly vulnerable to climate change, because the changes in sea ice, which is often critical habitat for many species, compound with the impacts of warming (Duarte 2008). Habitat loss and species invasions can alter the biodiversity and community composition of polar ecosystems, triggering regime shifts (Loeng et al. 2005, Wassmann et al. 2011). The impacts of climate change on ecosystems are often assessed through the evaluation of effects on individual species, which respond by changing their ranges and phenology to track their thermal niches (Root et al. 2003, Walther 2003). However, species’ responses to climate change are not independent, as species are connected through interactions in the ecosystem (Harrington et al. 1999, van der Putten et al. 2010, Walther 2010). The present focus on individual species responses must therefore be broadened to consider the responses of food webs to climate change. A first step towards this goal is to examine the topological properties of food webs to elucidate the architecture of species’ interdependences through trophic interactions (Dunne et al. 2005, Raffaelli 2005). Ecological network analysis provides a very compelling framework to address the complexity of species’ interactions with each other and with the environment and to quantify both direct and indirect effects of species’ interactions (Brose & Dunne 2007). Food webs are ecological networks where interactions among species are described in terms of predator−prey interactions (Dunne et al. 2002a). They provide complex yet tractable depictions of biodiversity, species’ interactions, and ecosystem structure and function and have played a central role in ecological research (May 1986, Marquet et al. 2005). The different values of food web topology metrics can provide insight into their vulnerability to perturbations (May 1973, Pimm 1982, Cohen et al. 1990, Link 2002).. Pimm et al. (1991) defined a food web as a map that describes the species in a community that prey on other species. Just as any map omits details, most published food webs omit details as well, such as prey species that represent minor components of a predator’s diet, the quantity of food consumed by predators, or the chemical composition and temporal variation of the trophic flows, among many other details. The food webs used in this study were based on species data. Accordingly, we removed all of the trophospecies from the original Barents Sea food web and from the Antarctic dietary database. Trophospecies are defined as sets of species that share the same predators and prey (Cohen et al. 1990), such as ‘phytoplankton,’ ‘detritus,’ ‘macroalgae,’ as well as species that only had trophic interactions with them. As a result, the food webs constructed here do not include photosynthetic or detritivorous organisms. Accordingly, herbivores are placed at the lower trophic level of the food webs studied, which includes metazoans, both benthic and pelagic, and excludes the microbial components of the ecosystems. Studies of resolution, aggregation, and sampling effort of taxa and trophic links in food webs have provided detailed understanding of the effects of different approaches to construct food webs on the ensuing structural characteristics (Martinez 1991, 1993, 1994, Martinez et al. 1999). Dunne et al. (2002a) suggested restricting the analyses to the best characterized food web available to reduce the influence of such limitations. Here we characterized the topological properties of the 2 largest food webs available for the Arctic and Antarctic regions among the many representations available, each including benthic and pelagic communities. The largest Arctic marine food web described to date was reported in a study on secondary extinctions in the Barents Sea food web by Bodini et al. (2009) and includes 140 species. Bodini et al. (2009) reconstructed this food web from information on species present in that ecoregion and their feeding habits extracted from various papers and reports (see Larsen et al. 2001, Dolgov 2002, Ciannelli et al. 2005, Stiansen et al. 2005 and references therein). The largest Antarctic marine food web reported to date was constructed on the basis of a thorough dietary database of Southern Ocean species recently reported by Raymond et al. (2011) and includes 586 species. Raymond et al. (2011) collated diet-related data from published and unpublished data sets and studies to produce a single coherent circum-Antarctic data set. The information used by Raymond et al. (2011) included direct sampling methods of dietary.
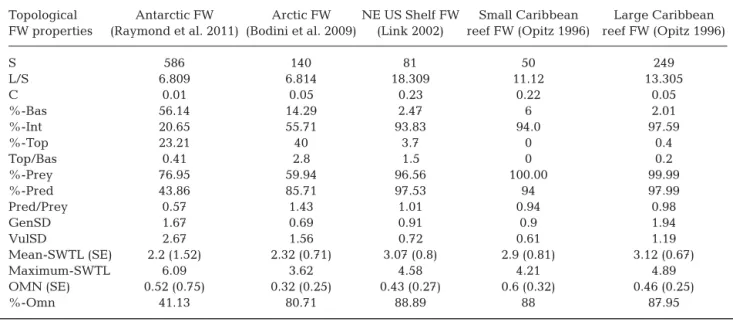
(3) de Santana et al.: Topological properties of polar food webs. assessment, including gut, scat, and bolus content analysis, stomach flushing, and observed feeding. The resulting data set comprises approximately 25 000 records from 300 studies and includes information on >1000 taxa. Only species located at latitudes higher than 60° S in the Antarctic Dietary Database of Raymond et al. (2011) were included in this study. Our aim was to apply recent developments in the analysis of food web networks to examine the robustness of these polar food webs. The analysis of their topological characteristics revealed structural differences that can determine distinct responses of the ecosystems to forcing. This analysis is based on welltested metrics and techniques, applied, to the best of our knowledge, for the first time to analyze the robustness of Arctic and Antarctic food webs.. MATERIALS AND METHODS For each food web analyzed, we calculated 15 topological network properties commonly used to characterize food web networks (Table 1; Williams & Martinez 2000, Dunne et al. 2002b, 2004, Petchey et al. 2008). We evaluated 4 standard measures of food web trophic interaction richness: number of species (S); number of links (L); links per species (L/S); and connectance (C) (Table 1). We also studied the cumulative distribution of the number of prey−predator relationships of each food web. This analysis examines the frequency distribution of the number of links (prey and predators) for each node in the network, which is known as the degree distribution (DD) of the web (Estrada 2007, Albert & Barabási 2002). We also calculated the trophic level (TL) of species in the food webs using the short-weighted TL (Williams & Martinez 2004). Short-weighted trophic level (SWTL) is defined as the average of the shortest TL and prey-averaged TL. Shortest TL of a consumer in a food web is equal to 1 + the shortest chain length from this consumer to a basal species (Williams & Martinez 2004). Prey averaged TL is equal to 1 + the mean TL of all the consumer’s trophic resources, calculated as S. TL j = 1 + ∑ l ij i=1. TL i nj. (1). where TLj is the trophic level of species j; S is the total number of species in the food web; lij is the connection matrix with S rows and S columns, in which for column j and row i, lij is 1 if species j consumes species i and 0 if not; and nj is the number of prey. 17. species in the diet of species j (Williams & Martinez 2004). Accordingly, SWTL yields a minimum estimate of TL and assumes a value of 1.0 for basal species (Williams & Martinez 2004). Six properties summarized the relative prevalence of species with different trophic positions in the food web: percentage of basal (%-Bas), intermediate (%-Int), and top (%-Top) species, where top species are those with prey but no predators, basal species have predators but no prey, and intermediate species have both predators and prey; percentage of prey species (%-Prey), which represents the percentage of species that have at least 1 predator; percentage of predator species (%-Pred), which represents the percentage of species that have at least 1 prey; and percentage of omnivorous species (%-Omn), as the proportion of species with prey at different TLs (Williams & Martinez 2000, Petchey et al. 2008). The mean omnivory of the food web (OMN) is represented by the average level of omnivory across species, where the level of omnivory displayed by each species is given by the standard deviation of the TL of its prey (Williams & Martinez 2000, Petchey et al. 2008). To quantify the variability of species’ normalized predator and prey counts, we also calculated the standard deviation of generalism (GenSD) and vulnerability (VulSD) for each food web (Petchey et al. 2008). The generalism of a species is the number of prey normalized by the link density of the food web. The vulnerability of a species is the number of predators normalized by the link density of the food web (Table 1). The standard deviation of these properties is calculated across all species in the food web (Petchey et al. 2008). We calculated these metrics using the statistical software R version 2.13 and the libraries Igraph (Csardi & Nepusz 2006) and NetIndices (Kones et al. 2009). In order to provide a comparison between polar food webs and marine food webs elsewhere, we calculated these same network properties (Dunne et al. 2002b, Link 2002, Williams & Martinez 2004, Estrada 2007) for 3 thoroughly studied marine food webs. These include the Northeast US Shelf ecosystem (NE US Shelf), represented by a food web with 81 species (Link 2002), and 2 versions of the Caribbean coral reef ecosystem, with 249 (Large Caribbean Reef) and 50 species (Small Caribbean Reef; Opitz 1996).. RESULTS Direct comparison of food web properties suggests that Arctic and Antarctic marine ecosystems, as rep-.
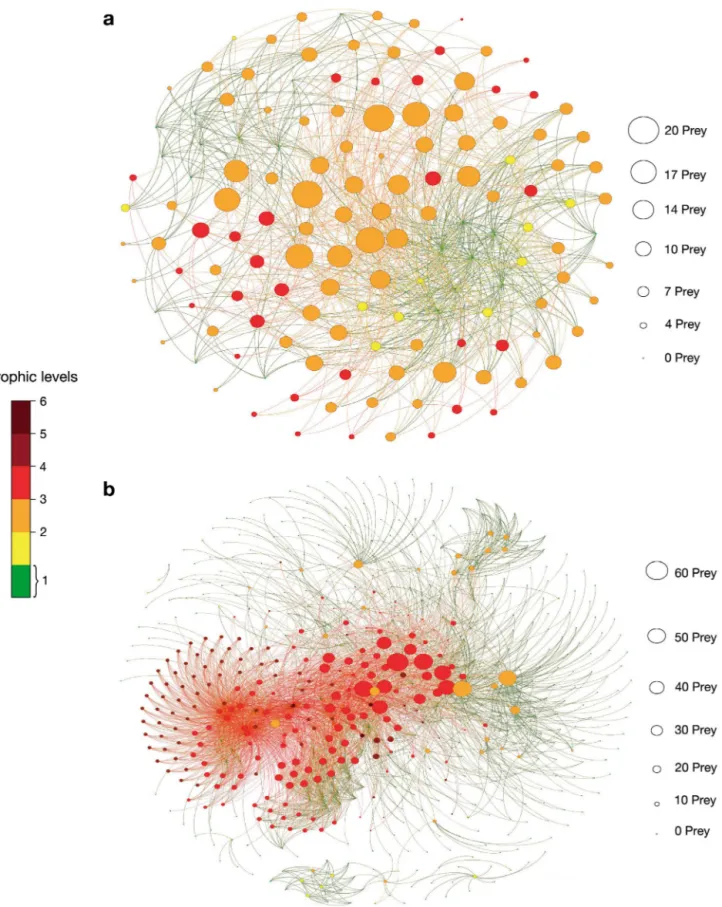
(4) Mar Ecol Prog Ser 474: 15–26, 2013. 18. Table 1. Definition of 15 structural properties of food webs Abbreviation. Index. Definition. Source. S. Number of species. Number of species represented in the food web. Dunne et al. (2002b). L. Number of links. Number of trophic relationships represented in the food web. Dunne et al. (2002b). L/S. Links per species. Mean number of trophic relationships per species, also referred to as ‘link density’. Dunne et al. (2002b). C = L/S2. Connectance. Proportion of all possible trophic links (S2) that are actually Dunne et al. (2002b) realized (L), also referred to as ‘directed connectance’. CDD. Cumulative degree distribution. Cumulative distribution of the number of links that each species in the food web has. Estrada (2007). %-Bas. Proportion of basal species. Basal species are those that have no prey in the food web. Petchey et al. (2008). %-Int. Proportion of intermediate species. Intermediate species are those that have both prey and predators in the food web. Petchey et al. (2008). %-Top. Proportion of top species. Top species are those that have prey but no predators in the food web.. Petchey et al. (2008). %-Prey. Proportion of prey. Prey species are those that have at least 1 predator in the food web. Cohen et al. (1990). %-Pred. Proportion of predators. Predator species are those that have at least 1 prey in the food web. Cohen et al. (1990). GenSD. Deviation of mean generality. Standard deviation of ‘generality,’ which for each species is the number of prey divided by the link density (no. prey/[L/S]).. Harper-Smith et al. (2005). VulSD. Deviation of mean vulnerability. Standard deviation of ‘vulnerability,’ which for each species is the number of predators divided by the link density (no. predators/[L/S]).. Harper-Smith et al. (2005). SWTL. Short-weighted trophic level. Mean short-weighted trophic level of a food web. Williams & Martinez (2004). OMN. Level of omnivory. Level of omnivory displayed by each species is the standard deviation of the SWTL of its resources. This value is averaged across all species in the food web. Petchey et al. (2008). %-Omn. Proportion of omnivorous. Proportion of species with prey at >1 TL, i.e. species for which OMN is > 0. Petchey et al. (2008). resented by the particular marine food webs analyzed here, present strong structural differences. The graph representing the Arctic marine food web as a network (Fig. 1a) comprised a total of 140 nodes (each representing 1 species in the food web), and 954 links (each representing 1 trophic interaction between 2 species); the graph representing the Antarctic marine food web comprised 586 nodes and 3990 links (Fig. 1b). Most species in the Antarctic food web occupy low trophic levels (green) and, consequently, are basal. On the other hand, most of species in the Arctic food web occupy high trophic levels and have more prey. The Arctic food web has more consumers than producers (the ratios Top:Bas and Pred:Prey are both >1, at 2.8 and 1.43, respectively) while the Antarctic marine. food web has more producers than consumers (Top:Bas = 0.41, Pred:Prey = 0.57; Table 2). The difference in the Top:Bas ratio between the Arctic and Antarctic marine food webs analyzed here is also supported by the analysis of the TLs of each food web. The distribution of values of SWTL shows that most of Antarctic species are situated at lower TLs, while most Arctic species are located at higher TLs (Fig. 2). However, the Antarctic marine food web has some species with SWTL > 5, while the Arctic food web species has a maximum SWTL < 4. Analysis of SWTL established that about 80% of Arctic species prey on species from more than 1 TL, implying that 80% of Arctic species are omnivorous. By contrast, only about 40% of Antarctic species.
(5) de Santana et al.: Topological properties of polar food webs. 19. Fig. 1. (a) Arctic and (b) Antarctic food webs studied. Each node in the networks represents 1 species of the food web, and lines connecting these nodes represent trophic relationships among the species. Different colors of the nodes are associated with different trophic levels of the species they represent. The smaller nodes represent basal species that have no prey in the food web. Increasing node sizes represent predator species coincident with an increasing number of prey species.
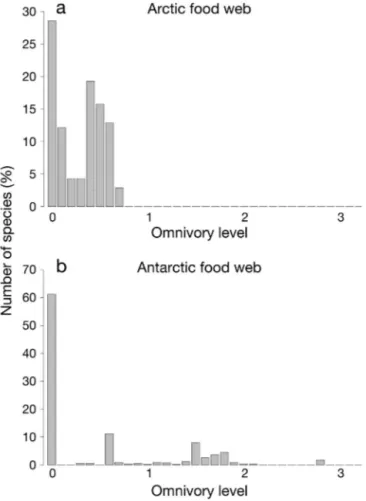
(6) Mar Ecol Prog Ser 474: 15–26, 2013. 20. Table 2. Comparison between topological characteristics of the Arctic and the Antarctic food webs (FWs) and other marine FWs previously studied by Dunne et al. (2002b). Abbreviations of properties as in Table 1 Topological FW properties. Antarctic FW Arctic FW NE US Shelf FW Small Caribbean Large Caribbean (Raymond et al. 2011) (Bodini et al. 2009) (Link 2002) reef FW (Opitz 1996) reef FW (Opitz 1996). S L/S C %-Bas %-Int %-Top Top/Bas %-Prey %-Pred Pred/Prey GenSD VulSD Mean-SWTL (SE) Maximum-SWTL OMN (SE) %-Omn. 586 6.809 0.01 56.14 20.65 23.21 0.41 76.95 43.86 0.57 1.67 2.67 2.2 (1.52) 6.09 0.52 (0.75) 41.13. 140 6.814 0.05 14.29 55.71 40 2.8 59.94 85.71 1.43 0.69 1.56 2.32 (0.71) 3.62 0.32 (0.25) 80.71. Fig. 2. Distribution of the trophic levels of (a) Arctic and (b) Antarctic food webs studied. Most Antarctic species are at lower trophic levels, while most Arctic species are at trophic levels between 2 and 3. 81 18.309 0.23 2.47 93.83 3.7 1.5 96.56 97.53 1.01 0.91 0.72 3.07 (0.8) 4.58 0.43 (0.27) 88.89. 50 11.12 0.22 6 94.0 0 0 100.00 94 0.94 0.9 0.61 2.9 (0.81) 4.21 0.6 (0.32) 88. 249 13.305 0.05 2.01 97.59 0.4 0.2 99.99 97.99 0.98 1.94 1.19 3.12 (0.67) 4.89 0.46 (0.25) 87.95. show this behavior (see Table 2), even though the Antarctic marine food web has a higher level of omnivory (OMN) than the Arctic web (0.52 versus 0.32). Further examination of the distribution of omnivory levels (Fig. 3) shows that although most Antarctic species are not omnivorous (OMN = 0), the few omnivorous species have OMN values much higher than those of Arctic species. While Arctic species have OMN typically between 0 and 1, Antarctic species typically have OMN values between 1 and 2, with a maximum close to 3. Hence, omnivorous Antarctic species feed on species across a broader range of trophic levels compared to those in the Arctic. Because of this distribution, the mean value of OMN is higher for the Antarctic marine food web, despite the proportion of omnivorous species in the Arctic food web being much higher than that in the Antarctic food web. The Arctic and Antarctic marine food webs differ greatly in their generality (GenSD) and vulnerability (VulSD) properties. The Antarctic food web shows higher values for both properties than the Arctic (Table 2). A greater generality for the Antarctic food web (2.67, versus 1.69 for the Arctic food web) implies that Antarctic species share twice as many predators with other species than do Arctic species, and differences in vulnerability (2.67, versus 1.56 for the Arctic food web) imply that Antarctic species share more prey with other species than do Arctic species. The CDDs reveal important differences in the robustness of the 2 food webs (Fig. 4). The Arctic food.
(7) de Santana et al.: Topological properties of polar food webs. 21. Fig. 4. Cumulative degree distribution (CDD) of Arctic and Antarctic food webs, showing the proportion of nodes of a food web that have at least k links (both predator and prey links). Fig. 3. Distribution of the level of omnivory (see Table 1) of (a) Arctic and (b) Antarctic food webs studied. All Arctic species show omnivory levels between 0 and 1, while the Antarctic food web has species with omnivory levels > 2. web shows an exponential decay of degree distribution while the Antarctic food web shows 2 contrasting behaviors, viz. an initial exponential decay followed by a power law (straight line distribution in the smaller log-log plot) cut-off at higher degrees. Despite these differences, other properties of the 2 marine food webs are quite similar. The number of links per species (L /S) is nearly identical (Arctic: 6.814, Antarctic: 6.809), and both have relatively small connectance (C) values (Arctic: 0.05, Antarctic: 0.01). The dietary datasets used in this work present high species diversity throughout many TLs. The high number of species in these food web representations renders multiscale analysis of food web properties possible, including the CDD analysis. However, the different number of species in each food web, the different size of the regions they represent (Barents Sea and the entire Southern Ocean south of 60° S), and the absence of microbial and photosynthetic lower trophic species may introduce uncertainties in the. conclusions of the network analysis presented here. To examine the robustness of our conclusions, we investigated additional sets of polar food webs in an effort to assess whether our conclusions are contingent on the particular food webs analyzed or represent generic traits of Arctic and Antarctic ecosystems. First, to better understand the possible effects of the different number of species in each food web, we analyzed the topological properties of 5 small polar food webs published by Cohen (1989) in the Ecologists’ Co-Operative Web Bank (ECOWeB) collection. Three Antarctic food webs (food webs number 21, 30, and 102 in the ECOWeB collection) with 10, 14, and 9 species, respectively, and 2 Arctic food webs (numbers 29 and 87 in the ECOWeB collection) with 22 and 12 species, respectively. The analysis of these small food webs confirmed the main topological properties detected in our analyses of the larger food webs. The 2 Arctic food webs showed a higher proportion of consumers in comparison to producers (ratios of predators:prey were 1.81 and 1.66, respectively) compared to the 3 Antarctic ones (0.77, 1.0, and 0.87, respectively). To examine the possible effect of the size of the regions on the results presented here, we performed the same network analysis for 2 subsets of the large Antarctic food web, composed of species identified in eastern and in western regions of Antarctica. We constructed these smaller food webs with the same restrictions used to construct the larger one (e.g. only species present south of 60° S were included, and aggregated taxa were excluded). However, we added a longitude restriction to separate both food webs into an East Antarctic food web, including the records from locations with longitude between 0° and 180° E,.
(8) 22. Mar Ecol Prog Ser 474: 15–26, 2013. most Arctic species were at higher SWTLs than Antarctic species. Thus, the Antarctic food web shows a pyramid shape, characteristic of coastal marine food webs (Gasol et al. 1997), whereas the Arctic web was characterized by an inverted pyramid, with a high Topological food All Antarctic East Antarctic West Antarctic number of species with SWTLs between 2 web properties (Raymond (between 0° (between 0° and 3, more characteristic of open ocean et al. 2011) and 180° E) and 180° W) marine food webs (Gasol et al. 1997). Also, S 586 563 408 the Antarctic food web showed higher vulC 0.01 0.03 0.02 nerability (VulSD) and generality (GenSD). L /S 6.81 15.01 6.9 A higher generality means that this food web %-Bas 56.14 72.29 59.31 has more prey species for each predator spe%-Top 23.21 14.39 23.28 cies than the Arctic one does. All of these Top/Bas 0.41 0.2 0.39 properties can be related to the diversity of %-Prey 76.79 85.61 76.72 species, such that that the Arctic food web %-Pred 43.86 27.71 40.69 has a greater diversity of predators and top Pred/Prey 0.57 0.32 0.53 GenSD 1.67 3.51 1.5 species, while the Antarctic has a greater VulSD 2.67 3.71 2.9 diversity of prey and basal species. Mean-TL (SE) 2.2 (1.52) 1.5 (0.7) 1.81 (0.84) Bruno & O’Connor (2005) concluded that Maximum-TL 6.09 3.14 3.67 consumer diversity effects based on dietary Mean OMN (SE) 0.52 (0.75) 0.14 (0.25) 0.37 (0.4) complementarity are essentially governed by %-Omn 39.08 26.34 48.2 the ratio of predator to prey diversity. Some meta-analyses and experiments indicate that increasing prey diversity can reduce conand a West Antarctic food web, including records sumer control of plant and herbivore populations from locations with longitude between 0° and 180° W. (Schmitz et al. 2000, Shurin et al. 2002, Hillebrand & Both West and East Antarctic food webs showed Cardinale 2004, Thébault et al. 2007). Bruno & topological properties quite similar to those of the O’Connor (2005) concluded that increasing predator larger Antarctic food web (details are provided in diversity relative to herbivore diversity should Table 3). The ratio of predators:prey was < 0, and strengthen trophic cascade effects. Hence, the food both showed a low proportion of omnivorous species web structure displayed by the Arctic marine food compared with the Arctic food web. web renders it more vulnerable than the Antarctic one to trophic cascade effects derived from losses of key predator species. Given the threats that climate DISCUSSION change and ice loss pose to Arctic predators (Wassmann et al. 2011), a detailed examination of the Arctic and Antarctic ecosystems rank amongst robustness of the Arctic food web to the loss of top those most vulnerable to the impacts of anthropopredators deserves further attention. In fact, these genic climate warming (Vaughan et al. 2003, Walsh losses are functional in nature and do not require 2005, Stroeve et al. 2007, Duarte et al. 2012a,b). Yet, species extinction, simply that the predator abundespite both being polar ecosystems, they present dance be reduced to the point that its effect in removfundamental differences in food web structure and ing prey species becomes negligible as a population topology. These differences were characterized control mechanism. Whereas species extinction may through the quantification of 15 different food web still be unlikely, the decline of predator species in the properties for the most detailed Arctic and Antarctic Arctic may soon reach functional extinction levels marine food webs described in the literature (Bodini (Wassmann et al. 2011). et al. 2009, Raymond et al. 2011). The CDD of both food webs showed small but The main differences found between the food webs important differences affecting the robustness of reside in the shape of the trophic linkages, including the food webs. The degree distribution of the Arctic the ratio of basal to top species, and the ratio of prey marine food web follows an exponential decay to predators. The Antarctic marine food web had a behavior, while the Antarctic one has an initial greater fraction of basal and prey species, whereas exponential decay behavior followed by a power Table 3. Comparison between topological characteristics of the entire Antarctic food web and 2 subsets of the Antarctic food web that consider species located at eastern and western longitudes. The same food web properties previously compared with other marine food webs are represented in this table. Abbreviations as in Table 1.
(9) de Santana et al.: Topological properties of polar food webs. law cut-off at higher degrees. The influence that the CDD has on the resilience of complex networks against random failures and intentional attacks has become well known since the publication of the seminal paper of Albert et al. (2000). They showed that networks displaying power law CDDs are very vulnerable to the removal of the most connected nodes, which leads to a catastrophic fragmentation of the network. Exponential networks are also very vulnerable to the removal of the most connected nodes, but not as much as for power law networks (Albert et al. 2000, Dunne et al. 2002a, Estrada 2007). However, exponential networks are catastrophically fragmented by random removal of nodes, while no threshold for fragmentation is observed for random failures in power law networks. Thus, the power law characteristic of CDDs of the Antarctic marine food web also suggests that it may be more robust against random perturbations than the Arctic, although it can be more vulnerable to perturbations affecting the most connected nodes. This implies that the Antarctic marine food web should be particularly vulnerable to losses of the most important prey species, Antarctic krill Euphausia superba, which is the most connected prey species in this trophic network. The emerging Antarctic krill fishery and climate change impacts on Antarctic krill (Atkinson et al. 2004) are therefore serious threats to the stability of the Antarctic food web. On the other hand, although both marine food webs have relatively small connectance (C) and number of links per species (L /S), both properties show somewhat higher values in the Arctic than the Antarctic food web. Particularly, the connectance of the Arctic food web was 5 times greater than that of the Antarctic one (0.05 versus 0.01). MacArthur (1955) identified complexity as a key trait determining the stability of food webs and defined complexity in food webs as the diversity of alternative pathways for energy flow, typically measured using connectance and link density in a food web. Empirical analyses of food webs support the notion that the robustness of a food web increases with its connectance and link density (De Angelis 1975, Dunne et al. 2002a,b, Montoya & Solé 2003). Furthermore, Pimm et al. (1991) concluded that highly connected communities, such as the Arctic marine food web, should be most sensitive to the loss of top predator species because secondary extinctions propagate more widely in these food webs than in loosely connected communities. In contrast, less connected communities, such as the Antarctic food. 23. web, should be more sensitive to the loss of basal species than complex communities, because the consumers in simple communities are dependent on only a few species and cannot survive their loss. The Arctic food web has a greater prevalence of omnivorous species (%-Omn) than the Antarctic one, which may result in a higher persistence of the former, as higher proportions of omnivorous species appear to be associated with greater food web persistence (Arim & Marquet 2004, Stouffer & Bascompte 2010). In addition, Baiser et al. (2010) proposed that an increase in connectance and the fraction of omnivorous species has a negative influence on the capacity of invasive species to become established at basal TLs of a food web. We compared the properties of the Arctic and Antarctic marine food webs analyzed here to those of 3 other marine food webs previously studied by Dunne et al. (2004). As detailed in Table 2, the Pred: Prey and Top:Bas ratios of the Antarctic food web were quite similar to both the small and large reef webs analyzed by Dunne et al. (2004), while the ratios of the Arctic food web were more similar to the ratios of the continental shelf food web (Table 2). However, the connectance (C) and number of links per species (L/S) of the polar food webs were much smaller than those reported for other marine food webs, implying that polar food webs are more vulnerable to perturbations than other marine food webs (De Angelis 1975, Dunne et al. 2002a,b, Montoya & Solé 2003). The results presented here show that the Arctic and Antarctic marine food webs have evolved to show fundamentally different topological properties, with important consequences for their robustness and stability. In particular, the properties analyzed here suggest that the Antarctic food web examined is more robust to perturbations than the Arctic one is. Indeed, the Arctic food web is top heavy, with many species at high TLs, whereas the Antarctic food web is bottom heavy, with many species at low TLs supporting a few high-level predators. These topological differences may be associated with differences in the evolutionary histories of these 2 ecosystems, such as the time of last glaciation and deglaciation (Sowers & Bender 1995, Zachos et al. 2001, Knorr & Lohmann 2003, McKay et al. 2012), and the time of the first record of ‘core’ species in these ecosystems (Fordyce 1989, Harington 2008). Paleoclimate studies report that the last Southern Hemisphere Glaciation occurred ~14 million years ago (Ma), whereas the last Northern Hemisphere.
(10) 24. Mar Ecol Prog Ser 474: 15–26, 2013. Glaciation occurred more recently, about ~2.7 Ma (Zachos et al. 2001, McKay et al. 2012). Further, icecore and ocean-sediment records reveal that during the 2 most recent deglaciations, the Southern Hemisphere warmed before Greenland did (Sowers & Bender 1995, Knorr & Lohmann 2003). The earliest records of the core Arctic mammals (polar bear; walrus; bearded, harp, and ringed seals; bowhead and white whales; and narwhals) date from the Late Miocene (10.4 to 6.7 Ma) to the Late Pleistocene (80 to 70 ka), whereas the earliest records of core Antarctic mammals (whales; dolphins; earless and fur seals; and sea lions) date from the Late Eocene (37.2 to 33.9 Ma) to the Early Pliocene (5.3 to 3.3 Ma; Fordyce 1989, Harington 2008). These sequences suggest that the Antarctic ecosystem may have reached a biogeographic steady state much earlier than the Arctic did. The earlier completion of the Antarctic food web compared to the Arctic may explain the pyramidal shape exhibited by the Antarctic food web, which is theoretically more stable than the inverse pyramid shape exhibited by the Arctic food web. Impacts of climate change on polar food webs may also be derived from responses in the microbial components (e.g. Duarte et al. 2012b), which were not included in this analysis. Extending this analysis to microbial components is indeed important, but will only be possible once data at the species level are available for polar microbial assemblages. While these data do not yet exist, application of molecular tools may soon deliver the necessary detail to extend the analysis of the metazoan polar food web presented here to the entire community, including the associated microbial assemblages. However, the impacts of changes in the microbial assemblages not included in the analysis will enter the marine metazoan food web analyzed here through the basal species. The effects of changes in the basal species are captured by the topological analyses conducted here, which therefore provide a useful diagnostic of the structural robustness of polar food webs. Acknowledgements. This is a contribution to the LINCGlobal project, funded by CSIC and PUC (www.lincg.uccsic.es), and to the ATP project, funded by the FP7 program of the EU (contract number 226248, cf. www.eu-atp.org). We thank B. Raymond, S. Allesina, and J. Dunne for providing food web data, as well as J. Cohen for making the ECOWeB compendium available to the ecological community. We thank B. Raymond, S. Allesina, J. Dunne, P. Wassmann, S. Navarrete, and J. Holding for helpful suggestions, as well as J. Piatt and 3 anonymous reviewers for their valuable comments on the manuscript and constructive suggestions.. This manuscript was partially written at Estación Costera de Investigaciones Marinas, Chile. C.N.S. was supported by a JAE-PreDOC fellowship from the Spanish National Research Council (CSIC).. LITERATURE CITED Albert R, Barabási AL (2002) Statistical mechanics of complex networks. Rev Mod Phys 74:47−97 Albert R, Jeong H, Barabási AL (2000) Error and attack tolerance of complex networks. Nature 406:378−382 Arim M, Marquet PA (2004) Intraguild predation: a widespread interaction related to species biology. Ecol Lett 7: 557−564 Atkinson A, Siegel V, Pakhomov E, Rothery P (2004) Longterm decline in krill stock and increase in salps within the Southern Ocean. Nature 432:100–103 Baiser B, Russell GJ, Lockwood JL (2010) Connectance determines invasion success via trophic interactions in model food webs. Oikos 119:1970−1976 Bodini A, Bellingeri M, Allesina S, Bondavalli C (2009) Using food web dominator trees to catch secondary extinctions in action. Philos Trans R Soc Lond B Biol Sci 364:1725−1731 Brose U, Dunne JA (2007) Modelling the dynamics of complex food webs. In: Pascual M, Dunne JA (eds) Ecological networks: linking structure to dynamics in food webs. Oxford University Press, Oxford, p 37−44 Bruno JF, O’Connor MI (2005) Cascading effects of predator diversity and omnivory in a marine food web. Ecol Lett 8: 1048−1056 Burrows MT, Schoeman DS, Buckley LB, Moore P and others (2011) The pace of shifting climate in marine and terrestrial ecosystems. Science 334:652−655 Ciannelli L, Hjermann DØ, Lehodey P, Ottersen G, DuffyAnderson JT, Stenseth NC (2005) Climate forcing food web structure and community dynamics in pelagic marine ecosystems. In: Belgrano A, Scharler U, Dunne J, Ulanowicz RE (eds) Aquatic food webs: an ecosystem approach. Oxford University Press, Oxford, p 143−169 Cohen JE (1989) Ecologist Co-Operative Web Bank (ECOWeB). Version 1.0. Machine readable data base of food webs. Rockefeller University, New York, NY Cohen JE, Briand F, Newman CM (1990) Community food webs: data and theory. Springer-Verlag, New York, NY Csardi G, Nepusz T (2006) The igraph software package for complex network research. InterJournal, New England Complex Systems Institute, Cambridge, MA De Angelis DL (1975) Stability and connectance in food web models. Ecology 56:238−243 Dolgov AV (2002) The role of capelin (Mallotus villosus) in the foodweb of the Barents Sea. ICES J Mar Sci 59: 1034−1045 Duarte CM (ed) (2008) Impacts of global warming on polar ecosystems. Fundación BBVA, Madrid Duarte CM, Lenton TM, Wadhams P, Wassmann P (2012a) Abrupt climate change in the Arctic. Nat Clim Change 2: 60−62 Duarte CM, Agustí S, Wassmann P, Arrieta JM and others (2012b) Tipping elements in the Arctic marine ecosystem. Ambio 41:44−55 Dunne JA, Williams RJ, Martinez ND (2002a) Network structure and biodiversity loss in food webs: robustness.
(11) de Santana et al.: Topological properties of polar food webs. increases with connectance. Ecol Lett 5:558−567 Dunne JA, Williams RJ, Martinez ND (2002b) Food-web structure and network theory: the role of connectance and size. Proc Natl Acad Sci USA 99:12917−12922 Dunne JA, Williams RJ, Martinez ND (2004) Network structure and robustness of marine food webs. Mar Ecol Prog Ser 273:291−302 Dunne JA, Brose U, Williams RJ, Martinez ND (2005) Modeling food-web dynamics: complexity-stability implications. In: Belgranno A, Scharler U, Dunne JA, Ulanowicz RE (eds) Aquatic food webs: an ecosystem approach. Oxford University Press, Oxford, p 117−129 Estrada E (2007) Food webs robustness to biodiversity loss: the roles of connectance, expansibility and degree distribution. J Theor Biol 244:296−307 Fordyce RE (1989) Origins and evolution of Antarctic marine mammals. Geol Soc Lond Spec Publ 47:269−281 Gasol JM, del Giorgio PD, Duarte CM (1997) Biomass distribution in marine planktonic communities. Limnol Oceanogr 42:1353−1363 Harington CR (2008) The evolution of Arctic marine mammals. Ecol Appl 18(Suppl):S23−S40 Harper-Smith S, Berlow EL, Knapp RA, Williams RJ, Martinez ND (2005) Communicating ecology through food webs: visualizing and quantifying the effects of stocking alpine lakes with trout. In: Ruiter PC, Wolters V, Moore JC (eds) Dynamic food webs: multispecies assemblages, ecosystem development and environmental change. Academic Press, Burlington, MA, p 407−423 Harrington R, Woiwod I, Sparks T (1999) Climate change and trophic interactions. Trends Ecol Evol 14:146−150 Hillebrand H, Cardinale BJ (2004) Consumer effects decline with prey diversity. Ecol Lett 7:192−201 Knorr G, Lohmann G (2003) Southern Ocean origin for the resumption of Atlantic thermohaline circulation during deglaciation. Nature 424:532−536 Kones JK, Soetaert K, van Oevelen D, Owino J (2009) Are network indices robust indicators of food web functioning? A Monte Carlo approach. Ecol Model 220:370−382 Larsen T, Nagoda D, Andersen JR (2001) The Barents ecoregion. A biodiversity assessment. WWF Report, Oslo Link J (2002) Does food web theory work for marine ecosystems? Mar Ecol Prog Ser 230:1−9 Loeng H, Brander K, Carmack E, Denisenko S and others (2005) Marine systems. In: Symon C, Arris L, Heal B (eds) Arctic climate impact assessment. Cambridge University Press, Cambridge, p 453−538 MacArthur R (1955) Fluctuations of animal populations and a measure of community stability. Ecology 36:533−536 Marquet PA, Quiñones R, Abades S, Labra F, Tognelli M, Arim M, Rivadeneira M (2005) Scaling and power-laws in ecological systems. J Exp Biol 208:1749−1769 Martinez ND (1991) Artifacts or attributes? Effects of resolution on the Little Rock Lake food web. Ecol Monogr 61: 367−392 Martinez ND (1993) Effect of scale on food web structure. Science 260:242−243 Martinez ND (1994) Scale-dependent constraints on foodweb structure. Am Nat 144:935−953 Martinez ND, Hawkins BA, Dawah HA, Feifarek BP (1999) Effects of sampling effort on characterization of foodweb structure. Ecology 80:1044−1055 May RM (1973) Qualitative stability in model ecosystems. Ecology 54:638−641. 25. May RM (1986) The search for patterns in the balance of nature: advances and retreats. Ecology 67:1115−1126 McClintock JH, Ducklow W, Fraser W (2008) Ecological responses to climate change on the Antarctic Peninsula. Am Sci 96:302−310 McKay R, Naish T, Carter L, Riesselman C and others (2012) Antarctic and Southern Ocean influences on Late Pliocene global cooling. Proc Natl Acad Sci USA 109: 6423−6428 Montoya JM, Solé RV (2003) Topological properties of food webs: from real data to community assembly models. Oikos 102:614−622 Opitz S (1996) Trophic interactions in Caribbean coral reefs. ICLARM Tech Rep 43. International Center for Living Aquatic Resources Management, Makati City Petchey OL, Beckerman AP, Riede JO, Warren PH (2008) Size, foraging, and food web structure. Proc Natl Acad Sci USA 105:4191−4196 Pimm SL (1982) Food webs. Chapman and Hall, London Pimm SL, Lawton JH, Cohen JE (1991) Food web patterns and their consequences. Nature 350:669−674 Raffaelli D (2005) Tracing perturbation effects in food webs: the potential and limitation of experimental approaches. In: Ruiter PC, Wolters V, Moore JC (eds) Dynamic food webs. Academic Press, London, p 348−353 Raymond B, Marshall M, Nevitt G, Gillies C and others (2011) A Southern Ocean dietary database. Ecology 92: 1188 Root TL, Price JT, Kimberly RH, Schneider SH (2003) Fingerprints of global warming on wild animals and plants. Nature 421:57−60 Schmitz OJ, Hanmback PA, Beckerman PA (2000) Trophic cascades in terrestrial systems: a review of the effects of carnivore removals on plants. Am Nat 155:141−153 Shurin JB, Borer ET, Seabloom EW, Anderson K and others (2002) A cross-ecosystem comparison of the strength of trophic cascades. Ecol Lett 5:785−791 Sowers T, Bender M (1995) Climate records covering the last deglaciation. Science 269:210−214 Stammerjohn S, Massom R, Rind D, Martinson D (2012) Regions of rapid sea ice change: an inter-hemispheric seasonal comparison. Geophys Res Lett 39:L06501 Stiansen JE, Aglen A, Bogstad B, Budgell P and others (2005) Joint PINRO/IMR report on the state of the Barents Sea ecosystem 2005/2006. IMR/PINRO Joint Rep Ser 3/2006. Institute of Marine Research, Bergen, and Polar Research Institute of Marine Fisheries and Oceanography, Murmansk Stouffer DB, Bascompte J (2010) Understanding food-web persistence from local to global scales. Ecol Lett 13: 154−161 Stroeve J, Holland M, Meier W, Scambos T, Serreze M (2007) Arctic sea ice decline: faster than forecast. Geophys Res Lett 34:L09501 Thébault E, Huber V, Loreau M (2007) Cascading extinctions and ecosystem functioning: contrasting effects of diversity depending on food web structure. Oikos 116: 163−173 Turner J, Bindschadler R, Convey P, Prisco GD and others (eds) (2009) Antarctic climate change and the environment. Scientific Committee on Antarctic Research, Cambridge Van der Putten WH, Macel M, Visser ME (2010) Predicting species distribution and abundance responses to climate.
(12) 26. Mar Ecol Prog Ser 474: 15–26, 2013. change: why it is essential to include biotic interactions across trophic levels. Philos Trans R Soc Lond B Biol Sci 365:2025−2034 Vaughan DG, Marshall GJ, Connolley WM, Parkinson C and others (2003) Recent rapid regional climate warming on the Antarctic Peninsula. Clim Change 60:243−274 Walsh JE, Anisimov O, Hagen JOM, Jakobsson T and others (2005) Cryosphere and hydrology. In: Symon C, Arris L, Heal B (eds) Arctic Climate Impacts Assessment, ACIA. Cambridge University Press, Cambridge, p 183–242 Walther GR (2003) Plants in a warmer world. Perspect Plant Ecol Evol Syst 6:169−185 Walther GR (2010) Community and ecosystem responses to. recent climate change. Philos Trans R Soc Lond B Biol Sci 365:2019−2024 Wassmann P, Duarte CM, Agustí S, Sejr MK (2011) Footprints of climate change in the Arctic marine ecosystem. Glob Change Biol 17:1235−1249 Williams RJ, Martinez ND (2000) Simple rules yield complex food webs. Nature 404:180−183 Williams RJ, Martinez ND (2004) Limits to trophic levels and omnivory in complex food webs: theory and data. Am Nat 163:458−468 Zachos J, Pagani M, Sloan L, Thomas E, Billups K (2001) Trends, rhythms, and aberrations in global climate 65 Ma to present. Science 292:686−693. Editorial responsibility: John Piatt, Anchorage, Alaska, USA. Submitted: January 20, 2012; Accepted: September 24, 2012 Proofs received from author(s): January 19, 2013.
(13)
Figure
Documento similar
S9 Contribution of the different terms in Equation 8 to the climatological biases of TAS (in ◦ C, top) and PR (in percentage of normals, bottom) of the WRF-C model. The gray
This booklet includes top tips for those who experience a mental health condition to help improve their quality of life and think about their sense of belonging and place in
The position of the ostracod species within the morphospace allows the computation and comparison of the morphological disparity in different groups, as well as their
To check for relationships between the response variables y-intercept of NAS (food web capacity) and slope of NAS (food web efficiency) and the potential
1) to describe the food webs using carbon and ni- trogen stable isotopes, with emphasis on tempo- ral and habitat variations in the diet of P. clarkii occupies the same trophic
Observed number of species was relatively high in comparison with other studies in the Mediterranean, and we found no effects of fragment characteristics on species density,
% in terms not only of anatase support properties but also by the degree of (geometrical) interaction of the alien species and titania and thus in terms of geometrical
(2.10) One important feature of topology is the bulk-edge correspondence. When we compute non-trivial invariants in the bulk of a Hamiltonian, the open system will have zero energy
