CO2 driven compromises to marine life along the Chilean coast
24
0
0
Texto completo
(2) 5. Discussion Paper |. 25. The evolution of the concentrations of atmospheric CO2 and O2 over the history of the Earth has played a crucial role in the evolution of life (Dudley, 1998; Berner, 2002). After 800 000 years of relative stability in atmospheric concentration, anthropogenic emissions have driven atmospheric CO2 to reach 385 ppmv, well above the range of atmospheric CO2 of 172–300 ppmv observed over the 800 000 years preceding industrial. |. 8896. Discussion Paper. 1 Introduction. BGD 7, 8895–8918, 2010. CO2 -driven compromises to marine life E. Mayol et al.. Title Page Abstract. Introduction. Conclusions. References. Tables. Figures. J. I. J. I. Back. Close. |. 20. Discussion Paper. 15. |. 10. CO2 -driven compromises to marine life were examined along the Chilean sector of the Humboldt Current System, a particularly vulnerable hypoxic and upwelling area, pO applying the Respiration index (RI = log10 pCO2 ) and the pH-dependent aragonite sat2 uration (Ω) to delineate the water masses where aerobic and calcifying organisms are stressed. There was a remarkable negative relationship between oxygen concentration and pH or pCO2 in the studied area, with the subsurface hypoxic Equatorial Subsurface Waters extending from 100 m to about 300 m depth and supporting elevated pCO2 values. The RI reached a minimum at about 200 m depth and decreased towards the Equator. Increased pCO2 in the hypoxic water layer reduced the RI values by as much as 0.59 RI units, with the upper water layer that presents conditions suitable for aerobic ◦ ◦ life (RI>0.7) declining by half between 42 S and 28 S. The intermediate waters hardly reached those stations closer to the equator so that the increased pCO2 lowered pH and the saturation of aragonite. A significant fraction of the water column along the Chilean sector of the Humboldt Current System suffers from CO2 –driven compromises to biota, including waters corrosive to calcifying organisms, stress to aerobic organisms or both. The habitat free of CO2 -driven stresses was restricted to the upper mixed layer and to small water parcels at about 1000 m depth. pCO2 acts as a hinge connecting respiratory and calcification challenges expected to increase in the future, resulting in a spread of the challenges to aerobic organisms.. Discussion Paper. Abstract. Full Screen / Esc. Printer-friendly Version Interactive Discussion.
(3) 8897. |. Discussion Paper | Discussion Paper. 25. BGD 7, 8895–8918, 2010. CO2 -driven compromises to marine life E. Mayol et al.. Title Page Abstract. Introduction. Conclusions. References. Tables. Figures. J. I. J. I. Back. Close. |. 20. Discussion Paper. 15. |. 10. Discussion Paper. 5. development (Lüthi et al., 2008), with a dramatic impact in the Earth’s climate (Meehl et al., 2007). −1 Oceans have absorbed almost 50% of the 7 Gt C yr released by anthropogenic activities (Sabine et al., 2004), and its surface waters now hold approximately 45 µmol kg−1 of CO2 in excess compared to preindustrial concentrations (Broecker et al., 1985). Increased CO2 in ocean waters has already lead to a decline of 0.1 units in ocean pH, and will decrease by an additional 0.3 pH units by the end of the century, with a large impact on marine calcifying organisms (Orr et al., 2005; Doney et al., 2009). The thresholds of ocean acidification to marine calcifying organisms are given by the aragonite and calcite saturation values, Ω (Feely et al., 2004; Orr et al., 2005), with aragonite saturation being more sensitive to ocean acidification than that for calcite. Indeed, calcification processes are already affected at aragonite Ω values <2 (Hauri et al., 2009; Hendriks et al., 2010), although these thresholds are species-specific. Ocean acidification has received considerable attention as the main direct impact of increased ocean CO2 , but other potential impacts of increased CO2 have been overlooked. Indeed increased CO2 and lowered pH also affect respiratory processes by driving reduced binding affinity for oxygen in blood (Pörtner et al., 2004) and a direct ventilatory sensitivity to CO2 (Burleson and Smatresk, 2000; McKendry et al., 2001). Hence, increased CO2 also poses challenges to aerobic respiration, threatening marine life, an impact that has only recently been addressed (Brewer and Peltzer, 2009). Indeed, the efficiency of aerobic respiratory processes depends on the partial pressures of both CO2 and O2 , which are tightly coupled through the metabolic activity of marine organisms. Brewer and Peltzer (2009) indicated that the efficiency of aerobic respiratory processes is dependent on the ratio of the partial pressures of O2 and CO2 , which defines the range of conditions compatible with aerobic marine life. Hence, present concerns on the threat posed by on-going declines of marine oxygen in the ocean (Dı́az and Rosenberg, 2008; Vaquer-Sunyer and Duarte, 2008; Gilbert et al., 2010) are further aggravated by the parallel increase in CO2 (Brewer and Peltzer, 2009). Yet, the impacts of hypoxia on marine biota have been traditionally studied in. Full Screen / Esc. Printer-friendly Version Interactive Discussion.
(4) 5. | Discussion Paper |. 8898. Discussion Paper. where RI≤0 corresponds to the thermodynamic aerobic limit, a formal dead zone; at RI = 0 to 0.4 aerobic respiration does not occur; the range RI = 0.4 to 0.7 represents the practical limit for aerobic respiration, and the range RI = 0.7 to 1.0 delimits the aerobic stress zone. Thus, increased CO2 aggravates the impacts of hypoxia (Brewer and Peltzer, 2009). Hence, elevated CO2 acts as a hinge, connecting two otherwise independent threats to marine life, acidification and hypoxia. This connection had not been elaborated to date. The areas of the world ocean most sensitive to both these threats are upwelling regions, as they are typically low in oxygen (Grantham et al., 2004) and corrosive to carbonate structures due to high CO2 levels (Feely et al., 2008). A particularly vulnerable area is the Humboldt Current System along the Chilean coast, the largest naturally hypoxic area and an important upwelling center (Thiel et al., 2007; Ulloa and Pantoja, 2009). Here we examine the CO2 -driven compromises to marine life along part of the Chilean sector of the Humboldt Current System, an area sensitive to hypoxia and acidification associated to latitudinal variation of CO2 , O2 and pH across the water column. We demonstrate how RI and Ω can be used to delineate the water masses where aerobic and calcifying organisms are stressed.. BGD 7, 8895–8918, 2010. CO2 -driven compromises to marine life E. Mayol et al.. Title Page Abstract. Introduction. Conclusions. References. Tables. Figures. J. I. J. I. Back. Close. |. 20. (1). pCO2. Discussion Paper. 15. pO2. |. 10. RI = log10. Discussion Paper. isolation from the effects of increased CO2 . Brewer and Peltzer (2009) highlight the importance of studying the coupled effects of changes in both CO2 and O2 on aerobic marine life, and used the basic oxic respiration equation in relation to free-energy to derive a Respiration Index (RI), given by the expression:. Full Screen / Esc. Printer-friendly Version Interactive Discussion.
(5) 2.1 Study site. 5. |. 8899. Discussion Paper. The partial pressure of CO2 in the water (pCO2 ) was measured using a non dispersive infrared gas analyzer (EGM-4, PP systems) that measures pCO2 with a precision of ± 1 ppm. For pCO2 , near surface water (about 1 m depth) was collected and passed through a gas exchange column (Mini-Module Membrane Contactor) and pCO2. |. 2.3 CO2 measurement. Discussion Paper. 20. A series of 15 stations spaced along the meridional cruise track were sampled. Hydrographic properties were profiled down to 1400 m depth using a Seabird 9 CTD probe. Water samples were collected at different depths (5, 15, 30, 50, 100, 200, 300, 600, 1000, 1400 m) using 12 L Niskin bottles fitted on a Rosette sampler system. Water samples were analyzed for pCO2 , O2 , and pH immediately after sampling.. BGD 7, 8895–8918, 2010. CO2 -driven compromises to marine life E. Mayol et al.. Title Page Abstract. Introduction. Conclusions. References. Tables. Figures. J. I. J. I. Back. Close. |. 15. Discussion Paper. 2.2 Sampling. |. 10. The study was conducted along the Humboldt 2009 cruise on board the R/V Hespérides from 5 to 16 March 2009. The cruise track followed the Chilean coast, start◦ ing in the Patagonia channels (54.9 S) proceeding North along the Humboldt Current ◦ System until Antofagasta (Chile, 23.6 S, Fig. 1). The Humboldt Current System is one of the largest naturally hypoxic areas of the world’s oceans (Levin, 2002; Thiel et al., 2007; Ulloa and Pantoja, 2009), characterized by upwelling of cold, oxygen-poor waters supersaturated in CO2 (Torres et al., 2002). The top 200 m are oxygen-saturated, with surface Tropical waters encountering and mixing with near-surface Subantarctic waters. Below these we find oxygen depleted Equatorial waters propagating poleward overlying the oxygen-rich Antarctic waters flowing toward the equator (Silva et al., 2009).. Discussion Paper. 2 Materials and methods. Full Screen / Esc. Printer-friendly Version Interactive Discussion.
(6) 2.4 O2 measurement. 5. 10. Discussion Paper |. 20. 3.1 Description of water masses and its associated pCO2 , O2 and pH levels The ship’s meridional transect encompassed waters of equatorial and Antarctic origin, displaying substantial changes in pCO2 and O2 . The surface waters, down to 100– 150 m, correspond to Subtropical and a Subantarctic water masses (STW and SAAW,. |. 8900. Discussion Paper. 3 Results. BGD 7, 8895–8918, 2010. CO2 -driven compromises to marine life E. Mayol et al.. Title Page Abstract. Introduction. Conclusions. References. Tables. Figures. J. I. J. I. Back. Close. |. 15. Seawater samples for pH, collected immediately after the Niskin bottles were sampled for oxygen determinations, were siphoned into 500 mL glass bottles, allowed to ◦ overflow and immediately stopped. After temperature stabilization to 25 C on a water bath, pH samples where transferred carefully to 10 cm pathlength optical glass cells ◦ fitted with a jacket to circulate water at 25 C, to control temperature during measurements using a double-wavelength spectrophotometric procedure (Clayton and Byrne, 1993). Oxygen concentrations were converted into pO2 and RI were calculated following Brewer and Peltzer (2009). Ω values for aragonite saturation were calculated from pH, pressure, temperature, salinity and alkalinity using CO2 SYS (Pierrot et al., 2006). Because the pH-pCO2 paired couple is not a good predictor of alkalinity, total alkalinity was obtained from the CDIAC data base (Lamb et al., 2001).. Discussion Paper. 2.5 pH and aragonite saturation (Ω) measurement. |. Oxygen concentration was analysed using high-precision Winkler titration using a potentiometric electrode and automated endpoint detection (Mettler Toledo, DL28 titrator) (Carpenter, 1965).. Discussion Paper. measured, details of this methodology have been described elsewhere (Calleja et al., 2005; Silva et al., 2008).. Full Screen / Esc. Printer-friendly Version Interactive Discussion.
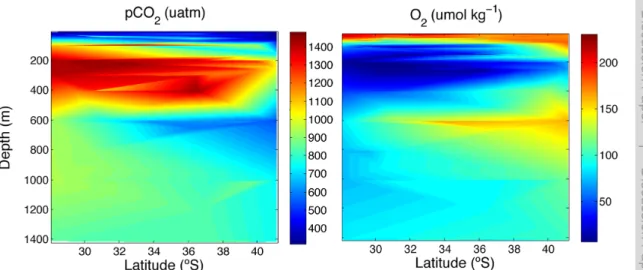
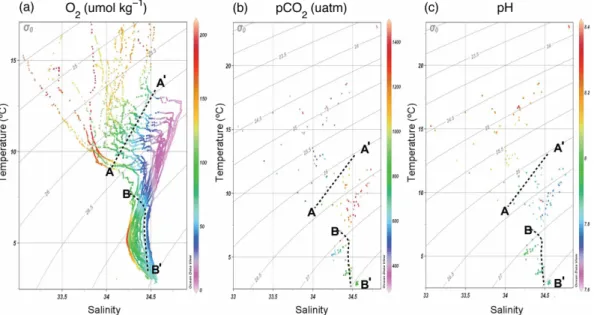
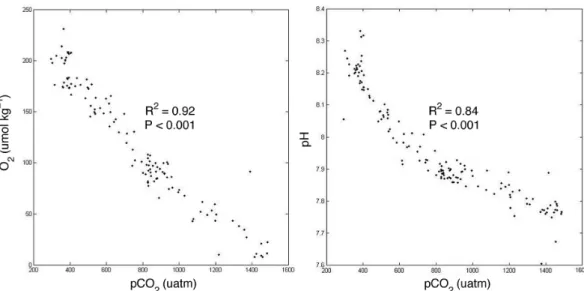
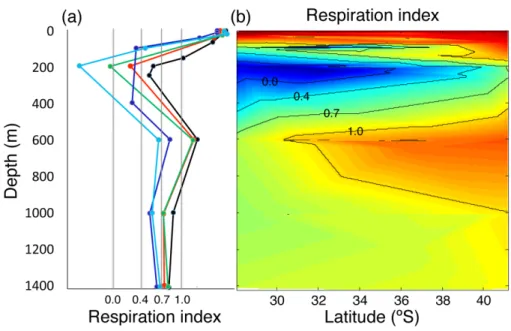
(7) | Discussion Paper. 25. |. The respiration index, which describes the adequacy of the gaseous composition of the water to maintain aerobic life, reached a minimum at about 200 m depth, with the minimum RI values generally decreasing towards the Equator (Fig. 5). The minimum RI values were below the 0.7 threshold value across most of the study area (Fig. 5). Evaluation of the bearing of pCO2 on RI, holding pCO2 constant at atmospheric equilibrium (Fig. 6a), and calculating the difference between the observed RI and that calculated (Fig. 6b) shows that increased pCO2 in the hypoxic water layer increases the thickness of the water column with RI values below the 0.7 threshold and reduces the RI values by as much as 0.59 RI units at the oxygen minimum zone. Indeed, the thickness of 8901. Discussion Paper. 20. BGD 7, 8895–8918, 2010. CO2 -driven compromises to marine life E. Mayol et al.. Title Page Abstract. Introduction. Conclusions. References. Tables. Figures. J. I. J. I. Back. Close. |. 3.2 Respiration index and threatened aerobic life. Discussion Paper. 15. |. 10. Discussion Paper. 5. respectively), they were characterized by pCO2 and O2 concentrations close to atmospheric equilibrium (Fig. 2). Immediately below there were hypoxic Equatorial Subsurface Waters (ESSW), its thickness increasing towards the Equator, where it extended from 100 m to about 300 m depth (Fig. 2). Below this layer and down to about 1000 m we found Antarctic Intermediate waters (AAIW), characterized by much higher oxygen concentrations (Fig. 2). The hypoxic ESSW were also characterized by elevated pCO2 values (>1000 µatm pCO2 , Fig. 2), while the AAIW were characterized by comparatively low pCO2 (Fig. 2). Further below we find the moderately oxygen-depleted Pacific Deep Waters (PDW). We also present three temperature-salinity diagrams with colour-coded values of the oxygen concentration (Fig. 3a), pCO2 (Fig. 3b), and pH (Fig. 3c). The oxygen-coded diagram shows interleaving between oxygen-rich AAIW and ESSW, with the latter overlaying the former (Fig. 3a). The STW and SAAW surface waters have relatively large oxygen concentrations, with maximum values corresponding to the high-latitude relatively cold SAAW (Fig. 3a). The oxygen depleted equatorial subsurface waters were also characterized by elevated pCO2 (>1000 µatm pCO2 ; Fig. 3b) and acidic (pH<8.0) waters (Fig. 3c). Indeed, there was a strong negative relationship between oxygen concentration and pH and pCO2 values in the studied area (Fig. 4).. Full Screen / Esc. Printer-friendly Version Interactive Discussion.
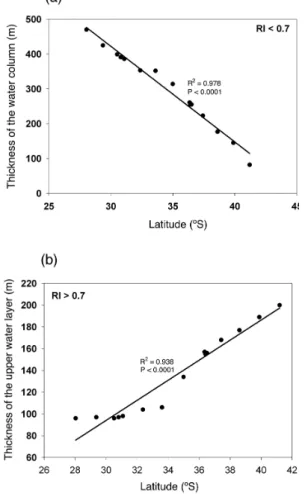
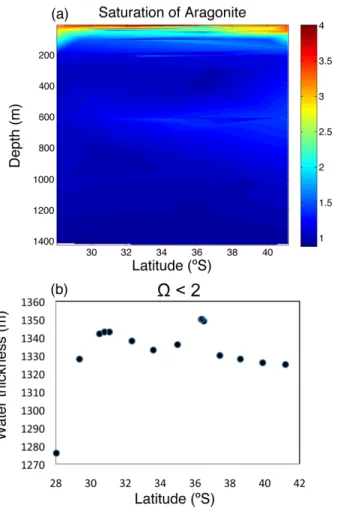
(8) Discussion Paper. 5. the water column with RI values below the 0.7 threshold increases greatly towards the Equator, encompassing 1/3 of the studied water column at 28◦ S (Fig. 7a). It is important to emphasize that the pattern described also involves a reduction toward the Equator in the thickness of the upper water layer that presents conditions suitable for ◦ ◦ aerobic life (RI>0.7), declining by half between 42 S and 28 S (Fig. 7b). 3.3 pH and saturation of aragonite levels as a threat to calcification processes. | | Discussion Paper. 25. |. The results demonstrate that the bulk of the water column (0–1400 m) along the Chilean sector of the Humboldt Current System present values of acidity or RI compromising for biota, associated with the subsurface hypoxic Equatorial waters that flow South. These compromises are particularly acute regarding the capacity to support aerobic organisms, as oxygen concentrations declined and approached closer to the water surface (O2 concentrations <8 µmol kg−1 at 100 m depth in 30.51◦ S) towards the north of the study area. pCO2 levels were also very high (up to 1460 ppm) in association with the hypoxic layer. The distribution of water masses, in particular the oxygen minimum zone, along the study area followed those previously reported (Fuenzalida et al., 2009; Silva et al., 2009). The additional stress to biota in the hypoxic water mass of the Humboldt Current System arising from the high pCO2 levels has not been discussed earlier. Our results 8902. Discussion Paper. 20. 4 Discussion. 7, 8895–8918, 2010. CO2 -driven compromises to marine life E. Mayol et al.. Title Page Abstract. Introduction. Conclusions. References. Tables. Figures. J. I. J. I. Back. Close. |. 15. Discussion Paper. 10. In addition to reducing the RI values, the increased pCO2 in intermediate waters also lowers pH and, therefore, the saturation limit for aragonite (Fig. 8a). The thickness of the water column whose aragonite saturation levels may compromise calcification processes (Ω < 2) corresponds to 1325 m of the studied water column, declining by 50 m from 42◦ S to 28◦ S (Fig. 8b). This pattern is opposite to that observed in RI due to the increase in pCO2 in the oxygen minimum zone toward the Equator, and the parallel warming of the waters that result in increased saturation levels, by as much as 50% ◦ across the 3 C meridional gradient encompassed by surface waters.. BGD. Full Screen / Esc. Printer-friendly Version Interactive Discussion.
(9) 8903. |. Discussion Paper | Discussion Paper. 25. BGD 7, 8895–8918, 2010. CO2 -driven compromises to marine life E. Mayol et al.. Title Page Abstract. Introduction. Conclusions. References. Tables. Figures. J. I. J. I. Back. Close. |. 20. Discussion Paper. 15. |. 10. Discussion Paper. 5. show that a significant fraction of the water column along the Chilean sector of the Humboldt Current System suffers from CO2 –driven compromises to biota, including corrosive waters to calcifying organisms, stress to aerobic organisms or both. Only the surface layer shallower than 100 m presents conditions free of stress to aerobic organisms (Fig. 9). The extent of challenges to aerobic organisms, as indicated by the RI values, is highly increased by consideration of the increased pCO2 levels, which lowered the RI value by up to 0.59 RI units and increased the thickness of the water column with RI values indicative of compromises to aerobic organisms (RI<0.7). Hence, our results concur with those of Brewer and Peltzer (2009) to suggest that increased pCO2 levels aggravate the challenges to aerobic organisms in oxygen deficient waters, such as those in the Humboldt Current System. Whereas our study represents a quasi-synoptic assessment of the extent of challenges derived from pCO2 , and associated pH levels, and O2 in the water column of the Humboldt Current System, these are expected to be highly dynamic. The oxygen minimum of the Humboldt Current System shows seasonal and interannual variability, possibly driven by upwelling events and large-scale perturbations in regional circulation, such as those accompanying El Niño events. The oxygen content in the top 100 m layer is higher in the region during El Niño events (Morales et al., 1999; Ulloa et al., 2001). In addition to seasonal and interannual oscillations, the CO2 -driven challenges to biota reported here are expected to increase in the future. Atmospheric pCO2 levels are expected to reach 700 to 1000 ppm by the end of the 21st Century (Meehl et al., 2007), with an increase in pCO2 at depth more than 1000 µatm in the Pacific (Brewer and Peltzer, 2009), resulting in a spread of the respiratory challenges to aerobic organisms. The corresponding pH levels are expected to continue to decline, being reduced by 0.3 units below present values by the end of the 21st Century and by up to 0.7 units by 2300 (Caldeira and Wickett, 2003; Doney et al., 2009). In addition, oxygen concentrations are declining across the ocean (Stramma et al., 2008; Gilbert et al., 2010), further affecting the RI ratio.. Full Screen / Esc. Printer-friendly Version Interactive Discussion.
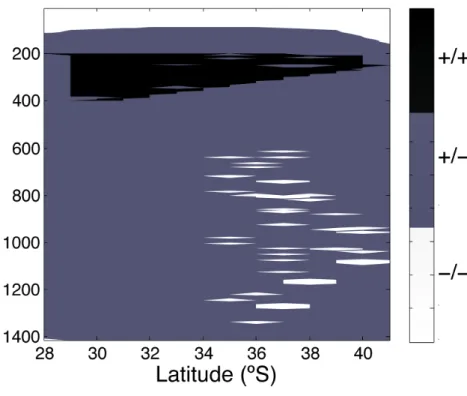
(10) 8904. |. Discussion Paper | Discussion Paper. 25. BGD 7, 8895–8918, 2010. CO2 -driven compromises to marine life E. Mayol et al.. Title Page Abstract. Introduction. Conclusions. References. Tables. Figures. J. I. J. I. Back. Close. |. 20. Discussion Paper. 15. |. 10. Discussion Paper. 5. The area where biocalcification processes may be close to being compromised can be delineated from the water column with saturation levels, Ω for aragonite <2 (cf. Orr et al., 2005; Yates and Halley, 2006; Guinotte and Fabry, 2008; Hauri et al., 2009, Hendriks et al., 2010), which encompasses most of the water column, except for the upper layer (above 70 m). The thickness of the water column where biocalcification processes may be impacted is largest at mid-latitudes (between about 30 and 37◦ S) and decreases slowly towards high latitudes and rapidly towards the Equator. This swift change in the equatorial region is opposite to what happens to the layer where aerobic respiration is compromised. Whereas both parameters, reduced RI and aragonite saturation levels, are driven by pCO2 , each includes a second, independent, driver: oxygen concentration in the case of aerobic respiration and temperature in the case of biocalcification. pCO2 acts, therefore, as a hinge connecting respiratory and calcification challenges. In general, ocean acidification affects mostly waters below 200 m, while respiratory compromises are located within the 200 to 400 m layer (Fig. 9). These two challenges show similar trends at mid and high latitudes but have opposite trends within the equatorial water column. In general, the 200 to 400 m depth layer combines these two stresses, with the thickness of the layer affected simultaneously by both stresses increasing from high to mid-latitudes and decreasing towards the Equator (Fig. 9). The habitat free of CO2 -driven stresses was restricted to the upper mixed layer and to small water parcels at about 1000 m depth (Fig. 9). Increased pCO2 in the future may further compress this stress-free habitat. In addition, both the aragonite saturation threshold for biocalcification and the threshold RI affecting respiration probably vary across taxa (cf. Hendriks et al., 2010 and Vaquer-Sunyer and Duarte, 2008, respectively), depending on their metabolic capacities. Indeed, whereas most metazoans are excluded from the oxygen minimum zone of the Humboldt Current System, specialized crustacean communities, including copepods and euphasids, have been reported to enter this hypoxic layer (Escribano et al., 2009). Use of the RI value as a predictive tool to evaluate and project the impact of. Full Screen / Esc. Printer-friendly Version Interactive Discussion.
(11) Discussion Paper | Discussion Paper |. 8905. BGD 7, 8895–8918, 2010. CO2 -driven compromises to marine life E. Mayol et al.. Title Page Abstract. Introduction. Conclusions. References. Tables. Figures. J. I. J. I. Back. Close. |. 20. In this study we present the risk for aerobic and calcifying marine organisms associated to high pCO2 and low O2 levels. The study was centered in an area naturally low in oxygen and with high pCO2 levels, potentially corrosive to carbonate structures. Therefore, this study can be used as a predictive model of the future situation that oceans are likely to exhibit, when considering the expected trends in the evolution of both O2 and pCO2 levels. Relating pCO2 and O2 values by means of the respiration index is key in understanding the dimension of the threat that aerobic organisms are faced with. As well as this respiratory threat, it is also necessary to take into account the stress inflicted upon calcifying processes, associated to increased pCO2 levels resulting in decreased pH levels and low saturation levels Ω for aragonite, where calcification may be compromised. The RI and saturation state of aragonite was used in this work as a predictive tool to evaluate and project the impact of increased pCO2 on aerobic and calcifying organisms, showing that the habitat free of CO2 -driven stresses was restricted to the upper mixed layer and to small water parcels at about 1000 m depth.. Discussion Paper. 15. 5 Conclusions. |. 10. Discussion Paper. 5. increased pCO2 on aerobic organisms in this region requires, therefore, experimental evidence of the RI thresholds for aerobic respiration of the main taxa in the ecosystem. This evidence is urgently needed, as our assessment clearly shows that increased pCO2 progressively compresses the water column available for aerobic organisms and may become a factor limiting fisheries production in the region. This upwelling region supports one of the most important fisheries in the world (Montecino and Lange, 2009) and the increase in these stress zones, as those observed in the past (Ulloa and Pantoja, 2009), may compress the habitat suitable for important commercial species, driving changes in the ecosystem in a high-CO2 future.. Full Screen / Esc. Printer-friendly Version Interactive Discussion.
(12) Discussion Paper. 5. Acknowledgements. This is a contribution to the Humboldt-2009 project, funded by the Spanish Ministry of Science and Innovation (ref. CTM2009-02497-E/MA) and was also supported by funding from the LINCGlobal (PUC-CSIC). We thank the cruise participants, UTM technicians, crew and commander of R/V Hespérides for help during the cruise. We thank E. T. Peltzer, F. Millero and P. Llanillo for assistance with calculations. E. M. was supported by a JAE fellowship from CSIC.. |. 10. |. 8906. Discussion Paper. 30. |. 25. Discussion Paper. 20. 7, 8895–8918, 2010. CO2 -driven compromises to marine life E. Mayol et al.. Title Page Abstract. Introduction. Conclusions. References. Tables. Figures. J. I. J. I. Back. Close. |. 15. Berner, R. A.: Examination of hypotheses for the Permo-Triassic boundary extinction by carbon cycle modeling, P. Natl. Acad. Sci. USA, 99, 4172–4177, 2002. Brewer, P. G. and Peltzer, E. T.: Limits to marine life, Science, 321, 347–348, 2009. Broecker, W. S., Takahashi, T., and Peng, T.-H.: Reconstruction of the past atmospheric CO2 contents of the contemporary ocean: an evaluation, Technical Report, 1985. Burleson, M. L. and Smatresk, N. J.: Branchial chemoreceptors mediate ventilatory response to hypercapnic acidosis in channel catfish, Comp. Biochem. Physiol., 125, 403–414, 2000. Caldeira, K. and Wickett, M. E.: Anthropogenic carbon and ocean pH, Nature, 425, 365, 2003. Calleja, M. L., Duarte, C. M., Navarro, N., and Agustı́, S.: Control of air-sea CO2 disequilibria in the subtropical NE Atlantic by planktonic metabolism under the ocean skin, Geophys. Res. Lett., 32, L08606, doi:10.1029/2004GL022120, 2005. Carpenter, J. H.: The accuracy of the Winkler method for dissolved oxygen analysis, Limnol. Oceanogr., 10, 135–140, 1965. Clayton, T. D. and Byrne, R. H.: Spectrophotometric seawater pH measurements: total hydrogen ion concentration scale calibration of m-cresol purple and at-sea results, Deep-Sea Res. Pt. I., 40, 2115–2129, 1993. Diaz, R. J. and Rosenberg, R.: Spreading dead zones and consequences for marine ecosystems, Science, 321, 926–929, 2008. Doney, S. C., Fabry, V. J., Feely, R. A., and Kleypas, J. A.: Ocean acidification: the other CO2 problem, Annual Review of Marine Science, 1, 169–192, 2009. Dudley, R.: Atmospheric oxygen, giant paleozoic insects and the evolution of aerial locomotor performance, J. Exp. Biol., 201, 1043–1050, 1998. Escribano, R., Hidalgo, P., and Krautz, C.: Zooplankton associated with the oxygen minimum. Discussion Paper. References. BGD. Full Screen / Esc. Printer-friendly Version Interactive Discussion.
(13) 8907. |. | Discussion Paper. 30. Discussion Paper. 25. BGD 7, 8895–8918, 2010. CO2 -driven compromises to marine life E. Mayol et al.. Title Page Abstract. Introduction. Conclusions. References. Tables. Figures. J. I. J. I. Back. Close. |. 20. Discussion Paper. 15. |. 10. Discussion Paper. 5. zone system in the northern upwelling region of Chile during march 2000, Deep-Sea Res. Pt. II, 56, 1083–1094, 2009. Feely, R. A., Sabine, C. L., Lee, K., Berelson, W., Kleypas, J., Fabry, V. J., and Millero, F. J.: Impact of anthropogenic CO2 on the CaCO3 system in the oceans, Science, 305, 362–366, 2004. Feely, R. A., Sabine, C. L., Hernandez-Ayon, J. M., Ianson, D., and Hales, B.: Evidence for upwelling of corrosive “acidified” water onto the continental shelf, Science, 320, 1490–1492, 2008. Fuenzalida, R., Schneider, W., Garcés-Vargas, J., Bravo, L., and Lange, C.: Vertical and horizontal extension of the oxygen minimum zone in the eastern South Pacific Ocean, Deep-Sea Res. Pt. II, 56, 992–1003, 2009. Gilbert, D., Rabalais, N. N., Dı́az, R. J., and Zhang, J.: Evidence for greater oxygen decline rates in the coastal ocean than in the open ocean, Biogeosciences, 7, 2283–2296, doi:10.5194/bg-7-2283-2010, 2010. Grantham, B. A., Chan, F., Nielsen, K. J., Fox, D. S., Barth, J. A., Huyer, A., Lubchenco, J., and Menge, B. A.: Upwelling-driven nearshore hypoxia signals ecosystem and oceanographic changes in the northeast Pacific, Nature, 429, 749–754, 2004. Guinotte, J. M. and Fabry, V. J.: Ocean acidification and its potential effects on marine ecosystems, Ann. NY Acad. Sci., 1134, 320–342, 2008. Hauri, C., Gruber, N., Plattner, G.-K., Alin, S., Feely, R. A., Hales, B., and Wheeler, P. A.: Ocean acidification in the California Current System, Oceanography, 22, 58–69, 2009. Hendriks, I. E., Duarte, C. M., and Álvarez, M.: Vulnerability of marine biodiversity to ocean acidification: a meta-analysis, Estuar, Coast. Shelf S., 86, 157–164, 2010. Lamb, M. F., Sabine, C. L., Feely, R. A., Wanninkhof, R., Key, R. M., Johnson, G. C., Millero, F. J., Lee, K., Peng, T.-H., Kozyr, A., Bullister, J. L., Greeley, D., Byrne, R. H., Chipman, D. W., Dickson, A. G., Goyet, C., Guenther, P. R., Ishii, M., Johnson, K. M., Keeling, C. D., Ono, T., Shitashima, K., Tilbrook, B., Takahashi, T., Wallace, D. W. R., Watanabe, Y. W., Winn, C., and Wong, C. S.: Consistency and synthesis of Pacific Ocean CO2 survey data, Deep Sea Res. Pt. II, 49, 21–58, 2001. Levin, L. A.: Deep-ocean life where oxygen is scarse, Am. Sci., 90, 436–444, 2002. Lüthi, D., Le Floch, M., Bereiter, B., Blunier, T., Barnola, J. M., Siegenthaler, U., Raynaud, D., Jouzel, J., Fischer, H., Kawamura, K., and Stocker, T. F.: High-resolution carbon dioxide concentration record 650,000–800,000 years before present, Nature, 453, 379–382, 2008.. Full Screen / Esc. Printer-friendly Version Interactive Discussion.
(14) 8908. |. | Discussion Paper. 30. Discussion Paper. 25. BGD 7, 8895–8918, 2010. CO2 -driven compromises to marine life E. Mayol et al.. Title Page Abstract. Introduction. Conclusions. References. Tables. Figures. J. I. J. I. Back. Close. |. 20. Discussion Paper. 15. |. 10. Discussion Paper. 5. McKendry, J. E., Milsom, W. K., and Perry, S. F.: Branchial CO2 receptors and cardiorespiratory adjustments during hypercarbia in Pacific spiny dogfish (Squalus acanthias), J. Exp. Biol., 204, 1519–1527, 2001. Meehl, G. A., Stocker, T. F., Collins, W. D., Friedlingstein, P., Gaye, A. T., Gregory, J. M., Kitoh, A., Knutti, R., Murphy, J. M., Noda, A., Raper, S. C. B., Watterson, I. G., Weaver, A. J., and Zhao, Z.-C.: Global climate projections, in: climate change 2007: the physical science basis. Contribution of working group I to the fourth assessment report of the intergovernmental panel on climate change, eduted by: Solomon, S., Qin, D., Manning, M., Chen, Z., Marquis, M., Averyt, K. B., Tignor, M., and Miller, H. L., Cambridge University Press, Cambridge, United Kingdom and New York, NY, USA, 2007. Montecino, V. and Lange, C. B.: The Humboldt Current System: Ecosystem components and processes, fisheries, and sediment studies, Prog. Oceanogr., 83, 65–79, 2009. Morales, C. E., Hormazábal, S. E., and Blanco, J. L.: Interannual variability in the mesoscale distribution of the depth of the upper boundary of the oxygen minimum layer off northern Chile (18-24S): implications for the pelagic system and biogeochemical cycling, J. Mar. Res., 57, 909–932, 1999. Orr, J. C., Fabry, V. J., Aumont, O., Bopp, L., Doney, S. C., Feely, R. A., Gnanadesikan, A., Gruber, N., Ishida, A., Joos, F., Key, R. M., Lindsay, K., Maier-Reimer, E., Matear, R., Monfray, P., Mouchet, A., Najjar, R. G., Plattner, G.-K., Rodgers, K. B., Sabine, C. L., Sarmiento, J. L., Schlitzer, R., Slater, R. D., Totterdell, I. J., Weirig, M.-F., Yamanaka, Y., and Yool, A.: Anthropogenic ocean acidification over the twenty-first century and its impact on calcifying organisms, Nature, 437, 681–686, 2005. Pierrot, D., Lewis, E., and Wallace, D. W. R.: MS Excel program developed for CO2 system calculations. ORNL/CDIAC-105A. Carbon dioxide information analysis center, Oak Ridge National Laboratory, U.S., Department of Energy, Oak Ridge, Tennessee, 2006. Pörtner, H. O., Langenbuch, M., and Reipschläger, A.: Biological impact of elevated ocean CO2 concentrations: lessons from animal physiology and Earth history, J. Oceanogr., 60, 705–718, 2004. Sabine, C. L., Feely, R. A., Gruber, N., Key, R. M., Lee, K., Bullister, J. L., Wanninkhof, R., Wong, C. S., Wallace, D. W. R., Tilbrook, B., Millero, F. J., Peng, T.-H., Kozyr, A., Ono, T., and Rios, A. F.: The oceanic sink for anthropogenic CO2 , Science, 305, 367-371, 2004. Silva, J., Feijóo, P., and Santos, R.: Underwater measurements of carbon dioxide evolution in marine plant communities: a new method, Estuar, Coast. Shelf S., 78, 827–830, 2008.. Full Screen / Esc. Printer-friendly Version Interactive Discussion.
(15) | Discussion Paper |. 8909. Discussion Paper. 25. BGD 7, 8895–8918, 2010. CO2 -driven compromises to marine life E. Mayol et al.. Title Page Abstract. Introduction. Conclusions. References. Tables. Figures. J. I. J. I. Back. Close. |. 20. Discussion Paper. 15. |. 10. Discussion Paper. 5. Silva, N., Rojas, N., and Fedele, A.: Water masses in The Humboldt Current System: properties, distribution, and the nitrate deficit as a chemical water mass tracer for Equatorial Subsurface Water off Chile, Deep-Sea Res. Pt. II, 56, 1004–1020, 2009. Stramma, L., Johnson, G. C., Sprintall, J., and Mohrholz, V.: Expanding oxygen-minimum zones in the Tropical Oceans, Science, 320, 655–658, 2008. Thiel, M., Macaya, E. C., Acuna, E., Arntz, W. E., Bastias, H., Brokordt, K., Camus, P. A., Castilla, J. C., Castro, L. R., Cortes, M., Dumont, C. P., Escribano, R., Fernandez, M., Gajardo, J. A., Gaymer, C. F., Gomez, I., Gonzalez, A. E., Gonzalez, H. E., Haye, P. A., Illanes, J.-E., Iriarte, J. L., Lancellotti, D. A., Luna-Jorquera, G., Luxoro, C., Manriquez, P. H., Marin, V., Munoz, P., Navarrete, S. A., Perez, E., Poulin, E., Sellanes, J., Hito Sepulveda, H., Stotz, W., Tala, F., Thomas, A., Vargas, C. A., Vasquez, J. A., and Vega, J. M. A.: The humboldt current system of northern and central Chile: oceanographic processes, ecological interactions and socioeconomic feedback, Oceanogr. Mar. Biol., 45, 195–344, 2007. Torres, R., Turner, D., Rutllant, J., Sobarzo, M., Antezana, T., and Gonzalez, H. E.: CO2 outgassing off central Chile (31-30◦ S) and northern Chile (24-23◦ S) during austral summer 1997: the effect of wind intensity on the upwelling and ventilation of CO2 - rich waters, DeepSea Res. Pt. I, 49, 1413–1429, 2002. Ulloa, O. and Pantoja, S.: The oxygen minimum zone of the eastern South Pacific, Deep-Sea Res. Pt. II, 56, 987–991, 2009. Ulloa, O., Escribano, R., Hormazabal, S., Quiñones, R. A., González, R. R., and Ramos, M.: Evolution and biological effects of the 1997-98 El Niño in the upwelling ecosystem off northern Chile, Geophys. Res. Lett., 28, 1591–1594, 2001. Vaquer-Sunyer, R. and Duarte, C. M.: Thresholds of hipoxia for marine biodiversity, P. Natl. Acad. Sci. USA, 105, 15452–15457, 2008. Yates, K. K. and Halley, R. B.: CO2− 3 concentration and pCO2 thresholds for calcification and dissolution on the Molokai reef flat, Hawaii, Biogeosciences, 3, 357–369, doi:10.5194/bg-3357-2006, 2006.. Full Screen / Esc. Printer-friendly Version Interactive Discussion.
(16) Discussion Paper. BGD 7, 8895–8918, 2010. | Discussion Paper. CO2 -driven compromises to marine life E. Mayol et al.. Title Page Introduction. Conclusions. References. Tables. Figures. J. I. J. I. Back. Close. |. Abstract. Discussion Paper | |. 8910. Discussion Paper. Fig. 1. Cruise track (red line) and sampling stations (blue circles) along the Humboldt Current System (54.9◦ to 23.6◦ S).. Full Screen / Esc. Printer-friendly Version Interactive Discussion.
(17) Discussion Paper. BGD 7, 8895–8918, 2010. | Discussion Paper. CO2 -driven compromises to marine life E. Mayol et al.. Title Page Introduction. Conclusions. References. Tables. Figures. J. I. J. I. Back. Close. |. Abstract. Discussion Paper |. Fig. 2. Contour plots showing the variation in pCO2 and O2 levels along the studied transect.. Discussion Paper |. 8911. Full Screen / Esc. Printer-friendly Version Interactive Discussion.
(18) Discussion Paper. BGD 7, 8895–8918, 2010. | Discussion Paper. CO2 -driven compromises to marine life E. Mayol et al.. Title Page Introduction. Conclusions. References. Tables. Figures. J. I. J. I. Back. Close. |. Abstract. | Discussion Paper |. 8912. Discussion Paper. Fig. 3. Temperature-salinity diagram colour-coded for oxygen (a), pCO2 (b), and pH (c) with potential-density isolines superposed. The dashed lines in (a) illustrate the location of intermediate waters (points denser than defined by line A–A’) and their partitioning between waters of Equatorial origin (points above line B–B’ and lighter than 27.0) and those of Antarctic origin (points to the left of line B–B’). Deep-water points are found to the right of line B–B’ and with densities higher than 27.0. Oxygen values in (a) were derived from the CTD-mounted oxygen sensor calibrated with Winkler analyses from bottle casts, while pCO2 (b) and pH (c) correspond to the values measured from the bottle casts.. Full Screen / Esc. Printer-friendly Version Interactive Discussion.
(19) Discussion Paper. BGD 7, 8895–8918, 2010. | Discussion Paper. CO2 -driven compromises to marine life E. Mayol et al.. Title Page Introduction. Conclusions. References. Tables. Figures. J. I. J. I. Back. Close. |. Abstract. Discussion Paper Discussion Paper |. 8913. |. Fig. 4. Relationship between pCO2 and O2 or pH, showing the R 2 from fitted least squares regression analyses and the P value.. Full Screen / Esc. Printer-friendly Version Interactive Discussion.
(20) Discussion Paper. BGD 7, 8895–8918, 2010. | Discussion Paper. CO2 -driven compromises to marine life E. Mayol et al.. Title Page Introduction. Conclusions. References. Tables. Figures. J. I. J. I. Back. Close. |. Abstract. | Discussion Paper |. 8914. Discussion Paper. Fig. 5. (a) Vertical profile of RI for five representative stations along the meridional transect (black: station 41.2◦ S; red: station 37.4◦ S; green: station 33.6◦ S; blue: station 30.8◦ S and light-blue: station 28.03◦ S). The limits indicated by gray lines correspond to the different thresholds proposed by Brewer and Peltzer (2009): RI≤0 corresponds to the thermodynamic aerobic limit, a formal dead zone; RI = 0 to 0.4 aerobic respiration is not observed; RI = 0.4 to 0.7 practical limit for aerobic respiration and RI = 0.7 to 1.0 aerobic stress zone. (b) Contour plot showing the variability in RI along the studied transect.. Full Screen / Esc. Printer-friendly Version Interactive Discussion.
(21) Discussion Paper. BGD 7, 8895–8918, 2010. | Discussion Paper. CO2 -driven compromises to marine life E. Mayol et al.. Title Page Introduction. Conclusions. References. Tables. Figures. J. I. J. I. Back. Close. |. Abstract. | Discussion Paper |. 8915. Discussion Paper. Fig. 6. Contour plot showing the distribution of (a) the calculated RI assuming a constant pCO2 in atmospheric equilibrium (385 µatm) and (b) the difference between the calculated RI and that observed along the studied transect.. Full Screen / Esc. Printer-friendly Version Interactive Discussion.
(22) Discussion Paper. BGD 7, 8895–8918, 2010. | Discussion Paper. CO2 -driven compromises to marine life E. Mayol et al.. Title Page Introduction. Conclusions. References. Tables. Figures. J. I. J. I. Back. Close. |. Abstract. Discussion Paper | |. 8916. Discussion Paper. Fig. 7. The relationship between the thickness of the water column and latitude for (a) RI< 0.7; P < 0.0001 (down to 1.400 depth) and (b) RI> 0.7; P < 0.0001 (top 200 m of the water column) along the studied transect.. Full Screen / Esc. Printer-friendly Version Interactive Discussion.
(23) Discussion Paper. BGD 7, 8895–8918, 2010. | Discussion Paper. CO2 -driven compromises to marine life E. Mayol et al.. Title Page Introduction. Conclusions. References. Tables. Figures. J. I. J. I. Back. Close. |. Abstract. Discussion Paper | |. 8917. Discussion Paper. Fig. 8. (a) Contour plot showing the distribution of aragonite saturation index (Ω) and (b) the thickness of the water column with Ω < 2 along the studied transect.. Full Screen / Esc. Printer-friendly Version Interactive Discussion.
(24) Discussion Paper. BGD 7, 8895–8918, 2010. | Discussion Paper. CO2 -driven compromises to marine life E. Mayol et al.. Title Page Introduction. Conclusions. References. Tables. Figures. J. I. J. I. Back. Close. |. Abstract. Discussion Paper | |. 8918. Discussion Paper. Fig. 9. Distribution of compromises (aerobic respiration compromised, RI<0.7; biocalcification compromised, Ω <2) to marine life along the studied transect. +/+ = both respiration and biocalcification compromised; +/− = only biocalcification compromised; −/− = no compromises. The missing combination (−/+ = only respiration compromised) was not observed.. Full Screen / Esc. Printer-friendly Version Interactive Discussion.
(25)
Figure
+6

Documento similar
The photometry of the 236 238 objects detected in the reference images was grouped into the reference catalog (Table 3) 5 , which contains the object identifier, the right
In addition to traffic and noise exposure data, the calculation method requires the following inputs: noise costs per day per person exposed to road traffic
As seen previously on subsection 3.3.1 the storms were characterized and classified based on the storm energy content, which was acquired using a combination of wave height
In addition, precise distance determinations to Local Group galaxies enable the calibration of cosmological distance determination methods, such as supernovae,
Cu 1.75 S identified, using X-ray diffraction analysis, products from the pretreatment of the chalcocite mineral with 30 kg/t H 2 SO 4 , 40 kg/t NaCl and 7 days of curing time at
Authors: Pedro Manuel Moreno-Marcos, Dánae Martínez de la Torre, Gabriel González Castro, Pedro J.. Muñoz-Merino and Carlos
MD simulations in this and previous work has allowed us to propose a relation between the nature of the interactions at the interface and the observed properties of nanofluids:
Government policy varies between nations and this guidance sets out the need for balanced decision-making about ways of working, and the ongoing safety considerations
