Understanding apple consumers' expectations in terms of likes and dislikes : use of comment analysis in a cross cultural study
58
0
0
Texto completo
(2) Accepted Manuscript Research report Understanding apple consumers’ expectations in terms of likes and dislikes: use of comment analysis in a cross- cultural study M.V. Galmarini, R. Symoneaux, S. Chollet, M.C. Zamora PII: DOI: Reference:. S0195-6663(12)00449-7 http://dx.doi.org/10.1016/j.appet.2012.11.006 APPET 1693. To appear in:. Appetite. Received Date: Revised Date: Accepted Date:. 25 July 2012 3 November 2012 8 November 2012. Please cite this article as: Galmarini, M.V., Symoneaux, R., Chollet, S., Zamora, M.C., Understanding apple consumers’ expectations in terms of likes and dislikes: use of comment analysis in a cross- cultural study, Appetite (2012), doi: http://dx.doi.org/10.1016/j.appet.2012.11.006. This is a PDF file of an unedited manuscript that has been accepted for publication. As a service to our customers we are providing this early version of the manuscript. The manuscript will undergo copyediting, typesetting, and review of the resulting proof before it is published in its final form. Please note that during the production process errors may be discovered which could affect the content, and all legal disclaimers that apply to the journal pertain..
(3) 1 2 3. Understanding apple consumers’ expectations in terms of likes and. 4. dislikes: use of comment analysis in a cross- cultural study.. 5 6. Galmarini, M.V.1,2 ; Symoneaux, R.3; Chollet, S.4; Zamora, M.C.1,2. 7 8 9. 1. Facultad de Ciencias Agrarias, Pontificia Universidad Católica Argentina,. 10. Cap. Gral. Ramón Freire 183 (CP1429), Ciudad de Buenos Aires,. 11. Argentina.. 12. 2. 13. (CONICET), Buenos Aires, Argentina.. 14. 3. 15. BP30748, 49007 Angers, Cedex 01, France.. 16. 4. Member of Consejo Nacional de Investigaciones Científicas y Técnicas. LUNAM Université, Groupe ESA, UPSP GRAPPE, 55, rue Rabelais,. Groupe ISA, Université Catholique de Lille, France.. 17 18. (*) Corresponding author (Mara V. Galmarini): mgalmarini@gmail.com. 19 20. Not for publication : Tel./Fax (0054)11 4552 2711. 21 22. 1.
(4) 23 24. Abstract. 25. Apple consumers’ expectations in Argentina and France were studied. 26. by comment analysis of open-ended questions. In an on-line survey. 27. consumers stated: attributes which defined quality in an apple; visual,. 28. flavor and texture characteristics they liked/ did not like to find in an apple.. 29. Influence of country, consumption frequency and cultivar knowledge were. 30. analyzed by contingency tables, Chi-square per cell tests and Multiple. 31. Factor Analysis. Consumers’ quality expectations were not the same in. 32. both countries. Argentineans and French consumers agreed that quality. 33. apples should be juicy (most used term in both countries), tasty, firm and. 34. fresh. However, for Argentineans quality was more related to visual. 35. characteristics, whereas for French it was driven by flavor. Argentineans. 36. used more words but French were more specific, particularly for flavour. 37. description. Moreover, frequency of consumption, varieties knowledge and. 38. the number of terms given were highly related. Frequent consumers knew. 39. more varieties and were more prolific in relation to flavour. Less frequent. 40. consumers knew fewer apple varieties and gave more words in the visual. 41. category. The use of comment analysis allowed identifying the terms that. 42. consumers used in their day to day life to describe apples, finding. 43. separately likes and dislikes, in spite of the different languages.. 44 2.
(5) 45 46. Key words: consumer preference, cross-cultural, open-ended question,. 47. MFACT, chi-square per cell.. 3.
(6) 48 49. 1. Introduction Food production in a globalized world is constantly presenting new. 50. challenges. Thanks to the internationalization of markets, fruits and. 51. vegetables are sold far from their region of origin. Also, due to evident. 52. climatic reasons commerce between countries in the southern and northern. 53. hemisphere becomes a need and a tool to fulfill consumption needs all year. 54. round (Rau, 2010). Therefore, breeders need to adapt their products to. 55. consumer populations with differing preference patterns (Jaeger, Andani,. 56. Wakeling & MacFie, 1998) and understanding consumers’ expectations. 57. proves key for production purposes and also for developing detailed. 58. communication strategies (Sijtsema, Zimmermann, Cvetković, Stojanovic,. 59. Spiroski, Milosevic, Mora., Butigan, Mugosa, Esteve, & Pohar, 2012).. 60. Market researches on apple have shown the increasing importance of. 61. quality in the consumer’s mind (Hutin, 2008). However, it could be said. 62. that there are as many different concepts of quality as there are perspectives. 63. in postharvest handling and distribution (Shewfelt, 1999; Opara et al.,. 64. 2007). Literature has also pointed out that in the case of apple, consumer. 65. responses for quality aspects associated with texture, taste and flavour are. 66. difficult to assess (Harker, Gunson & Jaeger, 2003).. 67. It is well known that consumer’s expectations are highly influenced. 68. by the cultural background (Tu, Valentin, Husson & Dacremont, 2010;. 69. Jesionkowska, Sijtsema, Symoneaux, Konopacka, & Płocharski, 2008; 4.
(7) 70. Prescott & Bell, 1995; Chung, Chung, Kim, Kim, O’Mahony, Vickers,. 71. Cha, Ishii, Baures & Kim, 2012). Cross-cultural studies allow a deeper. 72. understanding of the impact of global market integration and can increase. 73. communication and interaction across national boundaries (Tu et al., 2010;. 74. Douglas & Craig, 1997). Sometimes, in addition to the different cultures,. 75. the differences in language add a barrier to understanding consumer’s. 76. preferences and expectations from one country to another (Zanoni, 1997;. 77. Blancher, Chollet, Kesteloot, Hoang, Cuvelier & Sieffermann, 2007). In the. 78. particular case of apples, a previous work between British and Danish. 79. populations carried out by Jaeger et al. (1998) showed that there was no. 80. cultural interaction for sensory preference. However, the use of the. 81. descriptive vocabulary by consumers was left unexplored and the two. 82. studied cultures were too close in terms of familiarity with the product. As. 83. Tu et al. (2010) recently established, even if cross-cultural differences in. 84. certain food products might be known, little research has been done on how. 85. perception and description varies across cultures.. 86. Cultural parameters also include knowledge of the product,. 87. information about it (Tuorila, Meiselman, Cardello & Lesher, 1998) and. 88. familiarity via mere exposure (Birch & Marlin, 1982). Since expectations. 89. are related to consumers’ beliefs about the characteristics of the product. 90. (Ares, Piqueras-Fiszman, Varela, Morant Marco, Martín López, &. 91. Fiszman, 2011), it is rare for consumers to expect something they have 5.
(8) 92. never experienced. So their level of knowledge is highly attached to their. 93. expectations (Tuorila, Cardello & Lesher, 1994). Also, the way in which. 94. consumers express themselves could be related to their frequency of. 95. consumption and background (Blancher et al., 2007). Here lies the interest. 96. of comparing apple consumers in two countries such as France and. 97. Argentina. This fruit is common in both countries with an important. 98. production (Tons produced in 2008, according to FAO: France 1,940,200;. 99. Argentina 1,300,000) and consumption (8kg/person/year in Argentina. 100. (Bruzone,. 2010). and. 12kg/person/year. in. France. (Ministère. 101. l’Agriculture de France, 2011). However, the way the product is exposed. 102. and presented to consumers varies considerably. In selling points in France. 103. - from small street markets to important supermarkets - apples are always. 104. presented with the name of the variety, their general sensory characteristics. 105. (e.g. acid, aromatic) and sometimes different usages (e.g. to be cooked -. 106. “pomme à cuire”). On the contrary, in Argentina products are displayed. 107. with no information at all, other than the price. This exposure to. 108. information and background could be expected to have a direct impact on. 109. the way consumers express themselves (Chollet, 2011).. 110. To increase and optimize the experience of consumption it is. 111. essential to use concordant words when describing or communicating the. 112. products’ sensory attributes to the customer (Swahn, Öström, Larsson &. 113. Gustafsson, 2010; Antmann, Ares, Varela, Salvador, Coste, Fiszman,. de. 6.
(9) 114. 2011). Given this increased need for consumer data, several methodologies. 115. have been developed in order to reduce the breach between trained panels. 116. and consumer’s descriptive vocabulary. Under the hypothesis that. 117. consumers are able to describe products diverse methods are being used. 118. (Varela and Ares; 2012; Valentin, Chollet, Lelièvre & Abdi, 2012) such as. 119. flash profiling (Dairou & Sieffermann, 2006), free choice profiling. 120. (Williams & Langron, 1984; Narain, Paterson & Reid, 2004) and free. 121. sorting tasks completed with verbalization (Faye, Brémaud, Durand. 122. Daubin, Courcoux, Giboreau & Nicod, 2004 ; Lelièvre, Chollet, Abdi &. 123. Valentin, 2008; Chollet, Leliévre, Abdi & Valentin, 2011) or ultra-flash. 124. profiles (Perrin & Pagès, 2009). All these methodologies have proved. 125. useful in consumer vocabulary generation and as descriptive tools. 126. (Moussaoui & Varela, 2012); however, tasting of a product is needed.. 127. Other recently encouraged methods in sensory and consumer science to. 128. explore vocabulary generation are free listing (Hough & Ferraris, 2010;. 129. Rusell Bernard, 2005), word association (Guerrero, Claret, Verbeke,. 130. Enderli, Zakowska-Biemans, Vanhonacker, Issanchou, Sajdakowska,. 131. Granli, Scalvedi, Contel & Hersleth, 2010) and open-ended questions. 132. (Ares, Giménez, Barreiro & Gámbaro, 2010; ten Kleij & Musters, 2003;. 133. Symoneaux, Galmarini & Mehinagic, 2011). These have the advantage of. 134. allowing vocabulary generation also without tasting a product.. 7.
(10) 135. Open ended questions with subsequent comment analysis has proved. 136. to be a good methodology for consumer’s to describe, in their own personal. 137. way, a given product (Ares et al., 2010; Varela and Ares 2012). Moreover,. 138. the recent addition of the use of Chi-square per cell has allowed a deeper. 139. and more statistically reliable analysis of the contingency table with more. 140. accuracy on data interpretation complementing the representation of. 141. comments by CA (Symoneaux et al., 2011). Therefore, this methodology. 142. could be applied to find out consumers’ expectations on a particular. 143. product. In addition, a separate insight of what consumers’ expect to find. 144. and what they do not want to find in a product category could be obtained. 145. if asked separately (Symoneaux et al., 2011).. 146. In the present work, comment analysis of open-ended questions was. 147. used to study apple consumers’ expectations in two different countries. 148. (Argentina and France). The aims were to study, by means of an online. 149. survey, which characteristics defined quality in an apple for consumers,. 150. which characteristics consumers would like and which they would not like. 151. to find in an apple. Differences between countries, together with the impact. 152. of frequency of consumption and apple varieties knowledge, were. 153. analyzed.. 154 155. 2. Materials and methods. 156 8.
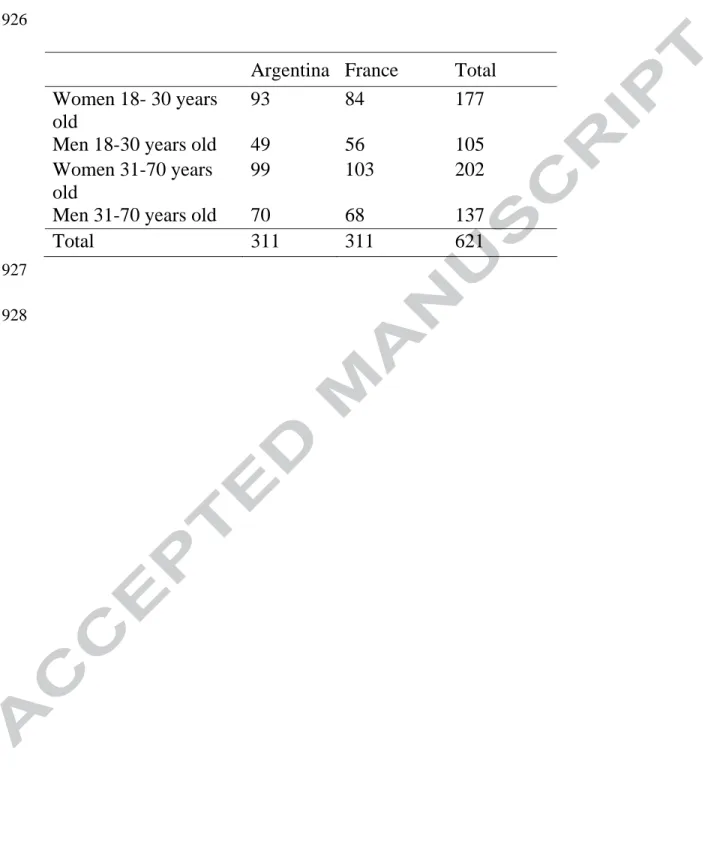
(11) 157. 2.1 Participants. 158. Data was collected by an on-line survey which was e-mailed to. 159. participants. These were recruited from previous consumer data bases. 160. considering gender, age and education level. Consumers lived in 3 cities in. 161. Argentina (Buenos Aires, Mendoza and Cordoba) and in 3 cities in France. 162. (Angers, Lille and Lyon). Only those who answered positively to apple. 163. consuming were taken into account obtaining a middle-class adult. 164. population segmented by gender and age as detailed in Table 1. In this way,. 165. a total of 311 answers were obtained in each country.. 166 167. 2.2 Survey. 168. The presented online survey consisted on a total of 13 questions. 169. adapted from Hutin (2008) which were expected to be answered in 15. 170. minutes or less. Questions were presented one at a time and answering was. 171. mandatory in order to pass to the next one.. 172. The structure of the questionnaire could be divided in 5 different. 173. parts (a through e) as follows: a) frequency of consumption of fresh fruits. 174. in general and apples in particular, b) open-ended questions for quality,. 175. visual characteristics, flavor, and texture of apples, c) knowledge of apple. 176. varieties, d) apple conception and e) demographic questions. Each section. 177. is detailed below.. 9.
(12) 178. a) For frequency of consumption the questions were: 1) How often. 179. do you consume fresh fruits?, 2) Which type of fruits do you consume and. 180. how often do you consume each one?, and 3) How often do you eat apples. 181. during each season (summer, autumn, winter, spring)?. The options for. 182. frequency responses were: every day or almost every day, once a week,. 183. two or three times a month, once a month, less than once a month, never.. 184. As for the types of fruits consumed, they were offered a list with 18 options. 185. of fruits present in both countries. Only those consumers who answered. 186. positively to apple consumption were allowed to continue with the. 187. questionnaire.. 188. b) The open-ended questions allowed the generation of a descriptive. 189. vocabulary in terms of positive and negative characteristics in an apple. In. 190. the first place consumers were asked to define the parameters which meant. 191. for them good quality in an apple (question 4). Then they were inquired. 192. about visual characteristics asking separately for what they would like to. 193. find and what they would not like to find (questions 5_1 and 5_2). The. 194. same was done for flavor (questions 6_1 and 6_2) and texture (questions. 195. 7_1 and 7_2). In this way a total of seven open-ended questions was. 196. generated.. 197. c) In order to explore consumers’ knowledge on apple varieties. 198. (question 8) consumers had to point out which varieties they knew, out of a. 199. list of 18 options (based on the availability in the country with more 10.
(13) 200. varieties, including therefore the varieties present in both countries). 201. namely: Ariane, Antares, Belchard/Chanteclerc, Belle de Boskoop,. 202. Braebum, Elstar, Fuji, Gala/Royal Gala/Rome beauty, Golden delicious,. 203. Granny Smith, Idared, Jonagold, Melrose/Mierose, Pink Lady, Mixture of. 204. red apples, Reinette Clochard, Reinette grise du Canada, Tentation.. 205. For the subsequent analysis of this information (contingency table),. 206. consumers were grouped a posteriori into four categories by the following. 207. criteria according to the amount of mentioned varieties: none, 1 to 4, 5 to 9,. 208. more than ten.. 209. d) To know what consumers thought about apple in each country. 210. (hereon referred to as apple conception), they were asked to answer a. 211. closed question (question 9) using a Likert scale (1= strongly agree to 5=. 212. strongly disagree) in order to describe apple as: a good fruit, food, a. 213. dessert, a satiating/low calorie product, a small pleasure, a daily fruit, a. 214. fruit for kids.. 215. e) For the demographic characteristics consumers were presented. 216. four closed questions (questions 10 to 13) asking about gender, age, level. 217. of education and city of residence.. 218 219 220 221. 2.3 Data analysis 2.3.1 Comment analysis 11.
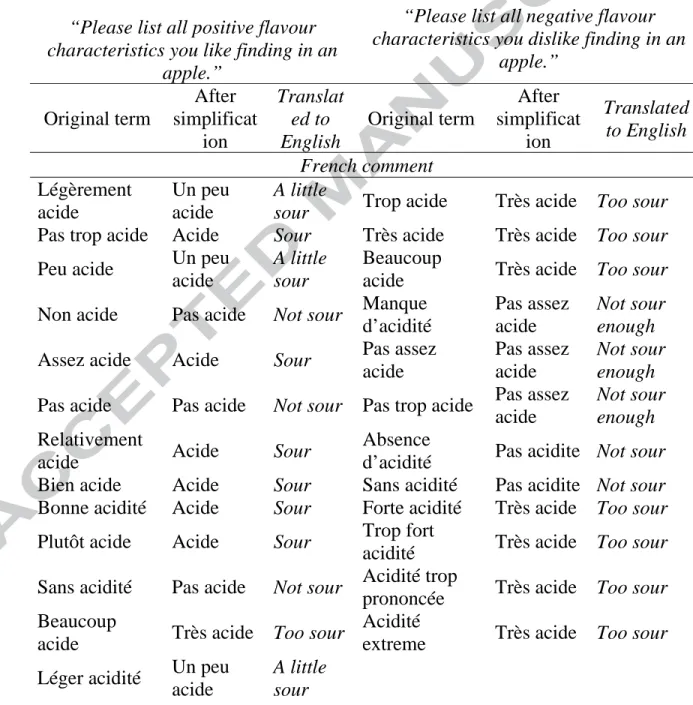
(14) 222. The analysis of open-ended questions required a particular treatment,. 223. since some consumers wrote only words while others gave long sentences. 224. explaining what they liked and what they disliked. Therefore, comments. 225. were transformed into precise modalities using the process presented by. 226. Symoneaux et al. (2011).. 227. In the present manuscript, the dataset was presented in a MSExcel. 228. file having for each consumer: a) the different open-ended questions and b). 229. all the initial information provided by each consumer in separate rows. For. 230. postcoding transcoders had to: verify typing and/or spelling mistakes;. 231. remove connectors, auxiliary terms and adverbs; regroup terms when. 232. necessary (Rostaing, Ziegelbaum, Boutin, & Rogeaux, 1998). At this stage. 233. of the postcoding a total of six transcoders participated in France and. 234. Argentina, completing the whole process in around 40 working hours. Four. 235. native Spanish speakers worked together on the Argentinean dataset and. 236. two French native speakers on the French one and a bilingual (French-. 237. Spanish) speaker was present to harmonize transcoding rules between both. 238. countries. In order to standardize the treatment of subtleties the postcoding. 239. proposed in Table 2 was used for each language.. 240 241. Once the re-transcription of the 311 consumers in France and in. 242. Argentina for the seven questions was done, all words were translated to. 243. English by a French and an Argentinean transcoder (the first one French12.
(15) 244. English speaker and the second one Spanish-French-English speaker; both. 245. familiar with the culture of both countries). A data set of 459 different. 246. terms in English used in Argentina and/or in France, and 577 if all. 247. subtleties (a little, too, not, etc; Table 2) were considered, was obtained.. 248. Finally, different contingency tables were obtained crossing these. 249. modalities with each question, country, known varieties and consumption. 250. frequency. At the same time, the total number of citations per consumer. 251. was counted also taking into account the aforementioned categories. 252. (country, etc).. 253 254. 2.3.2 Analysis of Variance (ANOVA). 255. Analysis of variance (ANOVA) was conducted with the data on the. 256. Likert scale for question 9, to assess significant differences in the product. 257. conception between the two countries.. 258. In addition, to evaluate if the number of words used by consumers. 259. was related to the question, country, cultivar knowledge and/or. 260. consumption level, two-ways variance analyses with interaction were. 261. carried out for each question on number of citations per consumer with two. 262. factors: country and apple consumption frequency. Statbox software. 263. (Version 6.6, Grimmersoft, Issy les Moulineaux, France) was used.. 264 265. 2.3.3 Global Chi-square and Chi-square per cell 13.
(16) 266. In order to observe differences among the words used in Argentina. 267. and in France, contingency tables were obtained crossing each question. 268. with country, apple consumption frequency and known varieties.. 269. Then to test the differences between each factor, global Chi-square. 270. and Chi-square per cell were used. The present approach had been. 271. previously validated by Symoneaux et al (2011) who analyzed open-ended. 272. questions by crossing products and consumers’ comments in the. 273. contingency table. After global Chi-square used for testing the. 274. independence between rows and columns of the contingency table, the Chi-. 275. square per cell indicates for each cell if the observed values were. 276. significantly higher, lower or equal to the theoretical values. In the present. 277. work, Chi-square per cell analysis was done with a specific Excel Macro. 278. specially developed for users who have no access to statistical softwares.. 279. 280. 2.3.4 Multiple Factorial Analysis. 281. Complementary to contingency tables analyses and Chi-square tests,. 282. a Multiple Factor Analysis for Contingency Table (MFACT) was. 283. performed in order to visualize: 1) the way consumers answered the. 284. descriptive apple questions (Q05_1 to Q07_2) and 2) the use of the. 285. descriptive terms in each country. MFACT is a principal axes analysis. 286. (Bécue-Bertau & Pages, 2004) allowing to compare the structure of several. 14.
(17) 287. contingency tables using an extension of the correspondence analysis. The. 288. two datasets compared in the present work were the two contingency tables. 289. (one per country) with the words generated by consumers in rows, the six. 290. questions (Q05_1 to Q07_2) in columns and the number of consumers. 291. using each modality for each given question in each cell. This analysis was. 292. computed with R language (R Development Core Team, 2011) and. 293. FactoMineR (Husson, Bocquet, & Pagès, 2004) using the function MFA. 294. precising in the code that data sets are contingency tables.. 295 296. 3. Results. 297. 3.1 Consumption frequency of apples.. 298. Apple was the most mentioned fruit in both countries, though it was. 299. more mentioned in France than in Argentina (p<0.001 between countries,. 300. representing 76% of the interviewed population in France and 64% in. 301. Argentina). However, the frequency of consumption was a little higher in. 302. France (p<0.001). In France, 41% of the interviewed consumers ate apples. 303. every day or almost every day and 35% once or twice a week while in. 304. Argentina those answers were given by 19% and 45% of the interviewed. 305. population respectively. In Argentina consumption was stable during the. 306. year (equal consumption frequency for every season) while in France it was. 307. seasonal (higher during autumn and winter).. 308 15.
(18) 309 310. 3.2 Cultivar knowledge. 311. Figure 1 shows the level of knowledge for the different apple. 312. varieties in both countries expressed as the % of interviewed consumers. 313. who knew the different varieties. It was evident that French consumers had. 314. a broader knowledge than Argentineans. In average, Argentineans knew. 315. 2.6 varieties while French knew 8.8. The only ones known by at least 25%. 316. of the interviewed Argentineans were Red apples (70%; the only response. 317. higher in Argentina than in France with p<0.001), Golden Delicious (59%),. 318. Granny Smith (52%) and Gala (31%). The other 14 proposed varieties were. 319. known by less than 10% of the Argentineans. It is worth noting that “red. 320. apples” is a general term and not a real variety. On the other hand, there. 321. were 16 varieties known by at least 25% of the interviewed French; the. 322. most important were also Grany Smith (95%), Golden Delicious (91%) and. 323. Royal gala (88%), together with Pink lady (80%) and Reinette grise du. 324. Canada (73%).. 325. Three different factors had an impact on knowledge: gender,. 326. frequency of consumption and age. In France women knew more varieties. 327. than men (p<0.01), while in Argentina there was no difference between. 328. genders. Most important, when analyzing known varieties and frequency of. 329. consumption, both in France and in Argentina, consumers who eat apples. 16.
(19) 330. every day mentioned more varieties than those who eat with a smaller. 331. frequency (p<0.001 in France and p<0.1 in Argentina).. 332 333. 3.3 Apple conception. 334. Apple conception (as defined in Materials and Methods section) in. 335. each country is presented in Figure 2. Even if there were some differences. 336. (p<0.01) between Argentinean and French consumer’s (4 criteria out of 7),. 337. the conception of apple was always in agreement with the proposed. 338. statements (values greater than 3). French associated apple more with. 339. pleasure, a dessert and a daily fruit; for Argentineans apple was considered. 340. more as a food. Consumers from both countries also agreed in apple being. 341. a good fruit revealing a positive perception; which could be expected since. 342. they were all consumers of the product.. 343 344. 3.4 Analysis of open-ended questions. 345. 3.4.1 Expected Quality. 346. In order to better understand consumer’s perception of quality, the. 347. words obtained from the answers to question 4 (“Please mention three. 348. characteristics or more that you think best define the quality of an apple”). 349. were grouped (by the transcoders) according to the categories: visual,. 350. flavour, texture and other. The total words for each category in each. 351. country are presented in Figure 3. It can be observed that in both countries 17.
(20) 352. the most (and equally) important category was texture. Then, in Argentina,. 353. the visual and flavour categories followed in order of importance while for. 354. French consumers flavour was more important than visual category.. 355. A word by word analysis of Q04 (contingency table) showed that the. 356. most mentioned term to describe the expected quality in an apple was the. 357. same in both countries: juicy (p>0.1), representing the 15.6% and 13.6% of. 358. the total citations in Argentina and France respectively. In the second place,. 359. the most used descriptors were color (Argentina, 9.8%) and crunchy. 360. (France, 12.9%). The third word in order of frequency of mention was. 361. sweet for both countries, though it was more cited in France (p<0.05).. 362. From the top fifteen words used, both countries also had in common tasty,. 363. firm (more used in France), texture and fresh (more used in Argentina). For. 364. Argentineans apple quality was also related to the terms: flavor, not_sandy,. 365. crispy and bright, rarely used by French consumers who used perfume, sour. 366. and acidulé. This last term was used more often by those consumers who. 367. knew more varieties (ten varieties or more, Chi-square p<0.01). This is a. 368. particular word since it includes both the quality (acid) and the intensity; it. 369. has no real translation to English and it means “slightly acid” or “acid. 370. like”.. 371 372. 3.4.2 Vocabulary generation. 18.
(21) 373. Table 3 shows the mean amount of words used by consumers to. 374. answer open-ended questions 4 through 7_2. In the first two columns the. 375. full questions and their respective codes are presented. Consumption,. 376. country, frequency and their interaction effects were also studied. It could. 377. be observed that country was significant (p<0.05) for almost all questions,. 378. except for flavor liked attributes and for texture liked attributes.. 379. Consumption frequency also had a significant effect, except for the liked. 380. visual and liked and disliked texture characteristics. Finally, there was no. 381. interaction between country and consumption frequency meaning that the. 382. difference observed between each segment of consumption was similar. 383. from a country to another.. 384. As it can be seen (Table 3, columns 6 and 7), Argentinean consumers. 385. gave a larger amount of words for all questions, even if for questions. 386. Q06_1 and Q07_1 this was only a tendency (p=0.144 and 0.095. 387. respectively). It is to be noted that when asked to describe the. 388. characteristics that best defined the quality of an apple (Q04) consumers. 389. had to give at least three words, while in the other questions there was. 390. neither a minimum nor a maximum of words stated. In this way, when no. 391. specification was given, consumers (in both countries) gave in average less. 392. than three words. Also in both countries consumers gave more positive. 393. than negative attributes (p<0.001).. 19.
(22) 394. For the characteristics expected to be found in an apple,. 395. Argentineans were equally prolific on visual and flavour while for French. 396. flavour was more important than visual or texture. The same tendency was. 397. observed for the disliked characteristics, but fewer words were given in. 398. each country. Finally, in France and in Argentina, consumers cited few. 399. words (under 2) relative to texture in comparison to flavour and visual. 400. characteristics (average number of citations over 2; p<0.001).. 401 402. As previously mentioned, the impact of consumption level was the. 403. same in both countries (no interaction frequency of consumption*country,. 404. Table 3). Therefore, the average citations of consumers per frequency of. 405. consumption level were analyzed as a whole (Table 3, columns 8 to 11). In. 406. this way, it could be observed for questions Q04, Q05_2, Q06_1, Q06_2. 407. that the higher the frequency of consumption, the more prolific consumers. 408. were in their answers (p<0.05). For the other questions the same tendency. 409. was observed. Those consumers who ate apples more regularly generated. 410. more flavour attributes than visual and texture. For an intermediate level of. 411. consumption, visual and flavour descriptors were equally cited and more. 412. numerous than texture ones. Finally, consumers who ate apples rarely gave. 413. more words for visual characteristics, less for flavour and even less for. 414. texture.. 415 20.
(23) 416. The effect of cultivar knowledge on the amount of words given by. 417. consumers was also studied for each country; this is presented in Table 4.. 418. Knowledge had a positive impact on the mean amount of words given by. 419. consumers and this was more evident in Argentina. Those Argentineans. 420. who knew at least one and up to four varieties gave more words than those. 421. who did not know any varieties; those who knew between five to nine. 422. varieties gave even more words. In France, there was also a positive effect. 423. but significantly different for those who knew more than ten varieties. 424. (category non existent in Argentina since no consumers knew that many).. 425. The significant effect of question in both countries is related to the. 426. differences in the amount of words used by consumers in the different. 427. categories (quality, flavour, etc.) as previously stated.. 428 429. Analysis of the different contingency tables crossing used words. 430. with country, frequency of consumption and cultivar knowledge showed. 431. that the greater differences in the words used was between countries. A. 432. Multiple Factor Analysis of the Contingency Table was used to observe. 433. these differences. Figure 4 and Figure 5 show the relationship among the. 434. 42 most cited words answering to questions 5_1 to 7_2 in both countries. 435. analyzed by a MFACT (questions in columns and words in rows).. 436. Figure 4 presents only questions (columns) results; dimension 1 of. 437. the MFACT was explained by 24.2% and dimension 2 by 23.1%. It could 21.
(24) 438. be observed that the first dimension opposed the liking related terms to the. 439. disliking ones. This suggests that, in general, the words used for likes and. 440. dislikes were not the same. Moreover, it could be induced that the words. 441. used to characterize liked texture and liked flavour (Q07_1 and Q06_1) and. 442. disliked texture and dislike flavour (Q07_2 and Q06_2) were respectively. 443. the same. However, a closer analysis of the contingency table showed that. 444. flavour descriptors (e.g.: sweet, sour) were used only to describe flavour. 445. while some texture attributes (namely: juicy, crunchy, firm) were used in. 446. both categories: flavour and texture. This did not happen for visual. 447. characteristics, where the used terms were clearly different from all others,. 448. both for likes (Q05_1) and dislikes (Q05_2).. 449 450. The figure 5 presents results from MFACT with words used in both. 451. countries. It allows visualizing and comparing the relationship between the. 452. 42 most used terms in Argentina and in France (in addition to the Chi-. 453. square per cell analysis of each question by country). Here, the longer the. 454. line the bigger the difference in the frequency of mention between the two. 455. countries for the given term; also the location of the word on the graph. 456. relates it to the different questions (Figure 4).. 457. As for aspect (Figure 5, quadrants III and IV) there were some. 458. differences between the two countries. Argentineans expressed that they. 459. did not like dull apples and that they did like bright red apples. On the 22.
(25) 460. contrary, for French consumers red color, bright and dull were close. 461. together, in-between likes and dislikes showing that there was not such a. 462. clear pattern for their preferences, being the term bright highly mentioned. 463. in the disliked category. The term wrinkled was a very important disliked. 464. characteristic for French. For Argentinean the most important dislikes were. 465. the presence of damages and the dull aspect. In both countries consumers. 466. mentioned size_big, size_small, no_damages, shape, aspect, shape_round. 467. and intense_color in the same way.. 468. For flavour (liked and disliked), an important difference was. 469. observed between the two countries. Argentineans used more often the. 470. words aroma, taste and flavour as general categories (Figure 5, quadrant I).. 471. That is to say, when asked “what do you like finding…” they answered. 472. directly “aroma”, “taste” or “flavour”. On the other hand, French. 473. consumers used aromatic descriptors stating “flavor of” (e.g. fruity flavor,. 474. flowery flavor) describig what they liked and what they disliked finding in. 475. an apple; therefore “flavour_of” is found near the coordinates axe (Figure. 476. 5) and was much more employed by French than by Argentinean. 477. consumers. Also in the flavour category, French used the word acidulé (as. 478. a liked flavour characteristic; Figure 5, quadrant I) differently from sour,. 479. which was positioned in the middle as it was a liked attribute for some. 480. consumers and a disliked one for others.. 23.
(26) 481. Argentinean consumers made no distinction in the use of the words. 482. firm and hard (Figure 5, quadrant I) to refer to a desired texture. 483. characteristic. French consumers used clearly more often the word firm and. 484. only to express something they liked to find in an apple. They rarely used. 485. the term hard and when they did it was in the disliked category. Other than. 486. these, the terms used to express liked and disliked flavour and texture. 487. characteristics were different. For disliked texture, the most used term by. 488. French consumers were mealiness and soft while Argentineans did not use. 489. mealiness and used sandy and paposa instead (no real translation can be. 490. presented for paposa, it is a familiar Argentinean adjective meaning. 491. “potato like”). Tasteless, dry and rough were used in the same way in both. 492. countries (Figure 5, quadrant II). In terms of what consumers liked finding. 493. as flavour and texture of an apple (Figure 5, quadrant I) the terms juicy,. 494. sweet, fresh, tasty and firm were equally used in both countries. But. 495. Argentineans used more the terms crispy and tasty. It is to be noted that. 496. French consumers did not use the term crispy while Argentineans used both. 497. terms, crispy and crunchy, in the same proportion (34 and 43 citations. 498. respectively for Q07_1, data obtained from the contingency table).. 499 500 501 502. 4. Discussion It was not surprising that quality perception of apples was influenced by culture. Previous works on apple evaluation by consumers (Cliff, 24.
(27) 503. Sanford & Johnston, 1999) showed that even within the same country,. 504. differences in quality perception could be found within regions in relation. 505. to the familiarity with the apple varieties grown in the region.. 506. Argentinean consumers defined apple quality first by texture, then by. 507. the visual aspect and finally by flavour. In aspect, color played an. 508. important role as something they like to find in an apple while for French. 509. this was not important. This reinforces the idea that, particularly in relation. 510. to apple, the valorisation of color is highly related to cultural and traditional. 511. values (Delhom, 1985). Moreover, since in Argentinean markets apples are. 512. not presented with any information concerning taste, as they are presented. 513. in France, it is not surprising that consumers rely more on the visual aspect. 514. of the fruit. For French, quality was also defined by texture, but then they. 515. gave more importance to flavour than to visual aspect. On the other hand,. 516. both populations highly agreed that a good quality apple would be defined. 517. by: juicy, color, crunchy, sweet, tasty, firm, texture and fresh. Even if held. 518. in different countries, previous works showed - by preference mapping -. 519. that apple’s preference was driven by many of these attributes (Dalliant-. 520. Spinnler et al., 1996; Jaeger et al, 1998; Jaeger, Wakeling & MacFie, 2000,. 521. Peneau et al, 2006). This is also in agreement with previous work done by. 522. Hutin (2008) in the French market. He found, by using closed questions,. 523. that French associated quality of an apple to crunchiness, sweetness,. 524. juiciness and acidulé. 25.
(28) 525. It is to be noted that texture was an important category for both. 526. countries in terms of quality (Fig.3). When answering to the question. 527. “Please mention the characteristics that best define the quality of an. 528. apple” many consumers said directly “its texture” and not a descriptor. So,. 529. even if texture appeared as the most important indicator of quality, it. 530. received the least number of descriptors in the open-ended questions. 531. (Q07_1 and Q07_2) for both countries. However, as mentioned in the. 532. results section, even if they were few, texture attributes were used also in. 533. the flavor category. This could be showing that it is not easy for consumers. 534. to distinguish between these two categories, and could be related to the. 535. semantic structure of this sensory dimension. At the same time, this reveals. 536. that, even if consumers do not have a broad texture vocabulary, certain. 537. attributes are very important for consumers and they tend to repeat them.. 538 539 540. The amount of words given in the open-ended questions was influenced by country, cultivar knowledge and frequency of consumption.. 541. French consumed more and had a wider knowledge on apple varieties. 542. but, surprisingly, Argentineans gave (in general) more words than French. 543. (Table 4). Blancher et al (2007) found similar results when comparing. 544. French and Vietnamese descriptive vocabulary on jellies. The group that. 545. was most in contact with the jellies (the Vietnamese) had smaller. 546. vocabulary richness for describing the product, explaining that those 26.
(29) 547. subjects more familiar with a product used similar words while those less. 548. familiar (the French in this case) had to choose more idiosyncratic words to. 549. describe the products. In the present work, there could be in addition an. 550. influence of language. Even if languages evolve, it has long been stated. 551. that Spanish is a much richer language which also has a higher amount of. 552. synonyms than French (Dupuy, 1829). This could be contributing to the. 553. larger number of words per person given by Argentineans.. 554. An analysis of the words used in each country evidenced that French. 555. consumers gave a somewhat more detailed description particularly for. 556. flavour. Here, Argentineans used generic terms to refer to their liked. 557. characteristics (aroma, taste, flavour) and gave no aromatic disliked. 558. characteristics. On the other hand, French consumers described the type of. 559. aroma they liked and disliked finding in their apple. Therefore, even if they. 560. gave fewer words per person their description (e.g. fruity flavor, flowery. 561. flavor) showed a somewhat more specific aromatic vocabulary. Chollet and. 562. Valentin (2000) worked on the description on beer with novices and. 563. experts and found that experts tend to be more precise and concrete than. 564. novices who use more ambiguous, redundant words. This would be. 565. showing that, in our case, familiarity acquired by culture (exposure to the. 566. product, knowledge of varieties) would have the same effect as training in. 567. the use of descriptive vocabulary. Moreover, Argentineans had only one. 568. term to refer to the acid taste and they used it to describe a liked and a 27.
(30) 569. disliked characteristic (ácido translated as sour). French also used this term. 570. (acide) but they had the word acidulé which includes both the attribute and. 571. the intensity and they could use this to describe only a liked flavour. So,. 572. even if Argentineans used more words, they were able to give somewhat. 573. less information.. 574. Some differences were also found in the use of the terms crispy and. 575. crunchy. These two are desirable qualities particularly important in the case. 576. of fruits and vegetables (Fillion & Kilcast, 2002) sometimes associated to. 577. freshness and wholesomeness (Fillion & Kilcast, 2000; Szczesniak, 1988).. 578. Fillion & Kilcast (2002) showed that these terms can be difficult to define. 579. even by panelists who would say that they could perceive a difference. 580. between the two, but then struggled to describe it. In brief, crispy and. 581. crunchy are words that are used to describe products that break rather than. 582. deform. It was also suggested that crunchiness was more relevant to fruits. 583. and vegetables when compared with crispness and that both attributes. 584. could represent the same continuum of hardness, the choice of word. 585. depending on the intensity level considered. In the present work it was. 586. found that the use of the terms crunchy and crispy was different between. 587. French and Argentinean consumers. French used the word crunchy. 588. (croquant) when describing quality and liked texture (and flavor) attributes. 589. but never mentioned the word crispy (croustillant). On the other hand,. 590. Argentineans used both terms (crocante and crujiente respectively) almost 28.
(31) 591. as synonyms especially as liked texture attributes. Jowitt (1974) stated that. 592. the sensation of crispness is associated with dry foods while crunchiness. 593. would be associated with wet foods. Therefore French consumers would. 594. seem more educated in the use of these terms. However, a study on the. 595. understanding of the crispy-crunchy sensory perception conducted in Spain. 596. and Uruguay revealed cultural differences in the use of these words. 597. (Varela, Salvador, Gámbaro & Fiszman 2008). More particularly, a work. 598. on consumers’ use of texture vocabulary using the free listing method in. 599. Argentina, Uruguay and Spain (Antmann et al., 2011) showed that both. 600. terms crunchy and crispy were highly present in the Argentinean. 601. consumers mind while Spanish consumers did not use the term crunchy. 602. (this behavior of Spanish consumers was also found by Varela et al., 2008).. 603. This would be supporting the fact that the use of these two terms is highly. 604. related to culture other than to the level of knowledge.. 605. Both countries used different words to describe disliked texture.. 606. French used mostly mealiness (farineuse) while Argentineans used sandy. 607. (arenosa) and paposa but did not use the word harinosa, which would. 608. translate as mealy. Andani, Jaeger, Wakeling & MacFie (2001) studied. 609. terms related to mealiness in apple by trained panel and consumers in 5. 610. different European countries and found that consumers perceived mealiness. 611. similarly but they described their perceptions differently. Among all the. 612. consumer panels, except the British, a single term was dominant. These 29.
(32) 613. terms (Flemish: melig, Danish: melet, French: farineuse, Spanish: harinosa). 614. all translated into mealy and/or floury in the English language. However,. 615. the British consumers did not use the term mealy texture. They used dry,. 616. coarse and spongy to characterize this textural sensation. This suggests that. 617. mealiness is an umbrella term covering the textural sensations associated. 618. with floury, coarse, dry and soft texture in apples. However, in the present. 619. work no tasting took place, therefore we can not definitely state that what. 620. Argentineans called as sandy and paposa reflected the same sensory. 621. perception as mealy. This could be a limitation of the use of this. 622. methodology for product characterization without tasting.. 623 624. Finally, when both populations were stratified according to their. 625. frequency. of. consumption,. no. interaction. (country*frequency. of. 626. consumption) showing that those who consume more behave in the same. 627. manner in both countries. More frequent consumers (and also those who. 628. knew more cultivar varieties) gave more words when answering about. 629. liked/disliked flavour attributes. Intermediate consumers gave equal. 630. amount of flavour and visual characteristics, while the least frequent. 631. consumers prioritized visual characteristics. Fenko et al. (2010) found that. 632. sensory dominance changes along user-product interaction. Even if this. 633. change is highly related to the product, they observed that in general, vision. 634. was the dominant sense in the first stage of consumer-product contact, 30.
(33) 635. especially at the purchasing point. But, as time passed and consumers’. 636. relationship with the product evolved, this sense became less important. 637. giving way to an increase in the relevancy of touch, olfaction and taste. We. 638. believe that consumers who eat apples with a higher frequency might be. 639. passed this first stage of product recognition by sight, and so visual cues. 640. become less important when describing a product explaining the higher. 641. relevance of flavour attributes. Moreover, results could be showing that a. 642. higher knowledge of the product leads the consumer to expect something. 643. more beyond appearance. Low frequency consumers expectations are more. 644. related to the visual aspect because they don’t have enough background to. 645. specify what they would like in terms of flavour. 646 647 648. 5. Conclusions. 649. Consumers’ expectations for quality were not exactly the same in. 650. Argentina and in France. Texture played an important role for both. 651. countries, but then for Argentineans quality was more related to visual. 652. aspects (e.g. color) and for French to flavor (e.g. sweet). As a whole, both. 653. populations agreed that a quality apple should be first of all juicy, also. 654. tasty, firm and fresh.. 655. The two countries gave more positive than negative characteristics in. 656. each category and all considered apple to be a good food. Argentineans 31.
(34) 657. were, as a whole, more prolific but French were more specific. Particularly. 658. when describing the flavour category they were more prone to give. 659. descriptors.. 660. Moreover, frequency of consumption, cultivar knowledge and the. 661. amounts of words given were highly related in each country. Those who. 662. consumed more often knew more varieties and gave more words in relation. 663. to flavour than other categories. Those who consumed less often knew. 664. fewer varieties and gave more words in the visual category. Consuming a. 665. product with a higher frequency might make consumers overlook the. 666. obvious visual cues and make them appreciate more the flavour attributes.. 667. On the other hand, not enough knowledge and interaction with the product. 668. (low frequency consumers) might lead them to basic expectations more. 669. related to appearance.. 670. The most mentioned as disliked attributes for French consumers. 671. were mealiness, wrinkled and tasteless and for Argentineans were damages,. 672. dull aspect, sandy and “paposa”. As for liked attributes French mentioned. 673. more: crunchy, “acidulé”, smooth and firm. For Argentineans the most. 674. liked characteristics of an apple were aroma, taste, crispy, bright and color. 675. red. In this way, the use of comment analysis allowed identifying the terms. 676. that consumers use to describe an apple revealing that, in general, the terms. 677. used to describe liked and disliked characteristics were not the same. Also,. 32.
(35) 678. the influence of culture was evident since consumers gave priority to. 679. different characteristics of this particular fruit.. 680 681 682. Acknowledgments This study was supported by ARFITEC (Project ARF-10-13, 2011-. 683. 2012). The authors would like to thank Beatriz Coste (UBA), Alejandra. 684. Picallo (UBA), Fernando Pedri (UCC), Laura Cánovas (UNCU), Adriana. 685. Perez (UCA), Anne Dubray (ISARA) for their assistance on data. 686. acquisition.. 687. 33.
(36) 688. References. 689. Andani, Z., Jaeger, S.R., Wakeling, I. & MacFie, H.J.H. 2001. Mealiness in. 690. Apples: Towards a Multilingual Consumer Vocabulary. Journal of. 691. Food Science, 66, 872-879.. 692. Antmann, G., Ares, G., Varela, P., Salvador, A., Coste, B. & Fiszman, S.M.. 693. 2011. Consumers’ texture vocabulary: Results from a free lifting. 694. study in three Spanosh-speaking countries. Food Quality and. 695. Preference, 22, 165-172.. 696. Ares, G., Giménez, A., Barreiro, C., & Gámbaro, A. 2010. Use of an. 697. openended question to identify drivers of liking of milk desserts.. 698. Comparison with preference mapping techniques. Food Quality and. 699. Preference, 21(3), 286–294.. 700. Ares, G., Piqueras-Fiszman, B., Varela, P., Morant Marco, R., Martín. 701. López, A. & Fiszman, S. 2011. Food labels: Do consumersperceive. 702. what semiotics want to convey? Food Quality and Preference, 22,. 703. 689, 698.. 704. Bécue-Bertau, M. & Pages, J. 2004. A principal axes method for. 705. comparing contingency tables: MFACT. Computational Statistics. 706. & Data Analysis, 45, 481–503.. 707. Birch, L. L. & Marlin, D. W. 1982. I don’t like it; I never tried it: Effects of. 708. exposure on two-year-old children’s food preferences. Appetite, 3,. 709. 353–360. 34.
(37) 710. Blancher, G., Chollet, S., Kesteloot, R., Hoang, D. N., Cuvelier, G., &. 711. Sieffermann, J.M. 2007. French and Vietnamese: How do they. 712. describe texture characteristics of the same food? A case study with. 713. jellies. Food Quality and Preference, 18, 560–575.. 714 715. Bruzone, I. 2010. Cadenas Alimentarias: Manzana y pera. Alimentos Argentinos, 47, p.18-24.. 716. Chollet, S. 2011. Apprentissage délibéré versus apprentissage perceptif.. 717. Même expertise ? Habilitation à Diriger des Recherches.. 718 719. Chollet, S. & Valentin, D. 2000. Impact of training on beer flavour. 720. perception and description: are trained and untrained subjects really. 721. different? Journal of Sensory Studies, 16, 601-618.. 722. Chollet, S., Lelièvre, M., Abdi,H. & Valentin, D. 2011. Sort and beer:. 723. Everything you wanted to know about the sorting task but did not. 724. dare to ask. Food Quality and Preference, 22, 507-520.. 725. Chung, L.; Chung, S.; Kim, J.; Kim, K.; O’Mahony, M.; Vickers, Z.; Cha,. 726. S.; Ishii, R.; Baures, K. & Kim, H. 2012. Comparing the liking for. 727. Korean style salad dressings and beverages between US and. 728. Korean consumers: Effects of sensory and non-sensory factors.. 729. Food Quality and Preference 26, 105–118.. 730 731. Cliff, M.A., Sanford, K. & Johnston, E. 1999. Evaluation of hedonic scores and R-indices for visual, flavour and texture preferences of apple 35.
(38) 732. cultivars by British Columbian and Nova Scotian consumers.. 733. Canadian Journal of Plant Science, 79, 395–399.. 734. Dairou, V. & Sieffermann, J. M. 2006. A comparison of 14 jams. 735. characterized by conventional profile and a quick original method,. 736. the flash profile. Journal of Food Science, 67:826-834.. 737. Dalliant-Spinnler, B., MacFie, H. J. H., Beyts, P. K. & Hed-derley, D. 1996. 738. Relationships between perceived sensory properties and major. 739. preference directions of 12 varieties of apples from the southern. 740. hemisphere. Food Quality and Preference 7(2), 113 - 126.. 741 742. Delhom, M.J. 1985. La calidad de manzanas y peras. Publicación de extensión agrarian, España.. 743. Dooley, L., Lee, Y. & Meullenet, J. 2010. The application of check-all-. 744. that-apply (CATA) consumer profiling to rpeference mapping of. 745. vanilla ice cream and its comparison to classical external. 746. preference mapping. Food Quality and Preference, 21, 394-401.. 747. Douglas, S.P. & Craig C.S. 1997. The changing dynamic of Consumer. 748. behavior: implications for cross-cultural research. International. 749. Journal of Research in Marketing, 14, 379-395. 750. Dupuy, P (1829) : Abrégé élémentaire des différences les plus. 751. remarquables entre la France etl’Espagne, p83-109. Imprenta. 752. Joaquín Verdaguer, Barcelona.. 36.
(39) 753. Faye, P., Brémaud, D., Durand Daubin, M., Courcoux, P., Giboreau, A. &. 754. Nicod. H. 2004. Perceptive free sorting and verbalization tasks with. 755. naive subjects: an alternative to descriptive mappings. Food. 756. Quality and Preference, 15:781-791.. 757. Fenko, A., Schifferstein, H.N.J. & Hekkert, P. 2010. Shifts in sensory. 758. dominance between various stages of user–product interactions.. 759. Applied Ergonomics 41, 34–40. 760. Fillion, L. & Kilcast, D. 2002. Consumer perception of crispness and. 761. crunchiness in fruits and vegetables. Food Quality and Preference,. 762. 13, 23–29.. 763. Harker, F.R., Gunson, F.A., Jaeger, S.R. 2003. The case for fruit quality: an. 764. interpretive review of consumer attitudes, and preferences for. 765. apples. Postharvest Biology and Technology, 28, 333-347.. 766. Henley, N.M. 1969. A psychological study of the semantics of animal. 767. terms. Journal of Verbal Learning and Verbal Behavior, 8, 176-. 768. 184.. 769. Hough, G. & Ferraris, D. 2010. Free listing: A method to gain initial. 770. insight of a food category. Food Quality and Preference, 21, 295-. 771. 301.. 772. Husson, F., Bocquet, V., & Pagès, J. 2004. Use of confidence ellipses in a. 773. PCA applied to sensory analysis application to the comparison of. 774. monovarietal ciders. Journal of Sensory Studies, 19, 510–518. 37.
(40) 775. Hutin, C. (2008). La pomme auprès des français. Infos CTIFL, 195, 11–15.. 776. Jaeger, S.R., Andani, Z., Wakeling, I.N. & MacFie H.J.H. 1998. Consumer. 777. preferences for fresh and aged apples: a cross-cultural comparison.. 778. Food Quality and Preference, 9 (5), 355-366.. 779. Jesionkowska, K., Sijtsema, S., Symoneaux, R., Konopacka, D. &. 780. Płocharski, W. 2008. Preferences and consumption of dried fruit. 781. And dried fruit products among Dutch, French and Polish. 782. consumers. Journal of Fruit and Ornamental Plant Research, 16,. 783. 261-274.. 784 785 786. Kelly, G. (1955). The physiology of personal constructs. New York: Norton. Lelièvre, M., Chollet, S.,Abdi, H. & Valentin, D. 2008. What is the validity. 787. of the sorting task for describing beers? A study using trained and. 788. untrained assessors. Food Quality and Preference,19, 697-703.. 789 790 791. Ministère de l’Agriculture de France. 2011. La consommation des fruits, Agreste ALIMENTATION. Narain, C., Paterson, A. & Reid, E. 2004. Free choice and conventional. 792. profiling of commercial black filter coffees to explore consumer. 793. perceptions of character. Food Quality and Preference, 15, 31–41.. 794. Opara, L.U., Al-Said, F.A. & Al-Abri, A. 2007 Assessment of what the. 795. consumer values in fresh fruit quality: case study of Oman. New. 796. Zealand Journal of Crop and Horticultural Science, 35, 235-243. 38.
(41) 797. Péneau, S., Hoehn, E., Roth, H.-R., Escher, F. & Nuessli J. 2006.. 798. Importance and consumer perception of freshness of apples. Food. 799. Quality and Preference, 17, 9-19.. 800. Perrin, L. & J. Pagès. 2009. Construction of a product space from the ultra-. 801. flash profiling method: Application to 10 red wines from the loire. 802. valley. Journal of Sensory Studies, 24:372-395.. 803. Prescott, J. & Bell, G. 1995. Cross-cultural determinants of food. 804. acceptability: Recent research on sensory perceptions and. 805. preferences. Trends in Food Science and Technology, 6, 201-205.. 806. Rau, V.H. 2010. La transnationalisation de la production et la qualité de. 807. l’emploi dans l’exportation des fruits en Argentine. Symposium du. 808. CEISAL VI, «Indépendance-Dépendances-Interdépendances»,. 809. Toulouse (France), (Axe II, Symposium 5),p 23.. 810. Rostaing, H., Ziegelbaum, H., Boutin, E., & Rogeaux, M. 1998. Analyse de. 811. commentaires libres par la techniques des réseaux de segments. In. 812. Fourth International Conference on the Statistical Analysis of. 813. Textual Data, JADT’98.. 814. Rusell Bernard, H. 2005. Free listing. In H. Rusell Bernard (Ed.), Research. 815. methods in anthropology: Qualitative and quantitative approaches. 816. (4th ed.) (pp 301-311). Lanham, AltaMira Press.. 39.
(42) 817. Russell, C.G. & Cox, D.N. 2004. Understanding middle-aged consumers’. 818. perceptions of meat using repertory grid methodology. Food. 819. Quality and Preference 15, 317–329.. 820. Sijtsema, S.J., Zimmermann, K., Cvetković, M., Stojanovic, Z., Spiroski,. 821. I., Milosevic, J., Mora, C., Butigan, R., Mugosa, B., Esteve, M.,. 822. Pohar, J. 2012. Consumption and perception of processed fruits in. 823. the Western Balkan region. LWT - Food Science and Technology,. 824. 49, 293-297.. 825 826. Shewfelt, R.L. 1999. What is quality? Postharvest Biology and Technology, 15 (3)197–200.. 827. Symoneaux, R., Galmarini, M.V. & Mehinagic, E. 2011. Comment. 828. analysis of consumer’s likes and dislikes as an alternative tool to. 829. preference mapping. A case study on apples. Food Quality and. 830. Preference, 24 (1), 59-66.. 831. Swahn, J.; Öström, A.; Larsson, U. & Gustafsson, I. 2010. Sensory and. 832. semantic language model for red apples. Journal of Sensory. 833. Studies, 25, 591–615.. 834. ten Kleij, F. & Musters, P. A. D. 2003. Text analysis of open-ended survey. 835. responses: A complementary method to preference mapping. Food. 836. Quality and Preference, 14(1), 43–52.. 837. Tu, V.P., Valentin, D., Husson, F. & Dacremont, C. 2010. Cultural. 838. differences in food description and preference: Contrasting 40.
(43) 839. Vietnamese and French panellists on soy yogurts. Food Quality and. 840. Preference 21, 602–610.. 841. Tuorila, H., Cardello, A.V. & Lesher, L.L. 1994. Antecedents and. 842. Consequences of Expectations Related to Fat-free and Regular-fat. 843. Foods. Appetite , 23, (3), 247–263.. 844. Tuorila, H. M., Meiselman, H.L., Cardello, A.V. & Lesher, L.L. 1998.. 845. Effect of expectations and the definition of product category on the. 846. acceptance of unfamiliar foods. Food Quality and Preference, 9 (6),. 847. 421±430.. 848. Valentin, D, Chollet, S., Lelièvre, M. & Abdi, H. 2012. Quick and dirty but. 849. still pretty good: a review of new descriptive methods in food. 850. science. International Journal of Food Science and Technology.. 851. doi:10.1111/j.1365-2621.2012.03022.x. 852. Varela, P & Ares, G. 2012. Sensory profiling, the blurred line between. 853. sensory and consumer science. A review of novel methods for. 854. product characterization. Food Research International, 48, 893-908.. 855. Williams, A.A. & Langron, S.P. 1984. The use of free-choice profiling for. 856. the evaluation of commercial ports. Journal of the Science of Food. 857. and Agriculture 35, 558–568.. 858 859. Zanoni, M. 1997. Approaches to translation problems of sensory descriptors. Journal of Sensory Studies 12, 239-253.. 41.
(44) 860 861. Legends for Figures. 862 863. Figure 1. Knowledge of the different apple cultivars in both countries.. 864 865. Figure 2. Apple conception for French and Argentinean consumers.. 866. Answers were given on a Likert scale being 1: I strongly disagree. 5: I. 867. strongly agree.. 868. **p<0.01; *** p<0.001. 869 870. Figure 3. Total words elicited by consumers for the categories flavor,. 871. visual, texture and other in Argentina and in France to describe apple. 872. quality.. 873 874. Figure 4. Multiple Factor Analysis of the Contingency table of the 42. 875. words most used to answer questions 5_1 to 7_2 in both countries.. 876. Representation of questions (columns).. 877 878. Figure 5. Multiple Factor Analysis of the Contingency table of the 42. 879. words most used to answer questions 5_1 to 7_2 in both countries.. 880. Representation of words (rows).. 42.
(45) 881. Words not (or barely) used by one of the countries would be in the center. 882. of coordinates; they are not presented for a clearer presentation.. 883. Words used in the same amount by both countries are represented by a dot;. 884. when many words were grouped together a brace was used.. 885. 43.
(46) 886. 887 888 889. Figure 1.. 890. 44.
(47) 891 892 5-Strongly agree. Argentina France. 4. 2. 1- Strongly Disagree. A good fruit. 893. Food **. A dessert *** A stop-eat prodtuct. A small A daily fruit pleasure *** ***. A fruit for kids. 894 895. Figure 2.. 896. 45.
(48) 897 898. 899 900. Figure 3.. 901. 46.
(49) 902 903. Argentina France. 1. 904. Q06_1. 905. Q07_2. Q06_2 Q07_2. 0. Q07_1. Q05_2 Q05_2 -1. 909. Dim 2 (20.76%). 908. Q06_2. Q07_1. 906 907. Q06_1. Q05_1 910. Q05_1. 912. -2. 911. 913. -2. 914. -1. 0. 1. 2. Dim 1 (25.03%). 915 916 917 918 919. Figure 4.. 920. 47.
(50) 3. acidulé. I. II aroma. 2. ARG FRA. mealiness. paposa. Flavor of. taste. sandy smell sandy_no. 1. sweet flavor juicy. fresh. sweet juicy. tasteless. flavor. sour Flavor_of. taste. tasty. firm. suave. hard. smell crunchy. 0. firm. hard. dry. soft rough. soft. texture smooth. rotten. dull damages. col_red. -1. Dim 2 (20.76 %). crunchy. crispy. sour. damages bright size_small size_big. -2. smooth. III. aspect shape size_medium shape_round col_intense damages_no size. -2. dull. color wrinkled bright color col_red. IV. 0. 2. 4. Dim 1 (25.03 %). 921 922. Figure 5.. 923. 48.
(51) 924 925. Table 1. Description of the surveyed population.. 926. Women 18- 30 years old Men 18-30 years old Women 31-70 years old Men 31-70 years old Total. Argentina France 93 84. Total 177. 49 99. 56 103. 105 202. 70 311. 68 311. 137 621. 927 928. 49.
(52) 929. Table 2 Example of the transformation of nuances using the term. 930. “sour”, from French to English and Spanish to English in questions 6_1. 931. (Please list all positive flavour characteristics you like finding in an apple). 932. and 6_2 (Please list all negative flavour characteristics you dislike finding. 933. in an apple). Answer given as a positive characteristic:. Answer given as a negative characteristic:. “Please list all negative flavour “Please list all positive flavour characteristics you dislike finding in an characteristics you like finding in an apple.” apple.” After After Translat Translated Original term simplificat Original term simplificat ed to to English ion ion English French comment Légèrement Un peu A little Trop acide Très acide Too sour acide acide sour Pas trop acide Acide Très acide Très acide Too sour Sour Beaucoup Un peu A little Peu acide Très acide Too sour acide acide sour Manque Pas assez Not sour Non acide Pas acide Not sour d’acidité acide enough Pas assez Pas assez Not sour Assez acide Acide Sour acide acide enough Pas assez Not sour Pas acide Pas acide Not sour Pas trop acide acide enough Relativement Absence Acide Pas acidite Not sour Sour acide d’acidité Bien acide Acide Sans acidité Pas acidite Not sour Sour Bonne acidité Acide Forte acidité Très acide Too sour Sour Trop fort Plutôt acide Acide Très acide Too sour Sour acidité Acidité trop Sans acidité Pas acide Not sour Très acide Too sour prononcée Beaucoup Acidité Très acide Too sour Très acide Too sour acide extreme Un peu A little Léger acidité acide sour 50.
(53) Pas très acide Très acide. Un peu acide Très acide. Ausencia de acidez. No ácida. Poco ácida. Un poco ácida. Más bien ácida Levemente ácida Ligeramente ácida. Acida. Un poco ácida Un poco ácida Un poco Algo ácida ácida Con cierta Un poco acidez ácida Falta de acidez No ácida Bien ácida Acida Buena ácidez Acida. A little sour Too sour Spanish comment Demasiado Not sour ácida A little Muy ácida sour Excesivament Sour e ácida A little Poca acidez sour Acidez A little marcada sour A little Ácido intenso sour A little Sin acidez sour Not sour Sour Sour. Muy ácida Too sour Muy ácida Too sour Muy ácida Too sour No ácida. Not sour. Muy ácida Too sour Muy ácido Too sour No ácida. Not sour. 934 935. 51.
(54) 52.
(55) Table 3. Mean of the total words used by consumers in each country to answer questions 4 through 7_2.. Question. Please mention three characteristics or more that you think best define the quality of an apple. Please mention all positive visual characteristics that you like finding in an apple. Please mention all negative visual characteristics that you dislike finding in an apple. Please mention all positive flavor characteristics that you like finding in an apple. Please mention all negative flavor characteristics that you dislike finding in an apple.. p-Value. Average of citation per consumer per country. Consumption Code Country Level. Consumption Level x Argentina France Country. Average of citations of all consumers per frequency of consumption From Two or Once or once a Every three twice a month Day times a week to less month often. Q04. 0.011. 0.040. 0.231. 3.32 a. 3.14 b. 3.42 a. 3.27 a. 3.24 ab. 2.98 b. Q05_1. 0.531. < 0.001. 0.359. 2.77 a. 2.31 b. 2.59 ns 2.62 ns 2.57 ns. 2.4 ns. Q05_2. 0.022. < 0.001. 0.981. 2.66 a. 2.17 b. 2.55 a. 2.47 a. 2.57 a. 2.08 b. Q06_1. < 0.001. 0.144. 0.940. 2.72 ns*. 2.56 ns. 2.98 a. 2.69 b. 2.67 b. 2.23 c. Q06_2. 0.007. 0.030. 0.654. 2.26 a. 2.03 b. 2.39 a. 2.14 b. 2.23 ab. 1.84 c. 53.
(56) Please mention all positive texture characteristics that you Q07_1 like finding in an apple. Please mention all negative texture characteristics that you Q07_2 dislike finding in an apple.. 0.085. 0.095. 0.934. 1.77 ns. 1.64 ns 1.85 ns 1.70 ns 1.71 ns 1.55 ns. 0.145. 0.007. 0.888. 1.69 a. 1.48 b. 1.71 ns 1.58 ns 1.61 ns 1.43 ns. *ns: not significant Lower case letters indicate significant differences (p<0.05) according to Student Neuman-Keuls.. 54.
(57) Table 4. Mean of the total words used by consumers in each cultivar knowledge category in each country to answer all the questions. Average of consumers' citations per cultivar knowledge category. p-Value Knowle Questi Country dge on France Argenti na. < 0.001 < < 0.001 0.001 0.008. Knowled Non ge x e Question 0.139 0.782. 2.16 a. One to four. Five to nine. More than ten. 2.06 a. 2.15 a. 2.31 b. 2.41 b. 2.69 c. 55.
(58) Highlights. Juicy, tasty, firm and fresh defined apple quality in both countries. Each population also had its own terms for describing quality, likes and dislikes. Frequent consumers were more descriptive for flavor, than for visual or texture categories. Comment analysis was used to find terms describing likes and dislikes separately.. 56.
(59)
Figure


Documento similar
The general objective of this work was to study how parameters of in vitro sperm quality and characteristics of dairy goats may affect the in vivo fertility obtained after
pomonella in three areas of apple production in Spain with two completely different management systems and to determine the efficacy of some new insecticides in controlling codling
When correlations were run for non-Syrphidae predators from the RAA colonies, significant positive correlations were found between these and the phytophagous insects from the
With all this in mind, and to gain a deeper understanding of consumers’ consumption of blond and blood oranges, this study investigates their market availability, the importance
The expansionary monetary policy measures have had a negative impact on net interest margins both via the reduction in interest rates and –less powerfully- the flattening of the
Jointly estimate this entry game with several outcome equations (fees/rates, credit limits) for bank accounts, credit cards and lines of credit. Use simulation methods to
In our sample, 2890 deals were issued by less reputable underwriters (i.e. a weighted syndication underwriting reputation share below the share of the 7 th largest underwriter
The perception of all the sensory attributes studied was different between the apples grown at high and low altitudes regardless of the apple cultivar (except for sweetness in
