Movement patterns of the seastar Heliaster helianthus in central Chile: relationship with environmental conditions and prey availability
16
0
0
Texto completo
(2) 648. characteristics of the habitat (Lipcius and Hines 1986). (2) Numerical responses, which involve changes in the rates of reproduction and/or mortality associated with prey consumption, that are normally expressed over larger spatial and temporal scales (Arditi and Ginzburg 1989; Abrams 1994; Gurney and Nisbet 1998). (3) Developmental responses, in which, for example, individuals grow faster in response to prey, without showing an immediate increase in reproduction (Murdoch 1971; Murdoch and Oaten 1975). The seastar Heliaster helianthus (Lamarck), hereafter named Heliaster, is the most conspicuous predator of rocky intertidal habitats along the coasts of north-central Chile and southern Peru (Castilla and Paine 1987; Tokeshi 1989a). By consuming and controlling the abundance of a dominant intertidal mussel, Perumytilus purpuratus (Lamarck), this seastar plays a key role in the structure of rocky shore communities at many sites in central Chile where mussel recruitment is high (Paine et al. 1985; Navarrete and Castilla 2003; Navarrete et al. 2005; Navarrete and Manzur 2008). Except for occasional predation by seagulls (Castilla 1981), juveniles and adults of Heliaster have virtually no predators in wave-exposed intertidal benches, although they are preyed upon by other seastars in shallow subtidal habitats (Gaymer and Himmelman 2008). Patterns of Heliaster mussel prey selection (Tokeshi 1989b) and variation in diet composition across sites and in response to variation in prey availability (Navarrete and Manzur 2008) have been documented. However, there is scarce to no knowledge about the patterns and rates of displacement of Heliaster in the field, and how these important behavioral traits vary with respect to differences in prey availability or different environmental conditions. This information is critical to understand how intertidal predators, especially those that play key roles in prey communities, can compensate for variation in prey availability, which can be largely driven by predatorindependent changes in prey recruitment (Navarrete and Menge 1996; Wieters et al. 2008). Feeding and predator displacement rates constitute two of the most important plastic behavioral responses that allow individuals to respond quickly to differences in abundance or movement of prey, predation risk and abrupt changes in environmental conditions. For example, in coastal marine systems, Robles et al. (1995) experimentally modified the recruitment of the mussel Mytilus californianus (White) and within a few days observed the formation of dense aggregations of the key seastar predator Pisaster ochraceus (Brandt) in the area of increased prey recruitment, whereas densities were reduced in the area of low prey recruitment. A large increase in density of Asterias vulgaris (Verrill) following a massive recruitment of mussel prey also seems to be produced in part by rapid. 123. Mar Biol (2010) 157:647–661. movement and aggregation (Witman et al. 2003). Similarly, Keesing and Lucas (1992) showed that Acanthaster planci (Linnaeus) moved three times as much in areas of low coral prey cover (\10%) than in areas of greater coral food availability ([30% cover). Models of consumption under environmental stress predict reduced predation intensity mainly due to the environmental effects on individual predator movement and the energy costs associated with capturing and consuming prey (Menge and Sutherland 1987; Menge and Olson 1990). Wave intensity, temperature and desiccation are the most important environmental factors that affect the intensity of predation in rocky intertidal systems. For example, Menge (1978) observed a decrease in foraging distance of the snail Thais lapillus (Linnaeus) at sites with high wave exposure, and Navarrete and Berlow (2006) showed that foraging excursions and effective predation on barnacles by two welk species, Nucella canaliculata (Duclos) and Nucella ostrina (Gould), are greatly restricted by desiccation stress. Similarly, Robles et al. (1995) reported that P. ochraceus remains inactive during storms and, through laboratory experiments, Gagnon et al. (2003) showed that displacements of the seastar A. vulgaris are twice as large in the absence of wave action. Several laboratory and field studies have documented reduced feeding rates of marine invertebrates with decreased seawater temperature (Garton and Stickle 1980; Moran 1985; Stickle et al. 1985). Through field observations and experiments, Sanford (1999, 2002a, b) showed that P. ochraceus reduced its predation on M. californianus when water temperature decreased *3°C during upwelling events. The effects of natural variation in temperature have also been reported in the movement of the freshwater decapod Pacifastacus leniusculus (Dana; Bubb et al. 2002, 2004) and the incursions of the blue crab Callinectes sapidus (Rathbun) to the intertidal zone (Fitz and Wiegert 1991). In this study, we developed a marking method that allows us to identify and follow individuals of Heliaster over time in order to estimate rates of displacement and feeding at different sites. Here, we define displacement as the net distance an individual moves between two successive observations. We evaluate the following hypotheses: (1) at sites with low availability (cover) of the principal prey P. purpuratus, seastars exhibit greater displacements and consume a greater proportion of other prey, such as mobile species than at sites with higher mussel availability, (2) there is a significant relationship between per capita displacements of Heliaster and sea surface temperature (SST) and (3) daily displacement of Heliaster will decline with increasing wave exposure during winter months..
(3) Mar Biol (2010) 157:647–661. 649. Materials and methods Site selection and abundance of the main prey The study was conducted between September 2005 and June 2008 at six wave-exposed sites scattered along about 600 km of the north-central Chilean coast, between 28 and 34°S (Fig. 1a). The tidal regime in north-central Chile is semi-diurnal and not mixed, and therefore low tides of. Fig. 1 a Map of the study region along the coast northcentral Chile, indicating the location of study sites and abbreviations used in figures and text. b Schematic of the methodology use for marking Heliaster individuals. The marking system used the madreporite on the aboral surface as a reference point (arm numb. 1) and then arms were counted and marked clockwise on the oral surface. The seastar number 10 is shown as example. roughly similar magnitude occur every 12 h separated by one high tide (Finke et al. 2007). Sites were chosen for having moderate to high densities of Heliaster, extensive continuous rocky platforms with roughly similar inclination of substrate and similar wave exposure (Broitman et al. 2001; Navarrete et al. 2008). Sites had contrasting availability (cover) of the adult mussel P. purpuratus, the most important species in Heliaster diet in terms of frequency and contribution to total prey biomass. (a) 28°S Huasco (Hu). 29°S 0°S 30°S. Guanaqueros (Gn). Punta de Talca (PT). 20°S. Bahía Azul (BA). 40°S. 31°S. 32°S. 33°S. ECIM 60°S 80°W. Las Cruces (LC). 60°W. 40°W. 34°S 73°W. 72°W. (b). 71°W. Madreporite 1. Numbered clockwise. Buccal region. 10. 123.
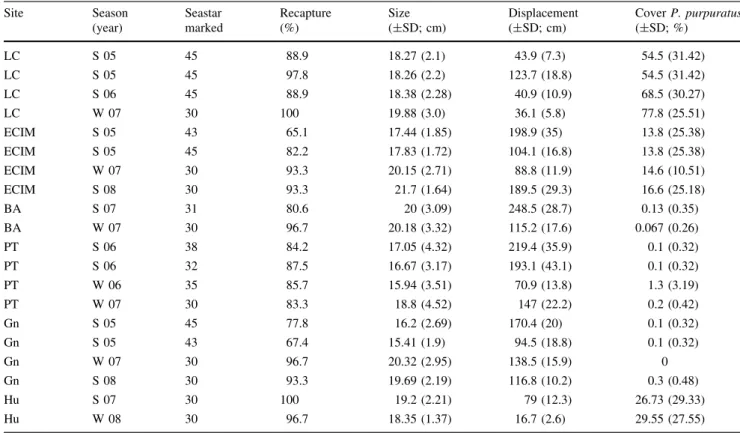
(4) 650. Mar Biol (2010) 157:647–661. (Paine et al. 1985; Navarrete and Manzur 2008). Since it is very difficult to do experimental manipulations of prey availability at scales large enough to observe responses from predators as large as Heliaster, we used the large and highly persistent natural variation in abundance of the main prey across sites (Navarrete et al. 2005, 2008) to evaluate whether differences in predator daily displacement were consistent with differences in prey abundance. The cover of P. purpuratus was estimated using 10 quadrats of 50 cm 9 50 cm randomly arranged along transects 10–20 m long placed parallel to the coastline in the mid intertidal zone. Surveys were conducted every 3– 4 months at all sites, and since the interest was on relative differences among sites (see Navarrete et al. 2005; Navarrete and Manzur 2008), data were averaged to obtain an estimate of site-level mussel abundance (Table 1). For more details of the sites, patterns of community structure and sampling methods, see Broitman et al. (2001), Navarrete et al. (2002, 2005, 2008) and Rivadeneira et al. (2002). Marking technique, displacement and feeding of Heliaster To characterize individual displacement, frequency of individuals feeding and diet composition of individuals, we. conducted mark-recapture surveys at the selected study benches of each site. To mark and identify individuals in the field we used the vital stain Blue NileÒ (Loosanoff 1937; Feder 1955). The methodology used to apply the stain was developed in laboratory studies at the marine station (ECIM) of the Pontificia Universidad Católica de Chile, at Las Cruces, where the duration of different vital stains, as well as the effects of different application methodologies on the behavior, growth and survival of marked Heliaster individuals, were evaluated over a 10month period (S. A. Navarrete and A. Masuero, unpublished data). Because Heliaster has multiple arms (average 35), it was possible to apply the stain on the oral surface of the distal end of the arms and assign unique numbers to individuals using a combination of one, two or three arms, which were marked and numbered clockwise in relation to the madreporite (Fig. 1b). Every marked seastar was measured (maximum diameter in cm) and weighted (g). Later, individuals were returned to the same place from which they were removed and their position recorded (see below). Only adult individuals ([6.5 cm diameter) are found at the wave-exposed platforms chosen for this study (Manzur et al. 2009). To correctly identify individuals, it was necessary to remove them from the substratum and examine the oral surface.. Table 1 Summary of surveys conducted to measure displacement of Heliaster helianthus at 6 different sites along the coast of central Chile Site. Season (year). Seastar marked. Recapture (%). Size (±SD; cm). Displacement (±SD; cm). LC. S 05. 45. LC. S 05. LC. S 06. LC. W 07. 30. 88.9. 18.27 (2.1). 43.9 (7.3). 54.5 (31.42). 45. 97.8. 18.26 (2.2). 123.7 (18.8). 54.5 (31.42). 45. 88.9. 18.38 (2.28). 40.9 (10.9). 68.5 (30.27). 19.88 (3.0). 36.1 (5.8). 77.8 (25.51). ECIM. S 05. 43. 65.1. ECIM. S 05. 45. 82.2. 17.44 (1.85). 198.9 (35). 13.8 (25.38). 17.83 (1.72). 104.1 (16.8). ECIM. W 07. 30. 13.8 (25.38). 93.3. 20.15 (2.71). 88.8 (11.9). 14.6 (10.51). ECIM BA. S 08 S 07. 30 31. 93.3 80.6. 21.7 (1.64) 20 (3.09). 189.5 (29.3) 248.5 (28.7). 16.6 (25.18) 0.13 (0.35). BA PT. W 07. 30. 96.7. 20.18 (3.32). 115.2 (17.6). 0.067 (0.26). S 06. 38. 84.2. 17.05 (4.32). 219.4 (35.9). 0.1 (0.32). PT. S 06. 32. 87.5. 16.67 (3.17). 193.1 (43.1). 0.1 (0.32). PT. W 06. 35. 85.7. 15.94 (3.51). 70.9 (13.8). 1.3 (3.19). PT. W 07. 30. 83.3. 18.8 (4.52). 147 (22.2). 0.2 (0.42). Gn. S 05. 45. 77.8. Gn. S 05. 43. 67.4. 15.41 (1.9). 94.5 (18.8). Gn. W 07. 30. 96.7. 20.32 (2.95). 138.5 (15.9). Gn. S 08. 30. 93.3. 19.69 (2.19). 116.8 (10.2). Hu. S 07. 30. 19.2 (2.21). 79 (12.3). Hu. W 08. 30. 100. 100 96.7. 16.2 (2.69). 18.35 (1.37). 170.4 (20). 16.7 (2.6). Cover P. purpuratus (±SD; %). 0.1 (0.32) 0.1 (0.32) 0 0.3 (0.48) 26.73 (29.33) 29.55 (27.55). The season (S summer, W winter) and year of surveys, number of seastars marked, recapture rate, their size (maximum diameter), average daily displacement and average cover of the main mussel prey are presented. Site abbreviations as in Fig. 1a. 123.
(5) Mar Biol (2010) 157:647–661. An exhaustive survey was conducted along the entire bench and nearby rocky areas, including shallow channels and sides of boulders and rocky promontories. When a marked seastar was encountered, the assigned number, position relative to release point (X–Y coordinates), feeding activity (feeding or not), microhabitat (pool, crevice, flat rock, etc.) and, if the seastar was eating, the prey were identified. Seastar position was measured using a Cartesian coordinate system, in which a reference axis (x-axis) was permanently fixed parallel to the coastline using stainless steel screws. The y-axis coordinate corresponded to the position of marked individuals at right angles from their location to the reference x-axis. The distance travelled by an individual between successive recaptures (displacement), corresponded to the Pythagoras diagonal (D) between respective position coordinates (D = HDX2 ? DY2), assuming that individuals move in a straight line between successive points. Potential artifacts of manipulation To evaluate the effect of experimental handling (lifting from the substratum to identify them) and marking on seastar behavior and movement, continuous field observations of marked and undisturbed (control) individuals were performed at Las Cruces. We selected a relatively waveprotected area about 300 m from the main study site at Las Cruces, which allowed us to follow from a distance a small number of unmarked individuals during the incoming tide. At the beginning of a low tide, 12 seastars occupying a rocky platform similar to those utilized in the markrecapture surveys were randomly assigned to either (a) experimental marking, in which individuals were manipulated as described above, or (b) control, in which individuals were left undisturbed and identified by distinctive external characteristics (size, color, number of arms). The initial position of each seastar was marked with submarine epoxy (ÒSuper As) glued to the rock, and the straight-line distance travelled by each individual from its initial position was measured at intervals of 0.33, 2, 5, 9 and 12 h. After about 3 h of observations, individuals were covered by the incoming tide and were at least partly covered with water until the monitoring conducted 9 h after observations began. Because of the uncertainty in the identification of unmarked individuals, it was not possible to continue observations after 12 h (after a night high tide). For each interval, we calculated the net distance moved by an individual from the previous observation (‘displacement’) as well as the total displacement from first sight of the individual (cumulative for the 12 h period). We compared the displacement observed between 9 and 12 h after application of the stain, as well as the cumulative displacement from first sight using separate Student t-tests.. 651. Tests were conducted on raw data as residuals showed approximately normal distribution and an F-max test showed homogeneous variances. Movement patterns Since seastars remain largely immobile during aerial exposure (although they continue feeding, authors pers. obs.), we determined whether individuals exhibited a preferred direction of movement by examining the displacement of the same 45 marked individuals 12 h and then again 24 h after the initial sighting, at each of three sites: Las Cruces, ECIM and Guanaqueros. The directionality in movement was assessed by obtaining the angles of displacement from the X–Y coordinates for surveys at 12 and 24 h from the initial encounter, and testing whether these angles were uniformly distributed around the 360° circle (expected when direction of movement is random) with the Rayleigh test (Zar 1999). To further determine whether individual movement is approximately random, we calculated the displacement after 24 h (distance between first observation and 24 h later) against the average displacement of the individuals after the 12-h periods. Since under the assumption of random walk, the expected linearpffiffiffiffiffiffi distance traveled after a given period of time, t, is D^ ¼ 2tc, where c is the coefficient of diffusion (Gardiner 1985), we pffiffiffiffiweighted the original distances dividing by the factor 2t. Since the same individuals were measured between 12 and 24 h periods, a repeated measures ANOVA was pused ffiffiffiffi to compare the weighted displacement rates, D= 2t, between periods (‘within subjects’) and among sites (‘between subjects’). Assuming that the coefficient of diffusion remains constant between successive observations, lack of significant differences in displacement between periods suggests that movement is not different from a random walk. Daily displacement and feeding of Heliaster Once marked and released, between 30 and 45 seastars were measured once at 24 and 48 h after the initial encounter at each site. Preliminary studies showed that periods of 24 h allowed accurate estimates of displacement while reducing the effects of manipulation (see ‘‘Results’’). Therefore, comparisons of displacement among sites and correlations with environmental conditions were based on displacement in 24-h periods. At each of the six sites, we conducted between 1 and 4 separate surveys on different dates and seasons of the year. The separation between sites did not allow us to conduct these surveys at the same time at all sites, so that some sites were sampled just once on a given season (Table 1). Since during each survey the displacement of the same individuals was measured more than. 123.
(6) 652. once (24 and 48 h after the first encounter), data analyses were performed on the average daily displacement by an individual. To determine whether there were differences in daily displacement among sites, we used a nested ANOVA on (log ? 1) transformed data (to achieve homogeneity of variances) with date of ‘‘survey’’ nested within site and individual displacements nested within surveys. Considering the low number of surveys per site and that they were conducted on different dates and seasons, this comparison provided a conservative test for the effect of site and a more powerful test for differences among surveys within sites. Because some sites were sampled only once during a given season, we could not conduct a factorial analysis to test for seasonal differences in movement and among sites. To determine whether there were differences in daily displacement between seasons, we first averaged all observations within a given survey to provide an average displacement per survey and site (Dij ), and then fitted the linear model Dij ¼ D þ Sitei þ residualij to remove the overall mean displacement and the effect of site. Residuals for each survey were then assigned to season (springsummer or fall-winter) and compared using a one-way ANOVA. The relationships between local availability of the principal mussel prey P. purpuratus (mean percentage cover), average Heliaster displacement and proportion of feeding individuals were assessed by Pearson linear correlations or Spearman rank correlation when the relationship was nonlinear. To examine the potential effect of seastar density on daily displacement, we counted the number of individuals within the survey area and divided by the total area sampled at each site.. Mar Biol (2010) 157:647–661. daily displacement. During each survey, 5 wave dynamometers were anchored to the rock surface in the mid intertidal zone at each site and maximum wave force was measured every 24 h for the same days in which Heliaster displacement was measured. The dynamometers were of the same type as those developed by Bell and Denny (1994) and Denny (1995). The relationship between mean daily seastar displacement and the environmental variables (i.e. temperature, waves) was evaluated through simple linear regression in the following manner. Since the independent variables (wave force, temperature) varied between the two consecutive days of observation (24 and 48 h), but many of the same Heliaster individuals were measured during this same period, we first examined whether differences in individuals’ movement between days were correlated with differences in temperature or wave force over the same days. Secondly, we averaged movement and environmental variables over the 2 days within each survey and conducted linear regressions over these averages. To compare the importance of the different biological (cover of mussel P. purpuratus) and environmental factors (SST, maximum wave force) on seastar displacement, a multiple linear regression model was fitted. Furthermore, a stepwise regression analyses (forward and backward modes) was performed to determine which variables provided a significant improvement to the model. Since we did not have a complete wave force data for summer surveys at all sites (except at ECIM and Guanaqueros), we also fitted a reduced model including only SST and mussel cover across all surveys.. Results Quantification of environmental conditions Effects of manipulation We tested whether variation in seastar displacement was associated with changes in water temperature and/or wave forces. At each site (except Bahı́a Azul), a data-logger (Tidbit, Onset Computer Corp.) was installed in the shallow subtidal zones (1–2 m deep) to record in situ water temperature every 10 min (see Narváez et al. 2006). For each season and site combination, mean daily temperatures were calculated for those days in which we conducted the mark-recapture surveys, as well for the 2 days before the surveys. To quantify the intensity of wave forces in intertidal habitats, we recorded the maximal wave force at all sites during winter months and during one summer survey at ECIM and Guanaqueros. While the scarce summer data do not represent well the variation in waves during summer, winter months are usually characterized by larger and more frequent swell and allowed us to examine its effects on. 123. The methodology applied for marking individual seastars produced a temporary and weak alteration of movement. Marked individuals moved about 10–15 cm more than undisturbed individuals during the first 33 min following the marking procedure, they then remained immobile for 1.5 h (2 h from beginning) and moved again around 20 cm in the next 3 h while covered by water (5 h from the beginning, Fig. 2a). Control animals moved less than 10 cm over this period. However, after 9 h, the net displacement of marked and control individuals was similar (0 cm for both groups); and after 12 h, the displacement of the control group was not significantly greater than that of the marked individuals (Fig. 2a, t[10] = 0.78, P = 0.48). Because of the initial differences in Heliaster movement, the cumulative displacement after 12 h was 20 cm greater for marked than for undisturbed individuals.
(7) Mar Biol (2010) 157:647–661. 653. between consecutive periods but significant differences among sites (Table 2). The expected displacement under the assumption of linear (directional) movement and constant speed between periods is also presented (dotted horizontal line in Fig. 3d–f).. Net displacement (cm). (a) 35 30 25 20 15 10 5 0. Manipulated Control. Daily displacements and feeding of Heliaster 0 0.33. Cumulative displacement (cm). (b). 0. 0 0. 2. 5. 9. 12. 2. 5. 9. 12. 60 50 40 30 20 10 0 0.33. Time elapsed (h) Fig. 2 Effect of manipulation (marking) on individuals movement through 12 h of observations at Las Cruces. Once manipulated displacement was measured as straight line 0.33, 2, 5, 9 and 12 h later. a Net displacement (?SE) corresponding to the distance moved between successive intervals. b Cumulative displacement (?SE), corresponding to the total distance moved after 12 h from first sight. N = 6 individuals for two groups (manipulated and control). (Fig. 2b), but the difference (t[10] = 1.29, P = 0.40).. was. not. significant. Movement patterns Of the 45 individuals initially marked, the average number recaptured in the 12 h periods were 42 at Las Cruces, 39 at ECIM and 37 at Guanaqueros. For comparisons of angles of displacement and displacement rates between 12 and 24 h, we did not consider individuals that remained immobile between measurements (displacement = 0). Therefore, sample sizes for these analyses were 10 at Las Cruces, 27 at ECIM and 28 at Guanaqueros. The distribution of the angles of displacement between consecutive low tides showed that there is no preferential direction of movement at any of the sites (Fig. 3a–c). The Rayleigh test showed that angle distribution was not significantly different from uniform (Rayleigh test P [ 0.05). A comparison of the displacement measured after 12 and 24 h showed that, despite marked differences in average displacement among sites, seastar movement does not differ from the expectation based on a random walk at any of the sites (Fig. 3d–f, segmented horizontal line). Consequently, a repeated measures ANOVA on weighted pffiffiffiffi displacement (D= 2t) showed no significant differences. Recapture of marked individuals was higher than 65% in all surveys and sites (Table 1). The frequency distribution of daily displacements (sites pooled, n = 635) followed a skewed pattern in which short distance daily displacements (\1 m) were the most frequent (&58%), whereas displacements over 5 m were unusual (Fig. 4a). The greatest daily displacement observed by an individual was 14 m (Fig. 4a). Seastars exhibited differences in daily displacement among sites (Fig. 4b; Table 3), and Heliaster moved much shorter distances at Las Cruces and Huasco than at the remaining sites (Fig. 4b). In addition, significant variation was observed among the different surveys conducted within sites (Table 3). The analysis of the residuals of the different surveys, after removing the effect of site, showed that seastar displacements were significantly shorter in winter than in summer surveys (Fig. 4c, one-way ANOVA, F = 6.44, df = 1, 14, P = 0.023). On the other hand, seastar densities differed across sites between 0.5 ind/m2 at Las Cruces and 1.2 ind/m2 at Huasco, with comparatively little seasonal variation (LC-S = 0.49, LC-W = 0.51, ECIM-S = 0.77, ECIM-W = 0.68, BA-S = 0.88, BAW = 0.85, PT–S = 0.68, PT-W = 0.72, Gn-S = 0.83, Gn-W = 0.79, Hu-S = 1.18, Hu-W = 1.1 ind/m2). For more details, see Navarrete and Manzur (2008). Daily seastar displacement was not correlated with the mean density of individuals at a site (r = 0.062; P = 0.900). An inverse relationship between the average cover of P. purpuratus per site and the average daily displacement of Heliaster was observed across sites (Fig. 5a). There was a significant trend of diminishing magnitude of Heliaster displacements with increasing P. purpuratus cover in winter months (Fig. 5a, P = 0.012) and a similar trend, although not significant (P = 0.071), in summer months (Fig. 5a). There was a general tendency of increasing the proportion of individuals found feeding (considering all prey) with increasing magnitude of Heliaster displacement recorded during a given survey (Fig. 5b, P = 0.002). Changes in diet composition among sites were related to the availability of mussels (Fig. 6). The proportion of mobile prey found in individuals observed feeding during the surveys also tended to increase with the magnitude of displacements, but this relationship was non-significant (Fig. 5b, P = 0.062).. 123.
(8) 654. Mar Biol (2010) 157:647–661. (a). (b). 0 330. 30. 300. 330 60. 270. 0 10. 0. 90. 210. 60. 270. 0 20. 0. 90. 150. 210. 60. 270 0. 90. 0 70. 120 210. 150. (e). 0 35. 240 150 180. 180. (d) 300. 30. 300. 0 40. 120. 240. 180. Displacement (cm). 0 20. 0 330. 30. 300. 120. 240. (c). 0. (f). 250 200 150 100 50 0 12h. 24h. 12h. 24h. 12h. 24h. Period of time (h) Fig. 3 Top panels show polar plots with the angles of movement between two successive low tides (ca. 12 h periods) at Las Cruces (a), ECIM (b) and Guanaqueros (c). Concentric circles is the scale of displacement in cm. Observations were taken on two 12-h periods (solid circles = first 12 h period, open circles = second 12 h period). Bottom panels show the average displacement distance measured. after 12 and 24 h at Las Cruces (d), ECIM (e) and Guanaqueros (f). The expected displacement distance after 24 h under the assumption of random walk (segmented line) and directional (linear) movement (dotted line) are shown. N = 10 at Las Cruces, 27 at ECIM and 28 at Guanaqueros (see text for details). Table 2 Repeated measures ANOVA to compare the effect of period of monitoring (12 vs. 24 h, within subject factor) on the weighted average rate of Heliaster pffiffiffiffi displacement under the assumption of random movement D= 2t across sites (between subject factor). Seasonality, temperature and wave force effects on Heliaster displacement. Source of variation. df. Sum of squares. F. P. 4.14. 0.0206. Between subjects Site Error 1. 2. 8.245. 62. 61.797. Within subjects Period Site 9 period Error 2. 1. 0.483. 2.57. 0.1143. 2 62. 0.195 11.662. 0.52. 0.5980. Sites were Las Cruces, ECIM and Guanaqueros. Bold face indicates significant differences at alpha = 0.05. The proportion of mobile prey in the diet of Heliaster (out of those observed feeding) was negatively related to the cover of the mussel P. purpuratus (Fig. 5c, P = 0.029). This suggests that when mussel cover is low, an increased proportion of Heliaster individuals consume mobile prey (Fig. 5c).. 123. Differences in environmental conditions (temperature, wave forces) from 1 day to the next during a given survey were not associated to differences in displacement of individuals over the same days (Fig. 7, inserts). We thus averaged environmental conditions and individual displacement for the 2 days within surveys. Despite the observed seasonal variation in individual displacement, there was no relationship between average daily displacement and average SST measured in the same day of the surveys (P = 0.735), or with the average temperature registered the previous 2 days (P = 0.843; Fig. 7a). Maximum wave forces on a given day varied between 15.56 and 49.86 N (average of five dynamometers) across sites and surveys. The average wave force recorded during the surveys was a good predictor of average seastar displacement during those surveys (P = 0.012, Fig. 7b), as individuals moved shorter distances on days of stronger wave action..
(9) Mar Biol (2010) 157:647–661. Frequency (%). (a). 655 Table 3 Nested ANOVA to compare Heliaster displacement among sites, with surveys conducted on different dates nested within sites and individual displacement nested within surveys (residual). 25 20. Source of variation Site 10. Survey (site) Error. 5. Sum of squares. F. P. 5. 295.258. 5.79. 0.0091. 10. 101.991. 5.09. 0.0001. 619. 1,241.028. Bold face indicates significance at alpha = 0.05 0 10 0 20 0 30 0 40 0 50 0 60 0 70 0 80 0 90 0 10 0 11 0 0 12 0 00 13 0 14 0 00 15 0 16 0 00. 0. Displacement (cm d-1 ). (b) Displacement (cm d-1 ). df. 15. 300. Summer Winter. 250. the best explanatory variable was wave force followed by mussel cover and SST. Fitting a reduced model considering only SST and mussel cover (which includes more summer surveys for which we did not have wave force data), again showed that only mussel cover enters the model (P = 0.0005) and the SST is not significant (P = 0.564).. 200 150. Discussion. 100 50 0 LC. ECIM. BA. PT. Gn. Hu. Site. (c) Residuals of displacement (cm). 40 20 0 -20 -40 -60. Winter. Summer. Fig. 4 Results of field measurements of daily displacements of Heliaster. a Frequency distribution of daily displacements per individual across the six monitoring sites (n = 635). b Average displacement (?SE) at each site and season (summer, winter). Bars without error bar correspond to seasons with only one survey (see Table 1). Number of individuals measured were 124 LC-S, 30 LC-W, 96 ECIM-S, 28 ECIM-W, 25 BA-S, 34 BA-W, 67 PT–S, 49 PT-W, 93 Gn-S, 29 Gn-W and 30 Hu-S, 30 Hu-W. Site and season abbreviations as in Table 1. c Residuals of daily displacements after removing effects of site for summer and winter surveys across the region. N = 13 summer surveys and 7 winter surveys. Results from stepwise multiple regression including SST, wave forces and mussel cover showed that variation in Heliaster displacements are significantly related to maximum wave force and the local cover of P. purpuratus, while sea surface temperature was not significant and did not enter the model (Table 4). These results coincide with those obtained in the simple linear regressions, in which. Our results show that, although within sites the movement of the keystone seastar H. helianthus does not differ from a random walk, there is high spatial (among sites) and seasonal variation in the rates of displacement and that this phenotypic variation is significantly related to the availability (cover) of its main prey species, the mussel P. purpuratus, and the maximum wave forces experienced by individuals. Low availability of the main mussel prey was related to greater individual displacements and a greater proportion of them feeding on other prey and a tendency to incorporate more mobile prey species in their diet. This suggests that Heliaster can respond to the availability of its preferred prey by modifying its displacements and diet composition, increasing the consumption of other prey. Moreover, while there was a seasonal increase in daily displacement of Heliaster in summer months, the same response was not observed with changes in temperature over short timescales. Effects of manipulation Results show that the manipulation of individuals to mark them produced a rapid, yet transient alteration in the movement of Heliaster, which was more clearly observed only within 40 min of being manipulated. Slight differences between marked and unmanipulated individuals were observed for the first 5 h following the manipulation. Nine hours later, displacement of marked and unmarked individuals was similar (Fig. 2a). This suggests that the effect of manipulation is short lived and that over periods of time longer than about 9 h, the initial manipulation will not alter estimates of displacement. It also suggests that individuals should not be manipulated (removed from the substratum). 123.
(10) 656. (a) Displacement (cm d-1). 300 250 200. Summer = solid symbols r = 0.77; p = 0.071. 150. Winter = open symbols r = 0.91; p = 0.012. 100 50 0 0.0. 0.5. 1.0. 1.5. 2.0. (b) 100. 100. 80. 80. 60. 60. 40. 40. 20. 20. 0. 0 0. 50. 100. 150. 200. 250. 300. Heliaster eating mobile prey / total feeding * 100. Log % cover P. purpuratus. Heliaster feeding/ total observed * 100. Fig. 5 a Field measurements of Heliaster daily displacement and the cover of the mussel Perumytilus purpuratus at a given site in winter (open symbols) and summer months (solid symbols). Open and closed diamonds LC, open and closed circles ECIM, open and closed squares BA, open and closed stars PT, open and closed triangles Gn, upsidedown triangle Hu. Site abbreviations as in Table 1. Sample sizes as in Fig. 4b. b Average daily displacement of Heliaster versus the frequency (%) of individuals observed feeding during the surveys (solid circles) and the proportion of mobile prey in the diet of Heliaster out of those individuals feeding (open circles). Sample size = 20 surveys. c Mussel cover and proportion of mobile prey in the diet of Heliaster (both expressed as ranks). Sample size = 20 surveys. The Pearson correlation (r) or Spearman rank correlation (rs) and probability (P) are also shown in the panels. Mar Biol (2010) 157:647–661. Heliaster feeding r = 0.65; p = 0.002 Heliaster eating mobile prey rs = 0.42; p = 0.062. -1. Displacement (cm d ). Rank (Heliaster eating mobile prey/ total feeding). (c) 25 20 15. rs = 0.49; p = 0.029. 10 5 0 0. 5. 10. more than twice a day and that the technique used here should not be used to assess movement over short time intervals (e.g. hours). In our study, we measured displacement over periods of 12 and 24 h, thus minimizing the effect of manipulation. Unfortunately, it was not possible to track control (unmanipulated) individuals for periods of 24 h or more because identification in the field after a night high tide was too uncertain. Movement patterns Analyses of the direction of movement (angles) and distances traveled between two consecutive low tides (12 h. 123. 15. 20. 25. Rank (cover P. purpuratus ). periods) suggest that movement of Heliaster, over this timescale, is not significantly different than that expected for a random walk, i.e. there is no evidence of ‘homing behavior’ or directional movement. While continuous changes in direction allow individuals to remain within a given area, especially in areas of high prey availability (McClintock and Lawrence 1985), several studies on seastars have shown directional patterns of movement (Scheibling 1980, 1981; McClintock and Lawrence 1985; Keesing and Lucas 1992). The latter has been considered a strategy to prevent foraging on the same area and increase foraging range (McClintock and Lawrence 1985). Since our observations consist of changes in position of.
(11) Mar Biol (2010) 157:647–661 n = 55. n = 37. n = 63. 657 Las Cruces. n = 68. ECIM. 100. 100. 50. 50. 0. 0. Bahía Azul. n = 52. Punta de Talca. 100. 100. 50. 50. 0. 0. Guanaqueros. n = 17. Huasco. 100. 100. 50. 50. 0. 0. Perumytilus Brachidontes. Semimytilus Balanids. Chthamalids Mobile prey. Fig. 6 Diet composition (pie charts) of the intertidal seastar Heliaster heliantrhus at six different sites in central Chile. The charts are based on the number of different individuals observed feeding (n) during surveys conducted in winter and summer months as indicated in. Table 1. The accompanying histograms show the average cover of the mussel Perumytilus purpuratus in the same study areas. The y-axis in all histograms ranges from 0 to 100% cover. individuals between consecutive low tides after they forage for prey at high tide, we cannot reach conclusions regarding movement patterns and prey choices while individuals are foraging. Higher frequency studies are clearly needed to better understand foraging strategies and movement in this and other intertidal invertebrate species, particularly in wave-exposed habitats.. up to 23 m/day. Similarly, Pabst and Vicentini (1978) conducted experiments of migration on the seastar Astropecten jonstoni (Delle Chiaje) and estimated that the average distance travelled by individuals is 4.5 m/day and the maximum 28 m/day. Working with aggregations of the asteroid Oreaster reticulatus (Linnaeus), Scheibling (1980, 1981) reported average rates of 7.3 m/day and a maximum distance travelled of 18.4 m/day, while Chesher (1969) notes that marked individuals of A. planci can move 250 m per week, invading reefs that were devoid of stars. All the seastar species mentioned are subtidal and, therefore, they might not be greatly affected by waves and desiccation stress in comparison with intertidal species such as Heliaster. In one of the few studies of movement of intertidal seastars, Paine (1976) points out that the seastar P. ochraceus moves less than 4 m/month, concluding that the. Daily displacements and feeding of Heliaster Our results show that daily displacements of Heliaster are usually of short-distance (\1 m), and in general, daily displacements of more than 5 m are rare. These results differ from observations in other seastars. For example, Burla et al. (1972) showed that the seastar Astropecten aranciacus (Linnaeus) can move on average 9.3 m/day and. 123.
(12) (a). 150 100. r = 0.42; p = 0.116. 50 0 -50 -100 -1.0. 250. -0.5. 0.0. 0.5. 1.0. 1.5. Difference in temperature (°C). Displacement (cm d-1). 200 150 100 2. r = 0.034, p = 0.241. 50. 2. r = 0.021, p = 0.369. 0 11. 12. 13. 14. 15. 16. 17. 18. Temperature (°C). -1. Displacement (cm d ). (b). Difference in -1 displacement (cm d ). Fig. 7 a Relationship between average daily displacements and average sea surface temperature measured on the day of the surveys (solid circles) and over the 2 days before (open circles). Sample size = 15 surveys. The insert shows the relationship between the difference in temperature observed between the 2 consecutive days of each survey and the difference in displacement of individuals over the same days. b Relationship between daily displacements and average maximum wave force on the period of monitoring. Open symbols winter, solid symbols summer, diamond LC, open and closed circles ECIM, square BA, star PT, open and closed triangles Gn, upside-down triangle Hu. See Table 1 for abbreviations. Mar Biol (2010) 157:647–661 Difference in -1 displacement (cm d ). 658. 250 200. 150. r = 0.14; p = 0.721. 100 50 0 -50 -100 -15 -10 -5. 0. 5. 10 15 20 25. Difference in maximum wave force (N). 150 100 50 0. 2. r = 0.68; p = 0.012. 15. 20. 25. 30. 35. 40. 45. 50. Maximum wave force (N). species is a sedentary predator. Nevertheless, in a later experimental study, Robles et al. (1995) showed that Pisaster can cover more than 10 m along the coast during a single foraging excursion. Our results show that across sites, daily displacements of Heliaster were inversely correlated with the abundance of their main prey, P. purpuratus. The sites of Las Cruces and Huasco with higher mussel covers is where the shortest displacements were observed. It should be noted that these sites are the extreme of the latitudinal region covered in this study, and therefore they should have the most contrasting environmental conditions. Decrease in movement rates with increased prey availability has been reported in the seastars A. planci (Barham et al. 1973; Keesing and. 123. Lucas 1992) and O. reticulatus (Scheibling 1980), and in the muricid gastropod Nucella emarginata (Deshayes; Wieters 1999). A factor that could generate differences in the displacement rates among sites is the body size of individuals. Keesing and Lucas (1992) and De0 ath and Moran (1998) point out that large individuals of A. planci are more active than smaller ones. In our study, all marked individuals were of similar size and no relationship with displacement was observed (r = 0.013, P = 0.955). We did not use small individuals (\10 cm in diameter), mainly because they occupy a different habitat (Navarrete and Manzur 2008; Manzur et al. 2009). Another factor that has been investigated is the effect of conspecific density. Scheibling.
(13) Mar Biol (2010) 157:647–661. 659. Table 4 Results of (a) multiple linear regression and (b) stepwise regression for the daily displacement of Heliaster helianthus at the different monitoring sites (response variable) and in situ measured sea surface temperature (SST), wave force (WF) and cover (%) of the main prey P. purpuratus (Pp) r2. P. 0.74. 0.010. Seasonality, temperature and wave force effects on Heliaster displacement. (a) Multiple linear regression Displacement = 206.4 - 3.23 9 wf - 0.96 9 cover Pp Parameter. Semi-partial r2. r2. P. (b) Stepwise regression WF. 0.55. 0.55. 0.016. Cover Pp. 0.19. 0.74. 0.031. *0.00. 0.74. 0.979. SST. times and prey energy contents, it is not possible to determine whether the increased proportion of individuals feeding on mobile prey is due to increased capture rates of these preys or whether it is due to longer handling times of mobile prey species in comparison to mussels.. (1980) and Keesing and Lucas (1992) noted that the largest seastar displacements occurred in areas of high seastar density and, in some species, agonistic and cannibalistic behavior between individuals (Menge and Menge 1974; Sloan 1980, 1984; Palumbi and Freed 1988), can stimulate emigration. Such behavior has not been observed in Heliaster (Viviani 1978), and we did not observe any relationship between daily displacement and average density across sites. While seastar daily displacements were larger at sites with low or virtually non-existent mussel cover, this increase was not associated to a reduction in the proportion of individuals found feeding. Quite the opposite, there was a significantly positive relationship between daily displacements and the proportion of individuals feeding on other prey species (e.g. balanids, limpets, snails). It appears that low availability of the preferred sessile mussel prey leads to increased travelling distances and increased incorporation of other sessile (balanid barnacles) and mobile prey in the diet. As expected from these relationships, there was a negative correlation between the cover of mussels and the proportion of mobile prey in the diet of those individuals found feeding at the time of surveys. At first sight, this is counter intuitive, as usually the increased availability of preferred prey leads to increased foraging activity (Menge 1972; McClintock and Lawrence 1985). Yet, the decrease in individuals found feeding might be explained by the lower costs associated to feeding on mussels (due to lower daily displacements) and the high biomass contributed by mussels to the overall seastar diet (Navarrete and Manzur 2008). As they move more to capture mobile prey or sparser sessile individuals (balanid barnacles), they may need to consume prey more often to compensate for this increased cost and maintain growth and reproduction. However, without prey-specific handling. Comparisons of displacement between summer and winter after removing the effect of site variation (see below) showed that Heliaster decrease its daily displacement in winter months, and this trend was consistent across sites, with the exception of Guanaqueros. At present, it is unclear why Guanaqueros did not show this trend. It may be because waves were particularly large during those summer surveys (pers. obs), but unfortunately, we do not have wave force data for all summer surveys to evaluate this proposition. Increased summer activity patterns has been reported for the seastar P. ochraceus (Mauzey 1966). Sea surface temperature is one of the environmental factors that might explain this pattern, as has been observed in freshwater and other intertidal species (Fitz and Wiegert 1991; Sanford 1999; Bubb et al. 2002, 2004). Nevertheless, our results with in situ measurements of SST suggest that increased daily displacements is not a simple response to rapid changes in SST. It is possible that seasonal variation in displacements results from longer term changes in average sea temperature to which individuals become acclimated, or perhaps they respond to a combination of summer environmental conditions (e.g. longer daylight, fewer storms). Since seastars remain largely immobile during low tides, it is unlikely that their displacement respond to variation in air temperature. However, their position in the intertidal zone with respect to refuges and, therefore, foraging excursions (not measured here) could be influenced by air temperature and should be further investigated. Studies on P. ochraceus (Mauzey 1966), A. planci (Keesing and Lucas 1992) and Asterias forbesi (Desor) (MacKenzie 1969) have shown decreased feeding activity during winter, which is generally attributed to lower sea surface temperature. In addition, through field and laboratory experiments, Sanford (1999, 2002a, b) showed that P. ochraceus reduce predation rates on the mussel M. californianus as a response to slight drops in sea surface temperature that occur on scale of days. Yet, we found the proportion of Heliaster individuals found feeding did not vary between seasons (29% in summer and 23% in winter) or with daily sea temperature (r = -0.188, P = 0.502). The same pattern (lack of seasonality in feeding) was reported for juvenile and adults of Heliaster over a larger number of sites (Navarrete and Manzur 2008) and for. 123.
(14) 660. recruits found in boulders and crevices (Manzur et al. 2009). Our results show that maximum wave forces adversely affect Heliaster movement. On days of heavy swell, Heliaster adopted a more sedentary behavior, staying usually in crevices or pools (authors pers. obs.), which might reduce the risk of dislodgement, or maybe because of increased costs of displacement under these conditions. In laboratory studies, Gagnon et al. (2003) demonstrated that waves severely restrict the displacements of A. vulgaris. Similar results have been observed in the gastropod Nucella (=Thais) lapillus (Menge 1978), and in the sea star P. ochraceus, which during winter storms remain under rocks and crevices (Robles et al. 1995). Other seastars abandon intertidal habitat during winter storms seeking deeper water and migrating back to surface water when environmental conditions improve (Pabst and Vicentini 1978). Incomplete wave force data for summer months does not allow us to compare the effect of waves between seasons. It is likely, however, that waves are more important in winter months, when storms are more common, than in summer. In summary, our results show that the keystone predator H. helianthus exhibit different movement rates, frequency of feeding and type of prey consumed across sites, apparently in response to differences in the availability of their main prey species (P. purpuratus), and that wave forces negatively affect daily displacement. Indeed, availability of the main prey and wave forces explained over 70% of the variance in Heliaster daily displacements among sites in our data set. Further studies should examine the consequences of these factors for Heliaster growth rates and reproductive output. Acknowledgments We are in debt to a number of friends and students who assisted us in the field, including Tatiana Manzur, Fredy Veliz, Joan Escobar, Alfredo Astorga, Elliott Ramos and Maurin Murua. Thanks to the grants Fondecyt # 1040787 and # 1070335 for making this study possible. Comments by Evie Wieters and Randy Finke improved this manuscript. Three anonymous reviewers provided cogent criticism that substantially improved the presentation. Funding for the long time series of mussel and barnacle recruitment at all sites was provided by Fondap-Fondecyt 15001-001 to the Center for Advanced Studies in Ecology and Biodiversity and the Andrew Mellon Foundation, for which we are most thankful.. References Abrams PA (1994) The fallacies of ‘‘ratio-dependent’’ predation. Ecology 75:1842–1850 Arditi R, Ginzburg LR (1989) Coupling in predator–prey dynamics: ratio-dependence. J Theor Biol 139:311–316 Barham EG, Gowdy RW, Wolfson FH (1973) Acanthaster (Echinodermata, Asteroidea) in the Gulf of California. Fish Bull 71:927– 942 Bell EC, Denny MW (1994) Quantifying ‘‘wave exposure’’: a simple device for recording maximum velocity and results of its use at several field sites. J Exp Mar Biol Ecol 181:9–29. 123. Mar Biol (2010) 157:647–661 Broitman BR, Navarrete SA, Smith F, Gaines SD (2001) Geographic variation in southern Pacific intertidal communities. Mar Ecol Prog Ser 224:21–34 Bubb DH, Lucas MC, Thom TJ (2002) Winter movements and activity of signal crayfish Pacifastacus leniusculus in a upland river, determined by radio telemetry. Hydrobiologia 483:111– 119 Bubb DH, Thom TJ, Lucas MC (2004) Movement and dispersal of the invasive signal crayfish Pacifastacus leniusculus in upland rivers. Freshwater Biol 49:357–368 Burla H, Ferlin V, Pabst B, Ribi G (1972) Notes on the ecology of Astropecten aranciacus. Mar Biol 14:235–241 Castilla JC (1981) Perspectivas de investigación en estructura y dinámica de comunidades intermareales rocosas de Chile central. II. Depredadores de alto nivel trófico. Medio Ambiente (Chile) 5:190–215 Castilla JC, Paine RT (1987) Predation and community organization on Eastern Pacific, temperate zone, rocky intertidal shores. Rev Chil Hist Nat 60:131–151 Chesher RH (1969) Destruction of Pacific Corals by the Sea Star Acanthaster planci. Science 165(3890):280–283 De0 ath G, Moran PJ (1998) Factors affecting the behaviour of crownof-thorns starfish (Acanthaster planci L.) on the Great Barrier Reef: 1: patterns of activity. J Exp Mar Biol Ecol 220:83–106 Denny M (1995) Predicting physical disturbance: mechanistic approaches to the study of survivorship on wave-swept shores. Ecol Monogr 65:371–418 Feder HM (1955) The use of vital stains in marking pacific starfish. Calif Fish Game 41(3):245–246 Finke GR, Navarrete SA, Bozinovic F (2007) Tidal regimes of temperate coasts and their influences on aerial exposure for intertidal organisms. Mar Ecol Progr Ser 343:57–62 Fitz HC, Wiegert RG (1991) Utilization of the intertidal zone of a salt marsh by the blue crab Callinectes sapidus: density, return frequency, and feeding habits. Mar Ecol Prog Ser 76:249–260 Gagnon P, Wagner G, Himmelman JH (2003) Use of a wave tank to study the effects of water motion and algal movement on the displacement of the sea star Asterias vulgaris towards its prey. Mar Ecol Prog Ser 258:125–132 Gardiner CW (1985) Handbook of stochastic methods for physics, chemistry and the natural sciences. Springer-Verlag, Berlin Garton D, Stickle WB (1980) Effects of salinity and temperature on the predation rate of Thais haemastoma on Crassostrea virginica spat. Biol Bull 158:49–57 Gaymer CF, Himmelman JH (2008) A keystone predatory sea star in the intertidal zone is controlled by a higher-order predatory sea star in the subtidal zone. Mar Ecol Prog Ser 370:143–153 Gurney WSC, Nisbet RM (1998) Ecological dynamics. Oxford University Press, New York Hassel MP, May RM (1974) Aggregation in predators and insect parasites and its effects on stability. J Anim Ecol 43:567–594 Holling CS (1959) The components of predation as revealed by a study of small-mammal predation of the European pine sawfly. Canad Entomol 91:293–320 Keesing J, Lucas JS (1992) Field measurement of feeding and movement rates of the crown-of-thorns Acanthaster planci (L.). J Exp Mar Biol Ecol 156:89–104 Lipcius RN, Hines AH (1986) Variable functional responses of a marine predator in dissimilar homogeneous microhabitats. Ecology 67:1361–1371 Loosanoff VL (1937) Use of Nile Blue Sulfate in Marking Starfish. Science 85(2208):412 MacKenzie CL (1969) Feeding rates of starfish, Asterias forbesi (Desor), at controlled water temperatures and during different seasons of the year. Fish Bull 68:67–72.
(15) Mar Biol (2010) 157:647–661 Manzur T, Barahona M, Navarrete SA (2009) Ontogenetic changes in habitat use and diet of the seastar Heliaster helianthus on the coast of central Chile. J Mar Biol Ass UK (in press) Mauzey KP (1966) Feeding behavior and reproductive cycles in Pisaster Ochraceus. Biol Bull 131:127–144 McClintock JB, Lawrence JM (1985) Characteristics of foraging in the soft-bottom benthic starfish Luidia clathrata (Echinodermata: Asteroidea): prey selectivity, switching behaviour, functional responses and movement patterns. Oecologia 66:291–298 Menge BA (1972) Foraging strategy of a starfish in relation to actual prey availability and environmental predictability. Ecol Monogr 42:25–50 Menge BA (1978) Predation intensity in a rocky intertidal community: effect of an algal canopy, wave action and desiccation on predator feeding rates. Oecologia 34:17–35 Menge JL, Menge BA (1974) Role of resource allocation, aggression and spatial heterogeneity in co-existence of two competing starfish. Ecol Monogr 44:189–209 Menge BA, Olson AM (1990) Role of scale and environmental factors in regulation of community structure. TREE 5:52–57 Menge BA, Sutherland JP (1987) Community regulation: variation in disturbance, competition, and predation in relation to environmental stress and recruitment. Am Nat 130:730–757 Menge BA, Berlow EL, Blanchette C, Navarrete SA, Yamada SB (1994) The keystone species concept: variation in interaction strength in a rocky intertidal habitat. Ecol Monogr 64:249–286 Moran MJ (1985) The timing and significance of sheltering and foraging behaviour of the predatory intertidal gastropod Morula marginalba Blainville (Muricidae). J Exp Mar Biol Ecol 93:103– 114 Murdoch WW (1971) The developmental response of predators to changes in prey density. Ecology 51:132–137 Murdoch WW, Oaten A (1975) Predation and population stability. Adv Ecol Res 9:1–131 Narváez DA, Navarrete SA, Largier J, Vargas CA (2006) Onshore advection of warm water, larval invertebrate settlement, and relaxation of upwelling off central Chile. Mar Ecol Prog Ser 309:159–173 Navarrete SA, Berlow EL (2006) Variable interaction strengths stabilize marine community pattern. Ecol Lett 9:526–536 Navarrete SA, Castilla JC (2003) Experimental determination of predation intensity in an intertidal predator guild: dominant versus subordinate prey. Oikos 100:251–262 Navarrete SA, Manzur T (2008) Individual- and population-level responses of a keystone intertidal predator to variation in prey productivity over geographic scales. Ecology 89:2005–2018 Navarrete SA, Menge BA (1996) Keystone predation and interaction strength: interactive effects of predators on their main prey. Ecol Monogr 66:409–429 Navarrete SA, Broitman B, Wieters EA, Finke GR, Venegas RM, Sotomayor A (2002) Recruitment of intertidal invertebrates in the southeast Pacific: inter-annual variability and the 1997–1998 El Niño. Limnol Oceanogr 47:791–802 Navarrete SA, Wieters E, Broitman B, Castilla JC (2005) Scales of benthic-pelagic coupling and the intensity of species interactions: from recruitment limitation to top down control. Proc Natl Acad Sci USA 102:18046–18051 Navarrete SA, Broitman BR, Menge BA (2008) Interhemispheric comparison of recruitment to rocky intertidal communities: pattern persistence and scales of variation. Ecology 89:1308– 1322 Pabst B, Vicentini H (1978) Dislocation experiments in the migrating sea star Astropecten jonstoni. Mar Biol 48:271–278. 661 Paine RT (1976) Size limited predation: an observational and experimental approach with the Mytilus-Pisaster interaction. Ecology 57:858–873 Paine RT, Castilla JC, Cancino J (1985) Perturbation and recovery patterns of starfish-dominated intertidal assemblages in Chile, New Zealand, and Washington State. Am Nat 125:679–691 Palumbi SR, Freed AL (1988) Agonistic interactions in a keystone predatory starfish. Ecology 69(5):1624–1627 Raffaelli D, Hawkins SJ (1996) Intertidal ecology. Chapman & Hall, London Rivadeneira MM, Fernández M, Navarrete SA (2002) Latitudinal trends of species diversity in rocky intertidal herbivore assemblages: spatial scale and the relationship between local and regional species richness. Mar Ecol Prog Ser 245:123–131 Robles C, Sherwood-Stephens R, Alvarado M (1995) Responses of a key intertidal predator to varying recruitment of its prey. Ecology 76:565–579 Sanford E (1999) Regulation of keystone predation by small changes in ocean temperature. Science 283:2095–2097 Sanford E (2002a) The feeding, growth, and energetics of two rocky intertidal predators (Pisaster ochraceus and Nucella canaliculata) under water temperatures simulating episodic upwelling. J Exp Mar Biol Ecol 273:199–218 Sanford E (2002b) Water temperature, predation, and the neglected role of physiological rate effects in rocky intertidal communities. Integr Comp Biol 42:881–891 Scheibling RE (1980) Dynamics and feeding activity of high-density aggregations of Oreaster reticulates (Echinodermata: Asteroidea) in a Sand Patch Habitat. Mar Ecol Prog Ser 2:321–327 Scheibling RE (1981) Optimal foraging movements of Oreaster reticulatus (L.) (Echinodermata: Asteroidea). J Exp Mar Biol Ecol 51:173–185 Sloan NA (1980) Aspects of the feeding biology of asteroids. Oceanogr Mar Biol 18:57–124 Sloan NA (1984) Interference and aggression: close encounters of the starfish kind. Ophelia 23:23–31 Stickle WB, Moore MN, Bayne BL (1985) Effects of temperature, salinity and aerial exposure on predation and lysosomal stability of the dog whelk Thais (Nucella) lapillus (L.). J Exp Mar Biol Ecol 93:235–258 Tokeshi M (1989a) Development of a foraging model for a field population of the South American sun-star Heliaster helianthus. J Anim Ecol 58:189–206 Tokeshi M (1989b) Feeding ecology of a size-structured predator population, the South American sun-star Heliaster helianthus. Mar Biol 100:495–505 Viviani CA (1978) Depredación interespecı́fica, canibalismo y autotomı́a como mecanismo de escape en las especies de asteroidea (Echidermata) en el litoral del desierto del Norte Grande de Chile. Laboratorio de Ecologı́a Marina, U. del Norte, Chile, 116 pp (Mimeograph) Wieters EA (1999) Consequences of variation in recruitment of sessile prey on predatory whelks. M Sc, Moss Landing Marine Laboratories, San Jose State University, California Wieters EA, Gaines SD, Navarrete SA, Blanchette C, Menge BA (2008) Scales of dispersal and the biogeography of marine predator–prey interactions. Am Nat 171:405–417 Witman JD, Genovese SJ, Bruno JF, McLaughlin JF, Pavlin B (2003) Massive prey recruitment and the control of rocky subtidal communities on large spatial scales. Ecol Monogr 73:441–462 Zar JH (1999) Biostatistical analysis, 4th edn. Prentice-Hall, New Jersey. 123.
(16) Copyright of Marine Biology is the property of Springer Science & Business Media B.V. and its content may not be copied or emailed to multiple sites or posted to a listserv without the copyright holder's express written permission. However, users may print, download, or email articles for individual use..
(17)
Figure


+2

Documento similar
The greater availability of data and social interest provide the required scenario to advance in the study and avoid the confusion that can come about from the use of unrealistic
In the fourth stage, the IPCC is again present with its V Report (with much less coverage than the previous one), and there are several events (commitments of countries of
• Inadvertently, virtual water will play a greater role in food trade – simply as a function of increasing water scarcity and the disparity of water availability between countries
The goals of this study were: (a) to analyse with which ball the participants attempted a greater number of shots from distances greater than four meters and
The higher heating value obtained HHV (18.05 MJ/kg, 18.54 MJ/kg and 17.84 MJ/kg respectively) is greater than that of other biomass sources evaluated by previous studies and
The availability of small deformable mirrors with large number of actuators and stroke, on one hand, and versatile wavefront sensors (pyramid WFS), on the other, allows the
Correlation between structural complexity, proportion of species included in the Red Lists at world and national level, proportion of threatened species included
although their seedling emergence is higher than small-seeded species, large-seeded 321.. 14 herbaceous species probably cannot emerge when germinating at depths greater than
