Intraspecific variability in the basal metabolic rate: Testing the food habits hypothesis
9
0
0
Texto completo
(2) Intraspecific Variability in Basal Metabolism 453 food with low energy content and/or low digestibility evolve low mass-independent BMRs (Cruz-Neto et al. 2001; McNab 2002). Likewise, the evolution of a low mass-independent BMR is likely to occur in habitats where food availability is low and/ or unpredictable (McNab 2002; Cruz-Neto and Jones 2005). Albeit attractive, several problems and ambiguities have emerged from studies attempting to test the food habits hypothesis. One main problem, which is also relevant, is associated with the taxonomic level of analysis. For example, studies carried out at the interspecific level assume that for any given species, all traits are fixed, and consequently the variation between individuals is largely ignored (Bennett 1987). Interindividual variability is the raw material on which natural selection acts. By ignoring such variability, interspecific studies of physiological traits cannot unambiguously demonstrate adaptation, nor can they unequivocally describe and differentiate the ultimate or proximate factors responsible for variations in any phenotypic trait, including BMR (Cruz-Neto and Bozinovic 2004). Intraspecific (or interpopulational) analysis of physiological traits has the potential to compensate for many of these pitfalls and, thus, to be a useful approach for evaluating hypotheses regarding phenotypic and genetic mechanisms of metabolic adaptation and evolution (Dohm et al. 2001; Nespolo et al. 2003b, 2005; Labocha et al. 2004; Konarzewski et al. 2005; Sadowska et al. 2005; Lovegrove 2006). Nevertheless, results from between-species or between-population analyses of the food habitat hypothesis do not always corroborate the expected patterns, with results differing according to the experimental protocol used and with the specific component of the hypothesis being tested (Mueller and Diamond 2001; Cruz-Neto and Bozinovic 2004; Speakman et al. 2004). In addition to problems associated with the level of analysis, several specific problems also plague the interpretation of the results from studies attempting to test the food habits hypothesis. For example, ambiguities surrounding diet categorization can potentially confound interpretations from interspecific analysis of the relative importance of diet quality (Cruz-Neto et al. 2001; McNab 2002; Muñoz-Garcia and Williams 2005). To what extent this problem has been circumvented by laboratory-based intraspecific analysis is questionable (Cruz-Neto and Bozinovic 2004). On the other hand, evidence of an association between massindependent BMR and food availability and predictability comes from interspecific or interpopulation studies where factors such as latitude, temperature, rainfall, and aridity of the species’ habitats of origin have been used as a proxy to infer the effects of availability and predictability on mass-independent BMR (Degen et al. 1998; Lovegrove 2000, 2003; Tieleman and Williams 2000; Mueller and Diamond 2001; McNab 2002; Tieleman et al. 2003a, 2003b; Wikelski et al. 2003; Rezende et al. 2004; Williams et al. 2004; Cruz-Neto and Jones 2005). With the exception of some interpopulational analyses where habitat productivity and/or variability were directly assessed (Mueller. and Diamond 2001; Speakman et al. 2004), generally, the precise effects of these two components cannot be separated because of confounding effects from other features of the habitat where the species has evolved (i.e., direct climate effects). While comparative physiology documents the range of physiological variation across a range of organisms, measures of integrative physiological traits, such as BMR, in wild-caught animals may provide insight into the actual mechanisms that an organism employs to maintain homeostasis in its everyday life and, combined with natural history data, is a prerequisite for developing hypotheses regarding physiological mechanisms of homeostasis (Costa and Sinervo 2004; Goldstein and Pinshow 2006). Thus, besides complementing data from laboratory studies, such an approach allows for a direct analysis of how physiological traits change as energy demand and environmental conditions change (Wunder 1992; Derting and Hornung 2003) and provides a way to more thoroughly test the food habits hypothesis. To our knowledge, this type of analysis has never been done before. In this study, we investigated the effects of diet quality and habitat productivity (a measure of diet availability and predictability) on the BMR of individuals in a free-ranging population of the leaf-eared mouse Phyllotis darwini (see “Material and Methods”). Basal metabolism was measured on freshly caught animals from the field, since they endure/encounter/undergo natural seasonal variations in climatic factors (and, hence, habitat productivity) and diet quality. Our main objective is to evaluate the food habits hypothesis by differentiating between the relative importance of diet quality and diet productivity in determining the variability of massindependent BMR in a free-ranging population of rodents. Material and Methods Animals, Habitat, and Dietary Analysis We used adult males and nonreproductive females of the leafeared mouse Phyllotis darwini (Muridae). This species inhabits semiarid and Mediterranean scrublands in central Chile, from 25⬚ to 38⬚S and from sea level to 2,000 m above sea level (Steppan 1998). The vegetation at the study site is sclerophyllous, described physiognomically as evergreen scrub, and more specifically known as matorral. The climate is Mediterranean, with an annual mean precipitation of 376 mm, concentrated 65% in winter, from June to August. Precipitation is minimal from December to March, accounting for only 3% of the yearly total. Temperatures are highest from December to March (mean p 22.1⬚C), corresponding to austral summer, and lowest from June to August (mean p 7.7⬚C), during austral winter. The combination of high temperatures and low precipitation from December to March characterizes the typical summer drought of this Mediterranean climate (Jaksic 2001; http:// www.bio.puc.cl/sca/). Animals were captured monthly from July 2005 to February 2006 in Quebrada de la Plata, central Chile (33⬚31⬘S, 70⬚50⬘W,. This content downloaded from 146.155.157.160 on May 16, 2018 10:49:20 AM All use subject to University of Chicago Press Terms and Conditions (http://www.journals.uchicago.edu/t-and-c)..
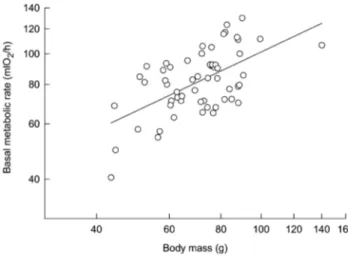
(3) 454 F. Bozinovic, J. L. P. Muñoz, and A. P. Cruz-Neto 500 m above sea level), using 100 clean Sherman live traps with small amounts of oats as bait. We captured a total of 57 animals (33 males and 24 females). All individuals were ear tagged to avoid repeatability in our measurements. Animals were transported to the laboratory within the same day of capture and released 24 h later, following BMR measurements. We did not feed animals before measurements, so we were confident that they were postabsorptive. No pieces of oats were found in feces. The leaf-eared mouse is reported to feed primarily on plants and seeds and occasionally on insects (Meserve 1981; Silva 2005). To determine monthly variation in diet, we collected all feces present in Sherman traps. Feces from each trap were stored in individual vials for posterior analysis. Feces from each individual were pooled and homogenized in a solution of 6% sodium hypochlorite. Three replicates per individual were analyzed under a stereoscopic microscope (#20) with a calibrated ocular. For each sample, we recorded 10 fields and determined the relative volumetric percentage of plants, seeds, and insects (see “Data Analysis”). For each dietary item, the percentage of area covered was estimated using an ocular containing a 10 # 10 grid. Areas without fragments and fields with !50% of area occupied by dietary fragments were excluded from the analysis (DeBlase and Martin 1981; Silva 2005). Habitat productivity (Q) for each month was calculated as follows: Qp. chamber received dried air at a rate of 800 mL/min from mass flow controllers (Sierra Instruments, Monterey, CA), which is enough to ensure adequate mixing in the chamber. Air passed through CO2-absorbent granules of Baralyme and H2O-absorbent granules of Drierite both before and after passing through the chamber and was sampled every 5 s by an Applied Electrochemistry O2 analyzer (model S-3A/I, Ametek, Pittsburgh, PA). Oxygen consumption values were calculated using equation (4a) of Withers (1977). Since P. darwini is nocturnal, all metabolic trials were completed between 0900 and 1700 hours, when individuals were resting. Body mass was measured before metabolic measurements using an electronic balance (Ⳳ0.1 g), and colonic body temperature (Tb) was recorded at the end of each measurement using a Digi-Sense copper-constant thermocouple. BMR was estimated as the lowest steady state period of 3 min, recorded during V̇o2 measurements (ca. 2 h). Observed BMR was compared against standard BMR values expected for eutherian mammals (McNab 2002), following the allometric equation: BMR (mL O2 /h) p 3.53m 0.72 b , where m b p body mass (g). Since body mass is the main factor explaining variation in BMR (Kleiber 1961), mass-independent BMR (percent of mass expected BMR) was calculated as percent BMR p. BMR observed # 100. BMR expected p 3.53m 0.72 b. pp # 1,000, (Tmax ⫹ Tmin)(Tmax ⫺ Tmin) Data Analyses. where pp is the total monthly precipitation (mm) and Tmax (⬚C) and Tmin (⬚C) are the mean maximum and minimum temperature, respectively, for each month (Tieleman et al. 2003a). Climatic data were obtained from the Pudahuel meteorological station located 8 km north of our study site (http:// www.meteochile.cl). Q tends to be low in hot, dry months and increases rapidly as the habitat becomes more mesic. In addition to being an index of climatic variability, Q can also be used as an index of the productivity of an area (Tieleman et al. 2003a) and, thus, can be regarded as a measure of the availability and predictability of dietary resources.. Statistical analyses were performed using the Statistica (StatSoft 2001) statistical package for Windows. We performed linear regressions with mass-independent BMR as the dependent var-. Measurements of Basal Metabolic Rate Following capture, all animals were maintained in the laboratory for less than 24 h at natural temperature and photoperiod. Before being released at the same site of capture, individuals were fed apples. BMR was measured in the laboratory by recording oxygen consumption in a computerized (Datacan V) open-flow respirometry system (Sable Systems, Henderson, NV). Postabsorptive animals were maintained in plexiglass metabolic chambers (1,000 mL) at Ta p 30.0⬚ Ⳳ 0.5⬚C (Nespolo et al. 2003c), which is within the thermoneutral zone of this species (Bozinovic and Rosenmann 1988). The metabolic. Figure 1. Double logarithmic relationships between body mass (mb; g) and basal metabolic rate (BMR; mL O2/h) in the leaf-eared mouse. Each point represents a different individual. The allometric equation representing the linear curve is BMR p 6.1m0.56 b .. This content downloaded from 146.155.157.160 on May 16, 2018 10:49:20 AM All use subject to University of Chicago Press Terms and Conditions (http://www.journals.uchicago.edu/t-and-c)..
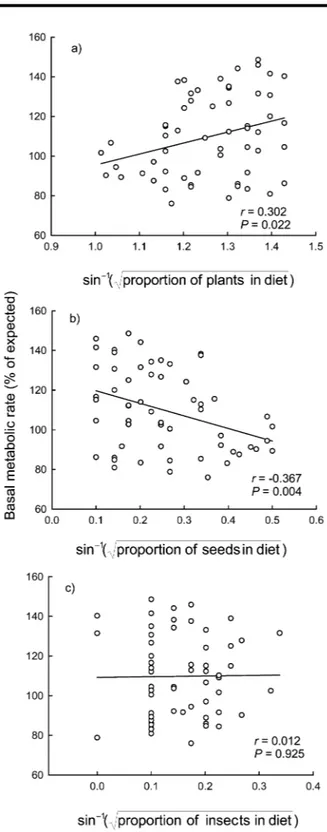
(4) Intraspecific Variability in Basal Metabolism 455 iable and mb, diet, and the Q index as independent variables. We used ANOVA (or Kruskall-Wallis) tests for comparisons among factors. Before analyses, we tested assumptions of normality and constant variance test using Shapiro-Wilks W and Levene’s tests. When required to satisfy assumptions of normality for parametric statistical tests, percentage data were arcsine–square root transformed. The structural equation modeling module of Statistica was used to compute standardized path coefficients among measured variables and to test the overall path diagram as a likely cause of the observed data. We used maximum likelihood to estimate parameters, with their respective standard errors (Nespolo et al. 2003a). The significance of the overall path model was assessed using the x2 statistic computed from the departure of the observed data from the expected covariance matrix (Shipley 2000). The null hypothesis of perfect fit states that the data support the proposed model. Contrarily, a significant x2 value means that the model is not supported by the data and needs to be modified. Structural equation modeling has two basic assumptions: multivariate normality and linearity among variables. The fact that the proportion of plants, seeds, and insects in diets must sum one unit implies the existence of a conservation law. To overcome this problem, we analyzed three different structural equations, considering the proportion of only one kind of diet (seeds, plants, or insects) in each analysis (Fig. 4). Results are reported as means Ⳳ 1 SE. Results The mean body mass of the leaf-eared mouse was 72.1 Ⳳ 16.0 g (range: 43.4–140.2 g) and did not differ significantly in relation to both month and sex or to the interaction months # sex (two-way ANOVA; F7, 57 p 0.724, P p 0.652). The amount of plants in the diet (H p 30.334, df p 7, P ! 0.001) increased significantly during winter (Dunn’s method, P ! 0.01), while the amount of seeds in the diet increased during summer (H p 33.673, df p 7, P ! 0.001; Dunn’s method, P ! 0.01). During winter, dietary plants (mainly leaves) represented nearly 100% of all items, while during summer, this item decreased to nearly 70%, with a concomitant increase in dietary seeds. No significant changes in dietary insects were detected (H p 4.403, df p 7, P p 0.732). We observed a significant scaling relationship between BMR and mb (Fig. 1). The intraspecific allometric equation calculated for an individual leaf-eared mouse was BMR (mL O2 /h) p 6.1m 0.56Ⳳ0.10 (r 2 p 0.345, F1, 56 p 20.011, P ! 0.0001). A signifib cant linear relationship between mass-independent BMR and the proportion of dietary plants and seeds was found. This relationship was positive for dietary plants (y p 40.056 ⫹ 55.408x; r p 0.302, P p 0.022; Fig. 2a) and negative for dietary seeds (y p 126.05 ⫺ 63.46x; r p ⫺0.367, P p 0.004; Fig. 2b). No significant relationship was observed between mass-independent BMR and dietary insects (y p 109.2 ⫹ 3.671x; r p. Figure 2. Relationships between mass-independent basal metabolic rate (BMR) and the proportion of dietary plants (a), seeds (b), and insects (c) in the leaf-eared mouse. BMR is presented as the percentage of expected BMR calculated from the aforementioned equation. The regression coefficients and their associated significance are indicated on each graph. Each point represents a different individual, and curves are represented by y p 40.056 ⫹ 55.408x (a), y p 126.05 ⫺ 63.46x (b), and y p 109.2 ⫹ 3.671x (c).. This content downloaded from 146.155.157.160 on May 16, 2018 10:49:20 AM All use subject to University of Chicago Press Terms and Conditions (http://www.journals.uchicago.edu/t-and-c)..
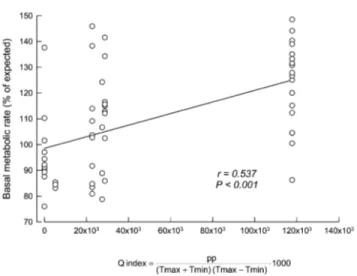
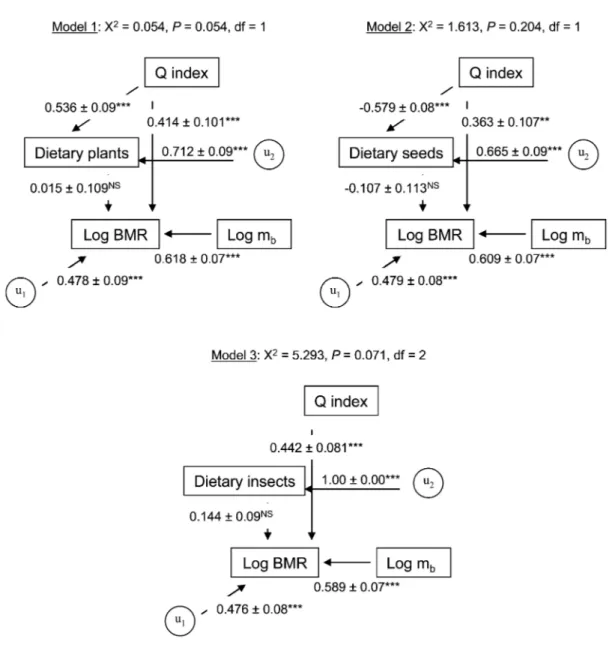
(5) 456 F. Bozinovic, J. L. P. Muñoz, and A. P. Cruz-Neto 0.012, P p 0.925; Fig. 2c). Mass-independent BMR was also significantly related to the Q index, which is associated with environmental productivity (y p 98.534 ⫹ 0.00023x; r p 0.537, P ! 0.001; Fig. 3). Finally, as an attempt to determine the hierarchical order of factors affecting the magnitude of BMR, we developed/generated three path models based on nominal x2 P values. None of these path models presented significant differences from the expected covariance structure (i.e., all are supported by the data; Fig. 4). As expected, for all of the models, path analysis indicated that BMR was always significantly correlated with body mass. Interestingly, for all models, the Q index was significantly correlated with both diet and BMR; however, diet was not significantly correlated with BMR. In fact, the exclusion of this path generated models with slightly improved fit but that were not significantly different from the original model. Thus, we prefer to retain the model containing the path between diet and BMR because it is congruent with observations, and it allows us to highlight the nonsignificant connection between diet and BMR. Discussion On an evolutionary timescale, it has been hypothesized that diet is a powerful selective agent shaping rates of energy expenditure in birds and mammals (Bozinovic and Martı́nez del Rı́o 1996). The evolution of diets that are free from chemical agents, with low fiber content and/or high digestibility, are thought to be correlated with the evolution of high rates of energy expenditure, most notably the BMR (McNab 2002). The effects of diet quality have also been extended to a proximate level. For example, it has been hypothesized that within an individual’s lifetime, an organism faced with a low-quality diet can lower its BMR and, hence, reduce its daily food (energy) requirement (Cork 1994). Cruz-Neto and Bozinovic (2004) reviewed intraspecific studies that manipulate diet quality in order to evaluate changes in BMR. The results from such studies showed mixed support for the food habits hypothesis. Some species did indeed downregulate BMR in response to an experimental diet quality, but other species showed no effect— or even an increase in BMR—when exposed to low-quality diets, depending on the acclimation period and whether animals can trigger the integrated processing responses (sensu Batzli et al. 1994; see also Choshniak and Yahav 1987; Veloso and Bozinovic 1993, 2000; Bozinovic 1995; Koteja 1996; Geluso and Hayes 1999; Rosen and Trites 1999; Silva et al. 2004). In our analysis, which used a “natural experiment” in which animals changed their diets at will, a shift in diet was correlated with changes in mass-independent BMR. In this regard, our first analysis using linear regressions (Fig. 2) supports the assertion that diet quality affects mass-independent BMR, even at a proximate, local level. In a more specific context, our results support the expected patterns for animals with mixed diets, as. Figure 3. Relationships between mass-independent basal metabolic rate (BMR) and the Q index calculated for the leaf-eared mouse habitat. BMR is presented as the percentage of expected BMR calculated from the aforementioned equation. The positive relationship is highly significant. Each point represents a different individual, and the curve is represented by y p 98.534 ⫹ 0.00023x.. originally suggested by McNab (1986). For example, the leafeared mouse showed a negative and significant relationship between mass-independent BMR and the percentage of seeds and insects in its diet, but an inverse pattern was observed when plant materials became progressively more important (Fig. 2). Thus, it seems that adjustments of BMR for animals with mixed diets are primarily regulated by the type of the food that composes the bulk of the diet, with adjustments occurring in the same direction as those expected for mammals specialized on a particular component of the diet. Such a pattern was also observed in a higher-level analysis of carnivores with mixed diets by Muñoz-Garcia and Williams (2005), who found that mass-independent BMR was positively correlated with the percentage of meat in the diet. Several interspecific studies have implicitly analyzed the effects of food availability and predictability on mass-independent BMR by demonstrating that mass-independent BMR is higher in mesic habitats when compared with xeric habitats or by showing strong correlations between climatic variables (temperature and rainfall) and mass-independent BMR (Lovegrove 2000; McNab 2002; Rezende et al. 2004). Underlying these analyses is the assumption that climatic variability directly reflects food availability and predictability. Our results show that the mass-independent BMR of the leaf-eared mouse is lower during warm months than cold months and varies positively with precipitation (Fig. 3). Given that productivity tends to be higher during the cold, wettest months in Mediterranean habitats (Jaksic 2001), this result supports the prediction that massindependent BMR is positively correlated with productivity. However, one difficulty in ascribing these results to a direct. This content downloaded from 146.155.157.160 on May 16, 2018 10:49:20 AM All use subject to University of Chicago Press Terms and Conditions (http://www.journals.uchicago.edu/t-and-c)..
(6) Intraspecific Variability in Basal Metabolism 457. Figure 4. Path diagrams of the three causal models tested. The correlation coefficients (ⳲSE) and their associated probabilities are indicated for each arrow (three asterisks, P ! 0.001; two asterisks, P ! 0.01; NS, not significant); u p residual error.. effect of productivity and resource availability is that the seasonal variation we observed in BMR may also be a direct response to the effects of climate per se. For example, as climatic conditions vary seasonally, endothermic animals would show phenotypic physiological responses to directly cope with the changing conditions of temperature and humidity (McNab 2002; Lovegrove 2005). Thus, for the leaf-eared mouse, the decrease in BMR during summer might well be due to factors related to maintenance of the water budget during periods of drought, whereas the increase observed in winter can equally be ascribed to an increase in thermogenic capacity, reflected by the increase in BMR. Even though our use of the Q index might not have fully solved this problem, our results point to. a more pronounced effect of environmental productivity on mass-independent BMR of the leaf-eared mouse rather than an effect of climate per se. For example, Mueller and Diamond (2001), using a common garden experiment (they kept rodents from distinct geographical locations under the same conditions), studied the relationships between metabolic rate and environmental productivity of species of rodents (Peromyscus). These researchers found that high-BMR mouse species from high-productive environments were more active than were lowBMR species from low-productive habitats, concluding that BMR is driven by environmental productivity and, hence, food availability rather than temporal variability in productivity. This conclusion also seems to apply to our study but on a seasonal. This content downloaded from 146.155.157.160 on May 16, 2018 10:49:20 AM All use subject to University of Chicago Press Terms and Conditions (http://www.journals.uchicago.edu/t-and-c)..
(7) 458 F. Bozinovic, J. L. P. Muñoz, and A. P. Cruz-Neto scale. Tieleman et al. (2003a, 2003b), studying five species of larks present along an aridity gradient, found that acclimation to temperature could not explain the variability in BMR between these species. Thus, much of the observed variability in BMR can be directly ascribed to differences in habitat productivity rather than a direct effect of climate per se. Indeed, when the two/three components of the food habits hypothesis (diet quality and availability) were analyzed in tandem, using path analysis, our results suggested that the impact of the Q index of habitat productivity on mass-independent BMR was responsible for the observed changes in BMR, while diet quality had no effect on this variable. As stated earlier, we cannot be sure to what extent the major effects of the Q index reflect an effect of diet availability alone and/or an effect of climate per se. Nevertheless, the important point here is that, contrary to what has been suggested by Mueller and Diamond (2001), the different effects of the components of the food habits hypothesis can have very different effects on the variability of BMR and, hence, cannot be said to exemplify one common factor. One example of these multifaceted effects can seen in the use of seed as food. The leafeared mouse feeds on seeds during the summer, when temperature is high and water and food availability low. Hinds and MacMillen (1985) and McNab (2002) suggested that seed-eating rodent species reduce their BMR to balance their water budget and to cope with the ephemeral and dry nature of seeds as a food resource. However, given the results of our path analysis, a more plausible explanation is that the reduction observed in BMR is mostly due to the low availability of this resource, with the nutritional quality of the seeds as food playing a lesser, negligible role. In summary, our results were conclusive about the effects of diet quality on setting the level of mass-independent BMR in the free-ranging leaf-eared mouse. We also found that habitat productivity affects mass-independent levels of BMR. However, it was impossible to fully tease apart the two factors intertwined within this index (availability and predictability) and to rule out the direct effects of climate. When analyzed together, however, and with previous knowledge of the natural history of the leaf-eared mouse (Mann 1978), our results suggest that the distinct components of the food habits hypothesis cannot be treated as a single common factor and that, at least for our study species, the effects of food availability seem to be more important than the effects of the nutritional quality of the diet in setting the level of mass-independent BMR. Finally, as Goldstein and Pinshow (2006) have pointed out, quantifying organismal response to changing environments provides a bridge between mechanistic physiology, ecology, and evolutionary biology. Although uncontrolled factors in natural biotic and abiotic environments may make it difficult for our capacity to define accurate and causal relationships among variables, this type of study provides opportunities not available under laboratory conditions. In this vein, Costa and Sinervo. (2004) recently called for a new approach to ecological physiology, denominated field physiology. These authors advocate field physiology as a discipline founded on an understanding of natural environments and the natural history of organisms to develop hypotheses and questions regarding the types of physiological problems faced by animals in the field. In this sense, researchers have begun to quantify various aspects of organismal natural history in order to evaluate the role of natural selection in determining the evolution of physiological traits. Here we have illustrated the physiological receptiveness of animals to environmental conditions, thus providing specific insights into the evolution of metabolic capacities through the combination of measurements of energetic responses to changing environmental productivity. Acknowledgments This work was funded by Fondo de Investigación Avanzada en Áreas Prioritarias grant 1051-0001 (program 1) to F.B. We acknowledge M. Arim, D. Naya, P. Neill, and S. Silva for valuable help and suggestions. Two anonymous reviewers provided useful suggestions. Literature Cited Batzli G.O., A.D. Broussard, and R.J. Oliver. 1994. The integrated processing response in herbivorous small mammals. Pp. 324–336 in D. Chivers and P. Langer, eds. The Digestive System in Mammals: Food, Form, and Function. Cambridge University Press, Cambridge. Bennett A.F. 1987. Inter-individual variability: an underutilized resource. Pp. 147–169 in M.E. Feder, A.F. Bennett, W.W. Burggren, and R.B. Huey, eds. New Directions in Ecological Physiology. Cambridge University Press, Cambridge. Bozinovic F. 1995. Nutritional energetics and digestive responses of an herbivorous rodent (Octodon degus) to different levels of dietary fiber. J Mammal 76:627–637. Bozinovic F. and C. Martı́nez del Rı́o. 1996. Animals eat what they should not: why do they reject our foraging models? Rev Chil Hist Nat 69:15–20. Bozinovic F. and M. Rosenmann. 1988. Comparative energetics of South American cricetid rodents. Comp Biochem Physiol A 91:195–202. Brown J.H., J.F. Gillooly, A.P. Allen, U.M. Savage, and G.B. West. 2004. Toward a metabolic theory of ecology. Ecology 85:1771–1789. Choshniak I. and S. Yahav. 1987. Can desert rodents better utilize low quality roughage than their non-desert kindred? J Arid Environ 12:241–246. Cork S.J. 1994. Digestive constraints on dietary scope in small and moderately-small mammals: how much do we really understand? Pp. 337–369 in D.J. Chivers and P. Langer, eds.. This content downloaded from 146.155.157.160 on May 16, 2018 10:49:20 AM All use subject to University of Chicago Press Terms and Conditions (http://www.journals.uchicago.edu/t-and-c)..
(8) Intraspecific Variability in Basal Metabolism 459 The Digestive System in Mammals: Food, Form, and Function. Cambridge University Press, Cambridge. Costa D.P. and B. Sinervo. 2004. Field physiology: physiological insights from animals in nature. Annu Rev Physiol 66:209– 238. Cruz-Neto A.P. and F. Bozinovic. 2004. The relationships between diet quality and basal metabolic rate in endotherms: insights from intraspecific analysis. Physiol Biochem Zool 77:877–889. Cruz-Neto A.P., T. Garland, and A.S. Abe. 2001. Diet, phylogeny and basal metabolic rate in phyllostomid bats. Zoology 104: 49–58. Cruz-Neto A.P. and K. Jones. 2005. Exploring the evolution of basal metabolic rate in bats. Pp. 58–69 in A. Zubaid, T.H. Kunz, and G. McCracken, eds. Functional Morphology and Ecology of Bats. Oxford University Press, Oxford. DeBlase F. and R.E. Martin. 1981. A Manual of Mammalogy with Keys to Families of the World. Brown, Dubuque, IA. Degen A.A., M. Kan, I.S. Khokhlova, B.R. Krasnov, and T.G. Barraclough. 1998. Average daily metabolic rate of rodents: habitat and dietary comparisons. Funct Ecol 12:63–73. Derting T.L. and C.A. Hornung. 2003. Energy demand, diet quality, and central processing organs in wild white-footed mice (Peromyscus leucopus). J Mammal 84:1381–1398. Dohm M.R., J.P. Hayes, and T. Garland. 2001. The quantitative genetics of maximal and basal metabolic rates of oxygen consumption in mice. Genetics 159:267–277. Geluso K. and J.P. Hayes. 1999. Effects of dietary quality on basal metabolic rate and internal morphology of European starlings (Sturnus vulgaris). Physiol Biochem Zool 72:189– 197. Goldstein D.L. and B. Pinshow. 2006. Taking physiology to the field: using physiological approaches to answer questions about animals in their environments. Physiol Biochem Zool 79:237–241. Gordon M.S. 1977. Animal physiology: principles and adaptation. MacMillan, New York. Hinds D.E. and R.E. MacMillen. 1985. Scaling of energy metabolism and evaporative water loss in heteromyid rodents. Physiol Zool 58:282–298. Hulbert A.J. and P.L. Else. 2004. Basal metabolic rate: history, composition, regulation, and usefulness. Physiol Biochem Zool 77:869–876. Jaksic F.M. 2001. Spatiotemporal variation patterns of plants and animals in San Carlos de Apoquindo, central Chile. Rev Chil Hist Nat 74:477–502. Kleiber M. 1961. The Fire of Life. Wiley, New York. Konarzewski M., A. Ksiazek, and I.B. Lapo. 2005. Artificial selection on metabolic rates and related traits in rodents. Integr Comp Biol 45:416–425. Kooijman S.A.L.M. 2000. Dynamic Energy and Mass Budgets in Biological Systems. Cambridge University Press, Cambridge. Koteja P. 1996. Limits to the energy budget in a rodent, Per-. moyscus maniculatus: does gut capacity set the limit? Physiol Zool 69:994–1020. Labocha M.K., E.T. Sadowska, K. Baliga, A.K. Semer, and P. Koteja. 2004. Individual variation and repeatability of basal metabolism in the bank vole, Clethrionomys glareolus. Proc R Soc B 271:367–372. Lovegrove B.G. 2000. The zoogeography of mammalian basal metabolic rate. Am Nat 156:201–219. ———. 2003. The influence of climate on the basal metabolic rate of small mammals: a slow-fast metabolic continuum. J Comp Physiol B 173:87–112. ———. 2005. Seasonal thermoregulatory responses in mammals. J Comp Physiol B 175:231–247. ———. 2006. The power of fitness in mammals: perceptions from African slipstream. Physiol Biochem Zool 79:224–236. Mann G. 1978. Los pequeños mamı́feros de Chile. Gayana Zool 40:1–342. McNab B.K. 1986. The influence of food habits on the energetics of eutherian mammals. Ecol Monogr 56:1–19. ———. 1992. Energy expenditure: a short history. Pp. 1–15 in T.E. Tomasi and T.H. Horton, eds. Mammalian Energetics: Interdisciplinary Views of Metabolism and Reproduction. Cornell University Press, Ithaca, NY. ———. 2002. The Physiological Ecology of Vertebrates: A View from Energetics. Cornell University Press, Ithaca, NY. Meserve P. 1981. Trophic relationships among small mammals in a Chilean semiarid thorn scrub community. J Mammal 62:304–314. Mueller P. and J. Diamond. 2001. Metabolic rate and environmental productivity: well-provisioned animals evolved to run and idle fast. Proc Natl Acad Sci USA 98:12550–12554. Muñoz-Garcia A. and J.B. Williams. 2005. Basal metabolic rate in carnivores is associated with diet after controlling for phylogeny. Physiol Biochem Zool 78:1039–1056. Nespolo R.F., M. Arim, and F. Bozinovic. 2003a. Body size as a latent variable in a structural equation model: thermal acclimation and energetics of the leaf-eared mouse. J Exp Biol 206:2145–2157. Nespolo R.F., L.D. Bacigalupe, and F. Bozinovic. 2003b. Heritability of energetics in a wild mammal, the leaf-eared mouse (Phyllotis darwini). Evolution 57:1679–1688. ———. 2003c. The influence of heat increment of feeding on basal metabolic rate in Phyllotis darwini (Muridae). Comp Biochem Physiol A 134:139–145. Nespolo R.F., D.M. Bustamante, L.D. Bacigalupe, and F. Bozinovic. 2005. Quantitative genetics of bioenergetics and growth-related traits in the wild mammal Phyllotis darwini. Evolution 59:1829–1837. Rezende E.L., F. Bozinovic, and T. Garland Jr. 2004. Climatic adaptation and the evolution of maximum and basal rates of metabolism in rodents. Evolution 58:1361–1374. Rosen D.A.S. and A.W. Trites. 1999. Metabolic effects of low-. This content downloaded from 146.155.157.160 on May 16, 2018 10:49:20 AM All use subject to University of Chicago Press Terms and Conditions (http://www.journals.uchicago.edu/t-and-c)..
(9) 460 F. Bozinovic, J. L. P. Muñoz, and A. P. Cruz-Neto energy diet on Steller sea lions, Eumetopias jubatus. Physiol Biochem Zool 72:723–731. Sadowska E.T., M.K. Labocha, K. Baliga, A. Stanisz, A.K. Wróblewska, W. Jagusiak, and P. Koteja. 2005. Heritability and genetic correlations between basal and maximum metabolic rates in the bank vole Clethrionomys glareolus: consequences for evolution of endothermy. Evolution 59:672–681. Schmidt-Nielsen K. 1997. Animal Physiology: Adaptation and Environment. Cambridge University Press, Cambridge. Shipley B. 2000. Cause and Correlation in Biology. Cambridge University Press, Cambridge. Silva S.I. 2005. Posiciones tróficas de pequeños mamı́feros en Chile: una revisión. Rev Chil Hist Nat 78:589–599. Silva S.I., F.M. Jaksic, and F. Bozinovic. 2004. Interplay between metabolic rate and diet quality in the South American fox, Pseudalopex culpaeus. Comp Biochem Physiol A 137:33–38. Speakman J.R., E. Król, and M.S. Johnson. 2004. The functional significance of individual variation in basal metabolic rate. Physiol Biochem Zool 77:900–915. StatSoft. 2001. STATISTICA: Data Analysis Software System. Version 6. Tulsa, OK. Steppan S.J. 1998. Phylogenetic relationships and species limits within Phyllotis (Rodentia: Sigmodontidae): concordance between mtDNA sequence and morphology. J Mammal 79: 573–593. Tieleman B.I. and J.B. Williams. 2000. The adjustments of avian metabolic rates and water fluxes to desert environments. Physiol Biochem Zool 73:461–479. Tieleman B.I., J.B. Williams, and P. Bloomer. 2003a. Adaptation. of metabolism and evaporative water loss along an aridity gradient. Proc R Soc B 270:207–214. Tieleman B.I., J.B. Williams, M.E. Buschur, and C.R. Brown. 2003b. Phenotypic variation in larks along an aridity gradient: are desert birds more flexible? Ecology 84:1800–1815. van der Meer J. 2006. Metabolic theories in ecology. Trends Ecol Evol 21:136–140. Veloso C. and F. Bozinovic. 1993. Dietary and digestive constraints on basal energy metabolism in a small herbivorous rodent. Ecology 74:2003–2010. ———. 2000. Interplay between acclimation time and diet quality on basal metabolic rate in females of degus Octodon degus (Rodentia: Octodontidae). J Zool 252:531–533. Wikelski M., L. Spinney, W. Schelsky, A. Scheuerlein, and E. Gwinner. 2003. Slow pace of life in tropical sedentary birds: a common-garden experiment of four stonechat populations from different latitudes. Proc R Soc B 270:2383–2388. Williams J.B., A. Muñoz-Garcia, S. Ostrowski, and B.I. Tieleman. 2004. A phylogenetic analysis of basal metabolism, total evaporative water loss and life-history among foxes from desert and mesic regions. J Comp Physiol B 174:29–39. Willmer P., G. Stone, and I. Johnston. 2000. Environmental physiology of animals. Blackwell Science, Oxford. Withers P.C. 1977. Measurements of metabolic rate, V̇co2, and evaporative water loss with a flow through mask. J Appl Physiol 42:120–123. Wunder B.A. 1992. Morphophysiological indicators of the energy state of small mammals. Pp. 83–104 in T.E. Tomasi and T.H. Horton, eds. Mammalian Energetics. Comstock, Ithaca, NY.. This content downloaded from 146.155.157.160 on May 16, 2018 10:49:20 AM All use subject to University of Chicago Press Terms and Conditions (http://www.journals.uchicago.edu/t-and-c)..
(10)
Figure
Documento similar
Our results here also indicate that the orders of integration are higher than 1 but smaller than 2 and thus, the standard approach of taking first differences does not lead to
Although some public journalism schools aim for greater social diversity in their student selection, as in the case of the Institute of Journalism of Bordeaux, it should be
In the “big picture” perspective of the recent years that we have described in Brazil, Spain, Portugal and Puerto Rico there are some similarities and important differences,
- Competition for water and land for non-food supply - Very high energy input agriculture is not replicable - High rates of losses and waste of food. - Environmental implications
Keywords: Metal mining conflicts, political ecology, politics of scale, environmental justice movement, social multi-criteria evaluation, consultations, Latin
In the previous sections we have shown how astronomical alignments and solar hierophanies – with a common interest in the solstices − were substantiated in the
The validity of food and nutrient intake obtained with DH-E was estimated using Pearson correlation coefficients between the DH-E conducted at the end of the study (DH-E2) and the
Even though the 1920s offered new employment opportunities in industries previously closed to women, often the women who took these jobs found themselves exploited.. No matter
