TítuloCirculating angiotensin converting enzyme 2 activity in patients with chronic kidney disease without previous history of cardiovascular disease
16
0
0
Texto completo
(2) INTRODUCTION Patients with chronic kidney disease (CKD) have an increased cardiovascular (CV) risk that accounts for more than 50% of the overall mortality [1]. Previous studies have found an independent association between lower levels of the estimated glomerular filtration rate (GFR) and the risk of CV disease (death, CV events and hospitalization). This risk is evident at an estimated GFR of <60 mL/min/1.73 m 2 and increases with an estimated GFR of <45 mL/min/1.73 m2 [2]. The mechanisms that contribute to the pathogenesis of CV disease in CKD are complex and include both traditional and non-traditional CV risk factors [3]. Nonetheless, it is well known that enhanced activation of the renin–angiotensin system (RAS), among others, plays a major role in the progression of cardiac and renal injury [4]. Within the RAS, the angiotensin-converting enzyme (ACE) [5] converts angiotensin (Ang) I into the vasoconstrictor AngII, which mediates its effects predominantly through angiotensin type 1 receptor and is responsible for the pathophysiological effects of the RAS. AngII increases blood pressure and contributes to cardiac remodelling, fibrosis, inflammation, thrombosis and plaque rupture [6]. In 2000, ACE2, an enzyme that cleaves the C-terminal amino acid of AngII to generate the peptide Ang1-7, was identified [7]. Ang1-7 acts via the Mas receptor to counteract the adverse effects of AngII [8]. Previous experimental studies have reported that downregulation of ACE2 leads to age-dependent development of glomerular mesangial expansion, accelerated progression of glomerulosclerosis, tubular injury, macrophage infiltration and interstitial fibrosis [9–11]. ACE2 is an integral cell membrane protein that can undergo cleavage or shedding to release the catalytically active ectodomain into the circulation. Initial studies in a large cohort were able to detect circulating ACE2 activity in only 7.5% of the subjects, and it was ∼100-fold lower than ACE [12]. Interestingly, subjects with detectable ACE2 were older than those without and had a higher prevalence of CV disease, diabetes and hypertension suggesting that ACE2 may be upregulated in subjects with CV disease to counteract the adverse effect of AngII. Subsequent studies demonstrated that circulating ACE2 activity could also be detected in healthy subjects [13] and that soluble ACE2 activity increases in heart failure patients, acute myocardial infarction [14], and correlates with the severity of the heart disease [15]. Circulating ACE2 levels increased in patients with type 1 diabetes and vascular complications [16]. Our group also demonstrated that circulating ACE2 activity can be measured in kidney transplant patients (KT), suggesting that it may be used as a non-invasive marker to understand the role of RAS in KT [17]. Recently, Roberts et al. showed that plasma ACE2 activity was lower in patients undergoing haemodialysis than in pre-dialysis patients with CKD [18]. However, circulating ACE2 activity has not been studied in CKD patients without previous history of CV events. Therefore, the aim of this study was to determine the levels of circulating ACE2 and ACE activities in CKD patients without any history of CV disease and to determine the factors associated with circulating ACE2 and ACE activities in this population.. MATERIALS AND METHODS Patients and variables A total of 2572 subjects from an observational and multicentre study (NEFRONA project), recruited from October 2009 to June 2011, were studied [19, 20]. Male and female patients without history of CV disease (angina pectoris, acute myocardial infarction, ischaemic stroke, haemorrhagic stroke, abdominal aortic aneurysm and atherosclerosis) and in the age range between 18 and 74 years were included in the study. Exclusion criteria were pregnancy, human immunodeficiency virus infection, any type of transplantation or history of transplantation, previous history of carotid artery disease, patients with active infections and/or hospitalized in the last month, and intercurrent illness that presumes the absence of follow-up or survival expectation less than 1 year..
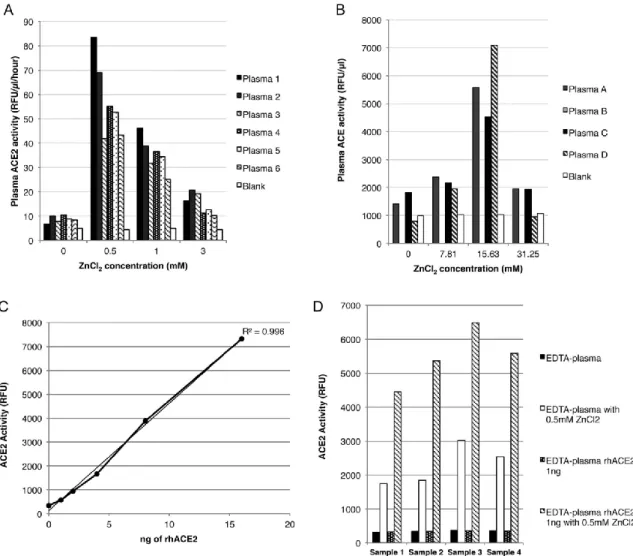
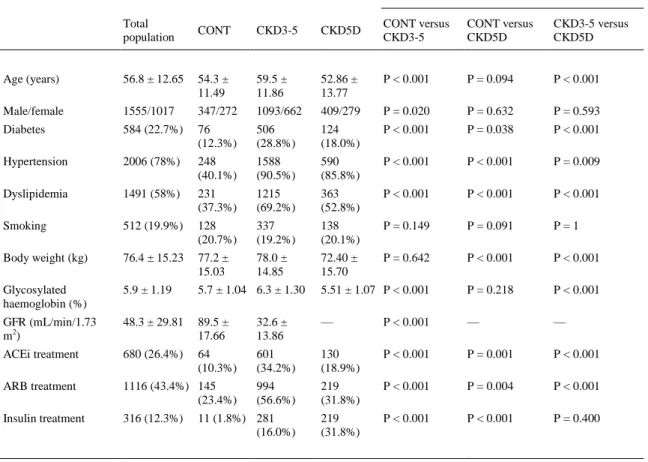
(3) Patients were classified into three groups according to their GFR [modification of diet in renal disease (MDRD)-4]: 1458 non-dialysis patients with CKD at stages 3–5 (CKD3-5, MDRD-4 <60 mL/min/1.73 m2), 546 in dialysis (haemodialysis or peritoneal dialysis) patients (CKD5D) and 568 subjects with MDRD-4 ≥60 mL/min/1.73 m2 were used as controls (CONT). Clinical variables analysed were gender, age, history of diabetes, hypertension, dyslipidemia and smoking (active smokers over the last month). Angiotensin-converting enzyme inhibitor (ACEi), angiotensin receptor blockade (ARB), diabetes medication (insulin and oral antidiabetic drugs) and vitamin D analogues treatments were recorded. Analytical variables analysed were glycaemic (blood glucose and glycosylated haemoglobin), lipid and anaemia profiles. The presence of plaques was determined by ultrasound of the carotid arteries. Ethylenediamine-tetraacetic acid (EDTA)-anticoagulated plasma samples were collected from all patients and controls, centrifuged at 3000 g and then frozen at −80°C until analysis. The protocol has been reviewed and approved by the ethical review board of each hospital, and each participant signed an informed consent document before being included in the study. ACE2 enzymatic assay The ACE2 fluorescent enzymatic assay protocol was performed as previously described by our group, using an ACE2-quenched fluorescent substrate (Mca-Ala-Pro-Lys(Dnp)-OH, BioMol; Enzo, Life Sciences) [14, 17, 21]. Plasma samples were collected into tubes containing EDTA, a chelating agent of loosely bound metal ions such as Zn2+, which acts as a cofactor for carboxypeptidases. As EDTA inhibits ACE2 and ACE activities [22], zinc chloride (ZnCl 2) was added to the plasma samples to avoid its bounding. Briefly, 2 µL of plasma was incubated with buffer (100 mM Tris-HCl, 600 mM NaCl, 10 µM ZnCl2, pH 7.5) in the presence of protease inhibitors (100 µM captopril, 5 µM amastatin, 5 µM bestatin and 10 µM Z-Pro-prolinal) and in the presence of different concentrations of ZnCl 2 (0, 0.5, 1 and 3 mM) (Figure 1A). Samples were incubated with 20 µM of the quenched fluorescent substrate in reaction buffer (final volume 100 µL) at 37°C for 16 h. The optimal concentration of ZnCl 2 for the determination of ACE2 activity was 0.5 mM. ACE2 activity was also calculated in heparin–plasma and serum samples from 21 subjects as previously described [14, 17]. We performed a standard curve of the recombinant human ACE2 (rhACE2, Calbiochem) adding increasing quantities of rhACE2 (0, 1, 2, 4, 8 and 16 ng) (Figure 1C). In a set of experiments, serum and EDTA-plasma samples were incubated with rhACE2 in the presence or absence of ZnCl2. Experiments were carried out in duplicate, and results were expressed as RFU/µL plasma/hour..
(4) FIGURE 1. Circulating ACE2 (A) and ACE (B) enzymatic activities at increased concentrations of zinc chloride (ZnCl2). (C) Standard curve of recombinant human ACE2 (rhACE2). (D) ACE2 activity in EDTA-plasma samples with the rhACE2 and ZnCl2. (A) ACE2 activity was assessed in six different EDTA-plasma samples (1–6) using the following concentrations of ZnCl2: 0, 0.5, 1 and 3 mM. (B) ACE activity was assessed in four different EDTA-plasma samples (A–D) using the following concentrations of ZnCl2: 0, 7.81, 15.63 and 31.25 mM. (C) ACE2 activity was linearly increased with increasing the rhACE2 concentrations. (D) ACE2 activity was assessed in four EDTA-plasma samples with the following conditions: EDTA-plasma alone, EDTA-plasma adding ZnCl2 at a concentration of 0.5 mM, EDTA-plasma adding 1 ng of rhACE2 and EDTA-plasma adding both ZnCl2 at 0.5 mM and 1 ng of rhACE2.. ACE enzymatic assay The ACE fluorescent enzymatic assay was performed as previously described with modifications [23]. ZnCl2 was tested to find the optimal concentration for reversing the effect of EDTA. Briefly, 0.83 µL of plasma with different concentrations of ZnCl2 (0, 7.81, 15.63 and 31.25 mM) (Figure 1B) was incubated with 73 µL of appropriate buffer [0.5 M borate buffer and 5.45 M N-hippuryl-His-Leu (HHL)] at 37°C for 25 min. Finally, the fluorescent adduct of the enzyme-catalysed product l-histidyl-l-leucine was quantified. A concentration of 15.63 mM was found to be optimal for the detection of ACE. ACE activity was also calculated in heparin-plasma and serum samples from 21 subjects as previously described [17]. Experiments were carried out in duplicate, and results were expressed as RFU/µL plasma..
(5) Statistical analysis Normality of continuous variables was assessed by normal probability plots. Variables were expressed as mean ± SE. Paired case-control studies were performed: CONT versus CKD3-5 (280 pairs), CONT versus CKD5D (188 pairs) and CKD3-5 versus CKD5D (360 pairs), with an equal distribution of gender, diabetes, hypertension, dyslipidemia, smoking habits, weight (±5 kg) and age (±3 years). Continuous variables were evaluated by the non-parametric Mann–Whitney test. Bivariate correlations were calculated by Spearman's correlation coefficient. ANOVA was used among plasma ACE2 and ACE activities. The intraclass correlation coefficient (ICC) was used to determine the concordance of the assay between the different human samples. Multiple linear regression analyses, using the natural logarithmic transformation of plasma ACE2 and ACE activities, were carried out to identify independent predictors of enzymatic activity. SPSS version 18.0 for Windows was used for statistical calculations and R package version 3.0.2 was used for case-control studies. P < 0.05 was considered statistically significant.. RESULTS Patient characteristics In total, 2572 patients were included in the study. Circulating ACE2 and ACE activities were measured in 568 CONT subjects and 2004 CKD patients without previous history of CV disease, divided into those not requiring dialysis (CKD3-5) and those in dialysis (CKD5D). Characteristics of study subjects are shown in Table 1. CKD5D patients were younger and thinner than CKD3-5. CKD3-5 and CKD5D patients had higher prevalence of hypertension and dyslipidemia than CONT. NEFRONA is the first large study describing the actual prevalence of subclinical atheromatosis across different CKD stages. The baseline atherosclerosis parameters of the patients have been detailed by Arroyo et al. [24]..
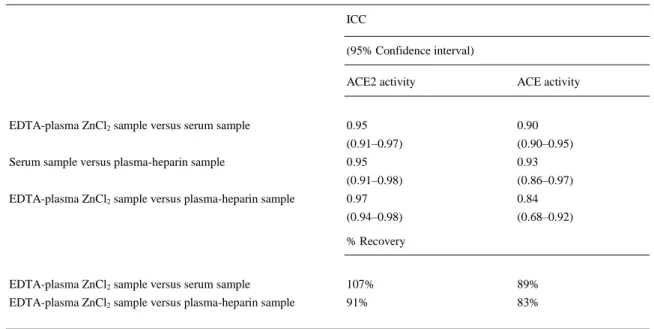
(6) Table 1. Clinical characteristics of study cohorts P-value Total population. CONT. CKD3-5. CKD5D. CONT versus CKD3-5. CONT versus CKD5D. CKD3-5 versus CKD5D. Age (years). 56.8 ± 12.65. 54.3 ± 11.49. 59.5 ± 11.86. 52.86 ± 13.77. P < 0.001. P = 0.094. P < 0.001. Male/female. 1555/1017. 347/272. 1093/662. 409/279. P = 0.020. P = 0.632. P = 0.593. Diabetes. 584 (22.7%). 76 (12.3%). 506 (28.8%). 124 (18.0%). P < 0.001. P = 0.038. P < 0.001. Hypertension. 2006 (78%). 248 (40.1%). 1588 (90.5%). 590 (85.8%). P < 0.001. P < 0.001. P = 0.009. Dyslipidemia. 1491 (58%). 231 (37.3%). 1215 (69.2%). 363 (52.8%). P < 0.001. P < 0.001. P < 0.001. Smoking. 512 (19.9%). 128 (20.7%). 337 (19.2%). 138 (20.1%). P = 0.149. P = 0.091. P=1. Body weight (kg). 76.4 ± 15.23. 77.2 ± 15.03. 78.0 ± 14.85. 72.40 ± 15.70. P = 0.642. P < 0.001. P < 0.001. Glycosylated haemoglobin (%). 5.9 ± 1.19. 5.7 ± 1.04 6.3 ± 1.30. 5.51 ± 1.07 P < 0.001. P = 0.218. P < 0.001. GFR (mL/min/1.73 m2). 48.3 ± 29.81. 89.5 ± 17.66. 32.6 ± 13.86. —. P < 0.001. —. —. ACEi treatment. 680 (26.4%). 64 (10.3%). 601 (34.2%). 130 (18.9%). P < 0.001. P = 0.001. P < 0.001. ARB treatment. 1116 (43.4%) 145 (23.4%). 994 (56.6%). 219 (31.8%). P < 0.001. P = 0.004. P < 0.001. Insulin treatment. 316 (12.3%). 11 (1.8%) 281 (16.0%). 219 (31.8%). P < 0.001. P < 0.001. P = 0.400. Continuous variables are expressed as means ± SD, and categorical variables are represented by the number and the percentage of patients. CONT, control patients; CKD3-5, non-dialysis patients with chronic kidney disease stage 3–5; CKD5D, dialysis patients; ACEi, angiotensin-converting enzyme inhibitors; ARB, angiotensin II receptor blockers.. ACE2 and ACE activities in EDTA-plasma samples We studied ACE and ACE2 activities in EDTA-plasma samples. For this purpose, ACE and ACE2 activities were measured in different conditions: EDTA-plasma samples, EDTA-plasma samples with added ZnCl2, and serum samples and plasma samples collected on heparin from 21 subjects. We found a strong correlation with ICC (≥0.84) between the different studied samples (plasma on EDTA+ZnCl2, heparin and serum) for both ACE2 and ACE activities. In addition, we were able to recover ≥91% of ACE2 activity and ≥83% of ACE activity from EDTA-plasma when ZnCl2 was added to the assays (Table 2)..
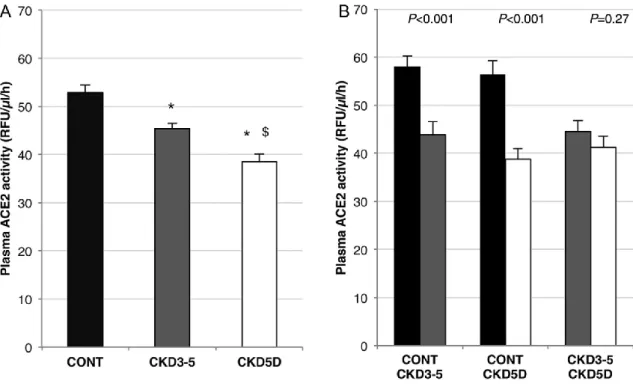
(7) Table 2. ICCs and percentage of recovery for ACE2 and ACE activities between different sample conditions ICC (95% Confidence interval). EDTA-plasma ZnCl2 sample versus serum sample Serum sample versus plasma-heparin sample EDTA-plasma ZnCl2 sample versus plasma-heparin sample. ACE2 activity. ACE activity. 0.95. 0.90. (0.91–0.97). (0.90–0.95). 0.95. 0.93. (0.91–0.98). (0.86–0.97). 0.97. 0.84. (0.94–0.98). (0.68–0.92). % Recovery. EDTA-plasma ZnCl2 sample versus serum sample. 107%. 89%. EDTA-plasma ZnCl2 sample versus plasma-heparin sample. 91%. 83%. In concordance with the non-detectable ACE2 activity observed in EDTA-plasma samples, when rhACE2 was added to the EDTA-plasma, ACE2 activity was not observed (Figure 1D). As expected, when ZnCl2 was added to the EDTA-plasma with rhACE2, ACE2 activity was detected. These results demonstrated that within EDTA-plasma neither endogenous nor exogenous ACE2 activities were detected; however, the addition of zinc to the reaction was able to recover the enzymatic activity. ACE2 activity Circulating ACE2 activity significantly decreased in CKD3-5 as compared with CONT (45.4 ± 1.12 versus 52.9 ± 1.50, P < 0.001) and in CKD5D as compared with CONT (38.5 ± 1.62 versus 52.9 ± 1.50, P < 0.001). In addition, ACE2 significantly decreased in CKD5D as compared with CKD3-5 (38.5 ± 1.62 versus 45.4 ± 1.12, P < 0.001) (Figure 2A). However, when paired case-control studies were performed, no differences between CKD3-5 and CKD5D were found (P = 0.27) (Figure 2B). Therefore, we analysed all groups separately..
(8) FIGURE 2. Circulating ACE2 activity between studied groups. (A) ACE2 activity significantly decreased in CKD3-5 (grey bars) and CKD5D (white bars) patients as compared with CONT (black bars) (*P < 0.001). CKD3-5 showed an increase in plasma ACE2 activity as compared with CKD5D ($P < 0.001). When matching samples with an equal distribution of gender, diabetes, hypertension, dyslipidemia, smoking habits, weight and age (B), ACE2 activity significantly decreased in CKD3-5 and CKD5D as compared with CONT, but no differences were found between CKD3-5 and CKD5D (P = 0.27). CONT, control patients; CKD3-5, non-dialysis patients with chronic kidney disease stage 3–5; CKD5D, dialysis.. Males had significantly increased ACE2 activity when compared with females in all studied groups (P < 0.001). Furthermore, patients with plaques also had increased ACE2 activity as compared with those without plaques (P < 0.001) (Table 3)..
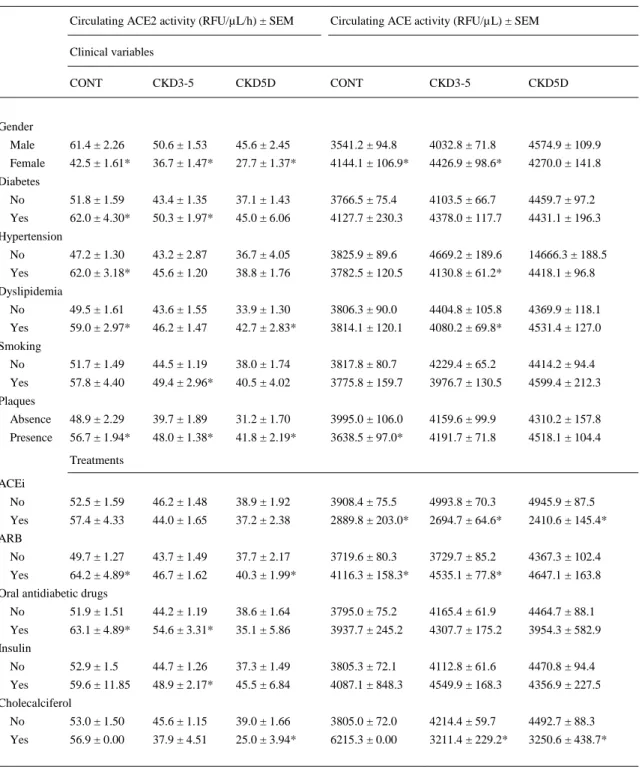
(9) Table 3. Influence of different variables and treatments on circulating ACE2 and ACE activities in each studied group Circulating ACE2 activity (RFU/µL/h) ± SEM. Circulating ACE activity (RFU/µL) ± SEM. Clinical variables CONT. CKD3-5. CKD5D. CONT. CKD3-5. CKD5D. Male. 61.4 ± 2.26. 50.6 ± 1.53. 45.6 ± 2.45. 3541.2 ± 94.8. 4032.8 ± 71.8. 4574.9 ± 109.9. Female. 42.5 ± 1.61*. 36.7 ± 1.47*. 27.7 ± 1.37*. 4144.1 ± 106.9*. 4426.9 ± 98.6*. 4270.0 ± 141.8. No. 51.8 ± 1.59. 43.4 ± 1.35. 37.1 ± 1.43. 3766.5 ± 75.4. 4103.5 ± 66.7. 4459.7 ± 97.2. Yes. 62.0 ± 4.30*. 50.3 ± 1.97*. 45.0 ± 6.06. 4127.7 ± 230.3. 4378.0 ± 117.7. 4431.1 ± 196.3. No. 47.2 ± 1.30. 43.2 ± 2.87. 36.7 ± 4.05. 3825.9 ± 89.6. 4669.2 ± 189.6. 14666.3 ± 188.5. Yes. 62.0 ± 3.18*. 45.6 ± 1.20. 38.8 ± 1.76. 3782.5 ± 120.5. 4130.8 ± 61.2*. 4418.1 ± 96.8. No. 49.5 ± 1.61. 43.6 ± 1.55. 33.9 ± 1.30. 3806.3 ± 90.0. 4404.8 ± 105.8. 4369.9 ± 118.1. Yes. 59.0 ± 2.97*. 46.2 ± 1.47. 42.7 ± 2.83*. 3814.1 ± 120.1. 4080.2 ± 69.8*. 4531.4 ± 127.0. No. 51.7 ± 1.49. 44.5 ± 1.19. 38.0 ± 1.74. 3817.8 ± 80.7. 4229.4 ± 65.2. 4414.2 ± 94.4. Yes. 57.8 ± 4.40. 49.4 ± 2.96*. 40.5 ± 4.02. 3775.8 ± 159.7. 3976.7 ± 130.5. 4599.4 ± 212.3. Absence. 48.9 ± 2.29. 39.7 ± 1.89. 31.2 ± 1.70. 3995.0 ± 106.0. 4159.6 ± 99.9. 4310.2 ± 157.8. Presence. 56.7 ± 1.94*. 48.0 ± 1.38*. 41.8 ± 2.19*. 3638.5 ± 97.0*. 4191.7 ± 71.8. 4518.1 ± 104.4. Gender. Diabetes. Hypertension. Dyslipidemia. Smoking. Plaques. Treatments ACEi No. 52.5 ± 1.59. 46.2 ± 1.48. 38.9 ± 1.92. 3908.4 ± 75.5. 4993.8 ± 70.3. 4945.9 ± 87.5. Yes. 57.4 ± 4.33. 44.0 ± 1.65. 37.2 ± 2.38. 2889.8 ± 203.0*. 2694.7 ± 64.6*. 2410.6 ± 145.4*. No. 49.7 ± 1.27. 43.7 ± 1.49. 37.7 ± 2.17. 3719.6 ± 80.3. 3729.7 ± 85.2. 4367.3 ± 102.4. Yes. 64.2 ± 4.89*. 46.7 ± 1.62. 40.3 ± 1.99*. 4116.3 ± 158.3*. 4535.1 ± 77.8*. 4647.1 ± 163.8. ARB. Oral antidiabetic drugs No. 51.9 ± 1.51. 44.2 ± 1.19. 38.6 ± 1.64. 3795.0 ± 75.2. 4165.4 ± 61.9. 4464.7 ± 88.1. Yes. 63.1 ± 4.89*. 54.6 ± 3.31*. 35.1 ± 5.86. 3937.7 ± 245.2. 4307.7 ± 175.2. 3954.3 ± 582.9. No. 52.9 ± 1.5. 44.7 ± 1.26. 37.3 ± 1.49. 3805.3 ± 72.1. 4112.8 ± 61.6. 4470.8 ± 94.4. Yes. 59.6 ± 11.85. 48.9 ± 2.17*. 45.5 ± 6.84. 4087.1 ± 848.3. 4549.9 ± 168.3. 4356.9 ± 227.5. Insulin. Cholecalciferol No. 53.0 ± 1.50. 45.6 ± 1.15. 39.0 ± 1.66. 3805.0 ± 72.0. 4214.4 ± 59.7. 4492.7 ± 88.3. Yes. 56.9 ± 0.00. 37.9 ± 4.51. 25.0 ± 3.94*. 6215.3 ± 0.00. 3211.4 ± 229.2*. 3250.6 ± 438.7*. CONT, control patients; CKD3-5, non-dialysis patients with chronic kidney disease stage 3–5; CKD5D, dialysis patients; ACEi, angiotensin-converting enzyme inhibitors; ARB, angiotensin II receptor blockers. *P < 0.05 (no versus yes, male versus female and absence versus presence)..
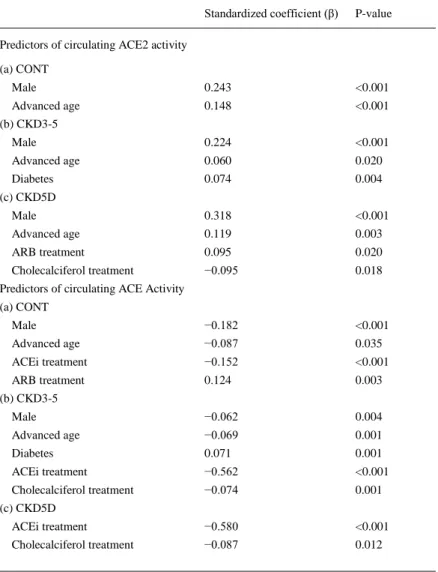
(10) CONT and CKD3-5 with diabetes showed increased circulating ACE2 activity as compared with nondiabetic patients (P = 0.003 and P < 0.001). However, no differences were observed in dialysis patients (P = 0.60). Hypertension was also associated with increased ACE2 activity in CONT (P < 0.001) (Table 3). Patients with dyslipidemia showed increased levels of circulating ACE2 in CONT (P < 0.001) and CKD5D (P = 0.028), but no differences were found in CKD3-5 (P = 0.53). Interestingly, smokers had significantly increased circulating ACE2 activity as compared with non-smoker CKD3-5 (P = 0.03) (Table 3). We found a significant direct correlation between ACE2, age and glycosylated haemoglobin in both CONT (P < 0.001) and CKD3-5 (P < 0.05). In addition, a direct correlation between ACE2 and age was found in CKD5D (P = 0.038). Circulating ACE2 activity significantly increased in CONT and CKD5D on ARBs therapy as compared with non-treated patients (P = 0.002). Treatment with ACEi had no influence on circulating ACE2 (Table 3). ACE2 activity also increased in CONT (P = 0.007) and CKD3-5 (P < 0.001) under oral antidiabetic agents as compared with non-treated. In addition, insulin therapy increased ACE2 activity in CKD3-5 (P < 0.001) (Table 3). Surprisingly, circulating ACE2 decreased in CKD5D treated with cholecalciferol as compared with non-treated patients (P = 0.027) (Table 3). By multivariate linear regression analysis (Table 4), male gender and advanced age were identified as independent predictors of circulating ACE2 activity in all studied groups. Diabetes was also identified as independent predictor of ACE2 activity in CKD3-5. In addition, ARBs and cholecalciferol therapies were independent predictors of ACE2 in CKD5D..
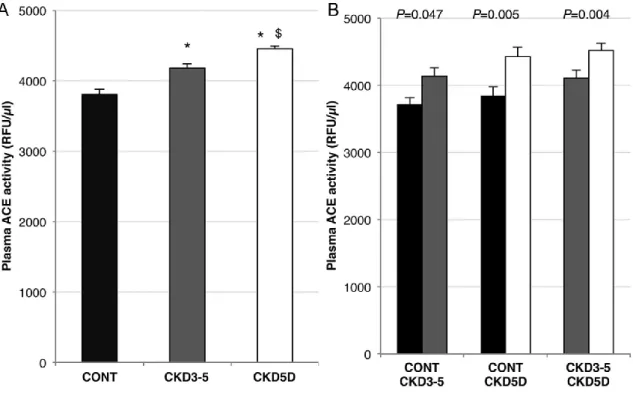
(11) Table 4. Multiple linear regression analysis of potential predictors of circulating ACE2 and ACE activities Standardized coefficient (β). P-value. Male. 0.243. <0.001. Advanced age. 0.148. <0.001. Male. 0.224. <0.001. Advanced age. 0.060. 0.020. Diabetes. 0.074. 0.004. Male. 0.318. <0.001. Advanced age. 0.119. 0.003. ARB treatment. 0.095. 0.020. Cholecalciferol treatment. −0.095. 0.018. Male. −0.182. <0.001. Advanced age. −0.087. 0.035. ACEi treatment. −0.152. <0.001. ARB treatment. 0.124. 0.003. Male. −0.062. 0.004. Advanced age. −0.069. 0.001. Diabetes. 0.071. 0.001. ACEi treatment. −0.562. <0.001. Cholecalciferol treatment. −0.074. 0.001. ACEi treatment. −0.580. <0.001. Cholecalciferol treatment. −0.087. 0.012. Predictors of circulating ACE2 activity (a) CONT. (b) CKD3-5. (c) CKD5D. Predictors of circulating ACE Activity (a) CONT. (b) CKD3-5. (c) CKD5D. Data are expressed as regression coefficients and P-value. Dependent variables: circulating ACE2 activity (expressed in LnACE2) and circulating ACE activity (expressed in LnACE). CONT, control patients; CKD3-5, non-dialysis patients with chronic kidney disease stage 3–5; CKD5D, dialysis patients; ACEi, angiotensin-converting enzyme inhibitors; ARB, angiotensin II receptor blockers.. ACE activity Circulating ACE activity significantly increased in CKD3-5 as compared with CONT (4181.65 ± 58.37 versus 3809.13 ± 71.96, P = 0.035) and in CKD5D as compared with CONT (4454.48 ± 87.10 versus 3809.13 ± 71.96, P < 0.001). In addition, ACE activity significantly increased in CKD5D as compared with CKD3-5 (4454.48 ± 87.10 versus 4181.65 ± 58.37, P = 0.001) (Figure 3A). In concordance, when paired case-control studies were performed, the same results were observed (Figure 3B)..
(12) FIGURE 3. Circulating ACE activity between studied groups. (A) ACE activity was increased in CKD3-5 (grey bars) (*P = 0.035) and in CKD5D (white bars) (*<0.001) as compared with CONT (black bars). CKD5D showed an increase in plasma ACE activity as compared with CKD3-5 ($P = 0.001). When assessing a paired case-control study (B), same results were obtained. CONT, control patients; CKD3-5, non-dialysis patients with chronic kidney disease stage 3–5; CKD5D, dialysis.. Females had increased circulating ACE activity as compared with males in CONT and CKD3-5 (P < 0.001). However, no differences were observed in CKD5D (P = 0.057) (Table 3). CONT with the presence of plaques showed decreased levels of circulating ACE activity as compared with those without plaques (P = 0.011). However, no differences were observed in CKD3-5 and CKD5D. ACE activity decreased in CKD3-5 with hypertension or dyslipidemia as compared with nonhypertensive (P = 0.001) or without dyslipidemia (P = 0.004) (Table 3). We found a significant indirect correlation between circulating ACE activity, age (P = 0.033) and glycosylated haemoglobin (P = 0.019) in CONT. Increased ACE activity was found in CONT and CKD3-5 in ARBs therapy as compared with nontreated patients. As expected, subjects treated with ACEi had lower levels of ACE activity as compared with non-treated subjects in all groups. ACE activity decreased in CKD3-5 and CKD5D treated with cholecalciferol as compared with non-treated (Table 3). By multiple regression analysis (Table 4), female gender and younger age were identified as independent predictors of circulating ACE activity in CONT and CKD3-5. Diabetes was also identified as an independent predictor of circulating ACE activity in CKD3-5. As well as in the bivariate analysis, ACEi therapy was inversely associated with ACE activity in all studied groups. Furthermore, cholecalciferol treatment was found as an independent predictor of ACE activity in CKD3-5 and CKD5D. ARBs therapy was identified as an independent predictor of circulating ACE activity in CONT..
(13) DISCUSSION The present study demonstrates that circulating ACE2 and ACE activities may be measured in human EDTA-plasma. This is the first study showing that circulating ACE2 activity decreased in CKD3-5 and dialysis patients without previous history of CV disease. In addition, we also showed that ACE2 correlates with the classical CV risk factors namely male gender, advanced age and diabetes in CKD3-5, and male gender and advanced age in CKD5D. ACE2 enzymatic activity has been widely studied in renal, heart and other tissues under physiological and pathological conditions [21, 22]. However, few studies have assessed human circulating ACE2 activity, and the majority of them measured ACE2 activity in serum or heparin blood samples [12, 13]. We previously measured circulating ACE2 activity in serum from KT and acute myocardial infarction patients [14, 17]. Initially, we were not able to measure ACE2 activity in EDTA-plasma samples. The chelating agent EDTA completely inhibits tissue ACE2 and soluble secreted ACE2 from chinese hamster ovary cell media activity, by chelating the zinc ion required for the metalloprotease activity [22, 25]. Hence, we made an effort to measure ACE2 activity in EDTA-plasma samples. We demonstrated by adding zinc chloride and subsequently avoiding the EDTA chelating effect that ACE2 and ACE activities could be measured. Roberts et al. [18] demonstrated that plasma ACE2 activity decreased in dialysis patients. In those patients, male gender and diabetes were associated with increased ACE2, while RAS blockade did not affect circulating ACE2. However, in their study, the sample size was small and healthy subjects used for comparison were not contemporaneous with CKD patients. Here, we present a study with larger sample size (n = 2572) and contemporaneous study groups. Note that in our study, patients had no history of CV disease. In agreement with Roberts et al., we initially found circulating ACE2 activity decreased in dialysis patients. As expected, measurement of circulating ACE2 pre- and post-dialysis showed no differences (data not shown), demonstrating that the enzyme is not removed by dialysis. One surmises that the haemodialysis itself could not alter the levels of the ACE2 activity in plasma owing to its large molecular size [26]. In our study, dialysis patients were younger than CKD3-5 and control groups. When paired case-control studies were performed, the differences among the CKD groups were not observed, suggesting that the decrease in ACE2 within the dialysis patients may be ascribed to age. Within CKD5D, CKD3-5 and CONT, a significant difference in the level of circulating ACE2 activity was demonstrated between males and females. Our results confirm the work of others, who showed that circulating ACE2 is sex dependent, with higher levels in males [16–18]. Data from animal models suggest that soluble ACE2 shedding is stimulated by the tumour necrosis factor-α convertase ADAM17 [27–29]. It is possible that the increase in ACE2 in males may be related to the increase in ADAM17 shedding. Further studies focused on the ADAM17/ACE2 axis and gender differences are needed to confirm this premise. Many studies have associated circulating ACE2 activity with higher risk of CV disease. Epelman et al. [15] have previously demonstrated that circulating ACE2 activity is elevated in patients with diagnosis of heart failure. In recent studies from our group, we showed that ACE2 activity is up-regulated in the acute phase of ST-elevation myocardial infarction and correlates with the infarct size [14]. Furthermore, KT patients with a previous history of ischaemic heart disease presented increased ACE2 activity [17]. Soro-Paavonen et al. demonstrated that circulating ACE2 increased in patients with diabetes and decreased eGFR or other vascular complications such as CV disease [16]. In concordance, in our study, we demonstrated that ACE2 activity also increases in diabetic CKD patients and it correlates with glycosylated haemoglobin. In mice with experimental diabetes, ACE2 activity increased in the renal cortex and in the circulation, suggesting a potential mechanism to adapt to diabetes-associated AngII overactivity [21, 22]. As circulating ACE2 activity increase starts at an early stage of diabetes and correlates with GFR, the measurement of ACE2 activity may become a new biomarker of CV disease in CKD..
(14) Circulating ACE activity increased in CKD3-5 and CKD5D without previous history of CV disease. We have demonstrated that ACE activity correlates with the classical CV risk factors such as male, advanced age and diabetes in CKD3-5. As expected, ACEi therapy was inversely associated with ACE activity in all groups. In concordance with our results, some studies have found lower levels of circulating ACE in subjects with a history of hypertension [12] and higher levels in diabetic patients with renal complications [30]. However, other studies have not found a relationship between circulating ACE and the classical CV risk factors [17, 31, 32]. We surmise that the incongruences observed between studies and populations may be ascribed to the effect of RAS blockade on circulating ACE. For ethical reasons, RAS blockade agents were not stopped for the study. In conclusion, this study shows that circulating ACE2 and ACE activities can be recovered and detected in human EDTA-plasma samples by adding zinc chloride. In addition, ACE2 activity directly correlated with the classical CV risk factors such as male gender, diabetes and older age. These findings may have therapeutic implications for CV disease and help to delay the progression of CKD. Prospective studies with a short- and long-term follow-up will help us to elucidate the ACE2 role as a biomarker in CKD.. ACKNOWLEDGEMENTS This work was made with funding from the projects ISCIII-FEDER. PI 11/01549 and ISCIII-RETIC REDinREN RD12/0021/0024. The authors would like to thank Anna Faura and its team from Hospital del Mar and the NEFRONA team (Eva Castro, Virtudes María, Teresa Molí, Meritxell Soria) and the Biobank of RedInRen for their invaluable support. The NEFRONA study is funded by a research grant from AbbVie and the Spanish Government RETIC (RD12/0021) and FIS PI13/01565. The NEFRONA study investigator group is composed by the following: Aladrén Regidor, Mª José. Hospital Comarcal Ernest Lluch (Calatayud); Almirall, Jaume; Ponz, Esther. Corporació Parc Taulí (Barcelona); Arteaga Coloma, Jesús. Hospital de Navarra (Pamplona); Bajo Rubio, Mª Auxiliadora. Hospital La Paz (Madrid); Belart Rodríguez, Montserrat. Sistemes Renals (Lleida); Bielsa-García. Sara. Hospital Obispo Polanco (Teruel); Bover Sanjuan, Jordi. Fundació Puigvert. IIB Sant Pau (Barcelona); Bronsoms Artero, Josep. Clínica Girona (Girona); Cabezuelo Romero, Juan B; Muray Cases, Salomé. Hospital Reina Sofía (Murcia); Calviño Varela, Jesús. Hospital Universitario Lugus Augusti (Lugo); Caro Acevedo, Pilar. Clínica Ruber (Madrid); Carreras Bassa, Jordi. Diaverum Baix Llobregat (Barcelona); Cases Amenós, Aleix; Massó Jiménez, Elisabet. Hospital Clínic (Barcelona); Castilla Pérez, Jesús. Hospital de la Defensa (Zaragoza); Cigarrán Guldris, Secundino; López Prieto, Saray. Hospital Da Costa (Lugo); Comas Mongay, Lourdes. Hospital General de Vic (Barcelona); Comerma, Isabel. Hospital General de Manresa (Barcelona); Compte Jové, Mª Teresa. Hospital Santa Creu Jesús (Tarragona); Cuberes Izquierdo, Marta. Hospital Reina Sofía (Navarra); de Álvaro, Fernando; Hevia Ojanguren, Covadonga. Hospital Infanta Sofía (Madrid); de Arriba de la Fuente, Gabriel. Hospital Universitario Guadalajara (Guadalajara); del Pino y Pino, Mª Dolores. Complejo Hospitalario Universitario Torrecardenas (Almería); Diaz-Tejeiro Izquierdo, Rafael. Hospital Virgen de la Salud (Toledo); Dotori, Marta. USP Marbella (Málaga); Duarte, Verónica. Hospital de Terrassa (Barcelona); Estupiñan Torres, Sara. Hospital Universitario Canarias (Santa Cruz de Tenerife); Fernández Reyes, Mª José. Hospital de Segovia (Segovia); Fernández Rodríguez, Mª Loreto. Hospital Príncipe de Asturias (Madrid); Fernández, Guillermina. Clínica Santa Isabel (Sevilla); Galán Serrano, Antonio. Hospital General Universitario de Valencia (Valencia); García Cantón, Cesar. Hospital Universitario Insular de Gran Canaria (Las Palmas); García Herrera, Antonio L. Hospital Universitario Puerto Real (Cádiz); García Mena, Mercedes. Hospital San Juan de Dios (Zaragoza); Gil Sacaluga, Luis; Aguilar, Maria. Hospital Virgen del Rocío (Sevilla); Górriz, José Luis. Hospital Universitario Doctor Peset (Valencia); Huarte Loza, Emma. Hospital San Pedro (Logroño); Lerma, José Luis. Hospital Universitario Salamanca (Salamanca); Liebana Cañada, Antonio. Hospital de Jaén (Jaén); Marín Álvarez, Jesús Pedro. Hospital San Pedro de Alcántara (Cáceres); Martín Alemany, Nàdia. Hospital Josep Trueta (Girona); Martín García, Jesús. Hospital Nuestra Señora de Sonsoles (Ávila); Martínez Castelao, Alberto. Hospital Universitari de Bellvitge (Barcelona); Martínez Villaescusa, María. Complejo Hospitalario Universitario de Albacete (Albacete); Martínez, Isabel. Hospital Galdakao (Bilbao); Moina Eguren, Iñigo. Hospital Basurto (Bilbao); Moreno Los Huertos, Silvia. Hospital Santa.
(15) Bárbara (Soria); Mouzo Mirco, Ricardo. Hospital El Bierzo, Ponferrada (León); Munar Vila, Antonia. Hospital Universitari Son Espases (Palma de Mallorca); Muñoz Díaz, Ana Beatriz. Hospital Virgen del Consuelo (Valencia); Navarro González, Juan F. Hospital Universitario Nuestra Señora de Candelaria (Santa Cruz de Tenerife); Nieto, Javier; Carreño, Agustín. Hospital General Universitario de Ciudad Real (Ciudad Real); Novoa Fernández, Enrique. Complexo Hospitalario de Ourense (Ourense); Ortiz, Alberto; Fernandez, Beatriz. IIS-Fundación Jiménez Díaz (Madrid); Paraíso, Vicente. Hospital Universitario del Henares (Madrid); Pérez Fontán, Miguel. Complejo Hospitalario Universitario A Coruña (A Coruña); Peris Domingo, Ana. Hospital Francesc de Borja (Valencia); Piñera Haces, Celestino. Hospital Universitario Marqués de Valdecilla (Santander); Prados Garrido, Mª Dolores. Hospital Universitario San Cecilio (Granada); Prieto Velasco, Mario. Hospital de León (León); Puig Marí, Carmina. Hospital d'Igualada (Barcelona); Rivera Gorrín, Maite. Hospital Universitario Ramón y Cajal (Madrid); Rubio, Esther. Hospital Puerta del Hierro (Madrid); Ruiz, Pilar. Hospital Sant Joan Despí Moisès Broggi (Barcelona); Salgueira Lazo, Mercedes; Martínez Puerto, Ana Isabel. Hospital Virgen Macarena (Sevilla); Sánchez Tomero, José Antonio. Hospital Universitario de la Princesa (Madrid); Sánchez, José Emilio. Hospital Universitario Central de Asturias (Oviedo); Sans Lorman, Ramon. Hospital de Figueres (Girona); Saracho, Ramon. Hospital de Santiago (Vitoria); Sarrias, Maria; Prat, Oreto. Hospital Universitari Vall d'Hebron (Barcelona); Sousa, Fernando. Hospital Rio Carrión (Palencia); Toran, Daniel. Hospital General de Jerez (Cadiz); Tornero Molina, Fernando. Hospital de Sureste (Arganda del Rey); Usón Carrasco, José Javier. Hospital Virgen de la Luz (Cuenca); Valera Cortes, Ildefonso. Hospital Virgen de la Victoria (Málaga); Vilaprinyo del Perugia, Mª Merce. Institut Catala d'Urologia i Nefrologia (Barcelona); and Virto Ruiz, Rafael C. Hospital San Jorge (Huesca).. CONFLICT OF INTEREST STATEMENT None declared.. REFERENCES 1. 2. 3.. 4. 5.. 6. 7.. 8. 9.. 10.. Moreso F, Calvo N, Pascual J et al. Early statin use is an independent predictor of long-term graft survival. NDT Plus 2010; 3: ii26 – ii31 Go AS, Chertow GM, Fan D et al. Chronic kidney disease and the risks of death, cardiovascular events, and hospitalization. N Engl J Med 2004; 351: 1296 – 1305 Betriu A, Martinez-Alonso M, Arcidiacono MV et al. Prevalence of subclinical atheromatosis and associated risk factors in chronic kidney disease: the NEFRONA study. Nephrol Dial Transplant 2014; 29: 1415 – 1422 Velez JC. The importance of the intrarenal renin-angiotensin system. Nat Clin Pract Nephrol 2009; 5: 89 – 100 Acevedo HR, Rojas MD, Arceo SD et al. Effect of 6-nonadecyl salicylic acid and its methyl ester on the induction of micronuclei in polychromatic erythrocytes in mouse peripheral blood. Mutat Res 2006; 609: 43 – 46 Patel SK, Velkoska E, Burrell LM. Emerging markers in cardiovascular dis- ease: where does angiotensin-converting enzyme 2 fit in? Clin Exp Pharmacol Physiol 2013; 40: 551 – 559 Donoghue M, Hsieh F, Baronas E et al. A novel angiotensin-converting enzyme-related carboxypeptidase (ACE2) converts angiotensin I to angioten- sin 1 – 9. Circ Res 2000; 87: E1 – E9 Santos RA, Simoes e Silva AC, Maric C et al. Angiotensin-(1– 7) is an endogenous ligand for the G protein-coupled receptor Mas. Proc Natl Acad Sci USA 2003; 100: 8258 – 8263 9. Shiota A, Yamamoto K, Ohishi M et al. Loss of ACE2 accelerates time- dependent glomerular and tubulointerstitial damage in streptozotocin-induced diabetic mice. Hypertens Res 2010; 33: 298 – 307 Oudit GY, Herzenberg AM, Kassiri Z et al. Loss of angiotensin-converting enzyme-2 leads to the late development of angiotensin II-dependent glomerulosclerosis. Am J Pathol 2006; 168: 1808 – 1820.
(16) 11.. 12.. 13. 14.. 15.. 16. 17. 18. 19.. 20.. 21. 22. 23. 24.. 25.. 26.. 27. 28. 29.. 30.. 31. 32.. Soler MJ, Wysocki J, Ye M et al. ACE2 inhibition worsens glomerular injury in association with increased ACE expression in streptozotocin-induced diabetic mice. Kidney Int 2007; 72: 614 – 623 Rice GI, Jones AL, Grant PJ et al. Circulating activities of angiotensin- converting enzyme, its homolog, angiotensin-converting enzyme 2, and neprilysin in a family study. Hypertension 2006; 48: 914 – 920 Lew RA, Warner FJ, Hanchapola I et al. Angiotensin-converting enzyme 2 catalytic activity in human plasma is masked by an endogenous inhibitor. Exp Physiol 2008; 93: 685 – 693 Ortiz-Perez JT, Riera M, Bosch X et al. Role of circulating angiotensin con- verting enzyme 2 in left ventricular remodeling following myocardial infarction: a prospective controlled study. PLoS One 2013; 8: e61695 Epelman S, Tang WH, Chen SY et al. Detection of soluble angiotensin-con- verting enzyme 2 in heart failure: insights into the endogenous counter- regulatory pathway of the reninangiotensin-aldosterone system. J Am Coll Cardiol 2008; 52: 750 – 754 Soro-Paavonen A, Gordin D, Forsblom C et al. Circulating ACE2 activity is increased in patients with type 1 diabetes and vascular complications. J Hypertens 2012; 30: 375 – 383 Soler MJ, Riera M, Crespo M et al. Circulating angiotensin-converting enzyme 2 activity in kidney transplantation: a longitudinal pilot study. Nephron Clin Pract 2012; 121: c144 – c150 Roberts MA, Velkoska E, Ierino FL et al. Angiotensin-converting enzyme 2 activity in patients with chronic kidney disease. Nephrol Dial Transplant 2013; 28: 2287 – 2294 Junyent M, Martinez M, Borras M et al. Predicting cardiovascular disease morbidity and mortality in chronic kidney disease in Spain. The rationale and design of NEFRONA: a prospective, multicenter, observational cohort study. BMC Nephrol 2010; 11: 14 Junyent M, Martinez M, Borras M et al. [Usefulness of imaging techniques and novel biomarkers in the prediction of cardiovascular risk in patients with chronic kidney disease in Spain: the NEFRONA project]. Nefrologia 2010; 30: 119 – 126 Riera M, Marquez E, Clotet S et al. Effect of insulin on ACE2 activity and kidney function in the non-obese diabetic mouse. PLoS One 2014; 9: e84683 Wysocki J, Ye M, Soler MJ et al. ACE and ACE2 activity in diabetic mice. Diabetes 2006; 55: 2132 – 2139 Schwager SL, Carmona AK, Sturrock ED. A high-throughput fluorimetric assay for angiotensin I-converting enzyme. Nat Protoc 2006; 1: 1961 – 1964 Arroyo D, Betriu A, Martinez-Alonso M et al. Observational multicenter study to evaluate the prevalence and prognosis of subclinical atheromatosis in a Spanish chronic kidney disease cohort: baseline data from the NEFRO- NA study. BMC Nephrol 2014; 15: 168 Tipnis SR, Hooper NM, Hyde R et al. A human homolog of angiotensin- converting enzyme. Cloning and functional expression as a captopril- insensitive carboxypeptidase. J Biol Chem 2000; 275: 33238 – 33243 Wysocki J, Batlle D. Reduced plasma ACE2 activity in dialysis patients: another piece in the conundrum of factors involved in hypertension and cardiovascular morbidity? Nephrol Dial Transplant 2013; 28: 2200 – 2202 Xiao F, Zimpelmann J, Agaybi S et al. Characterization of angiotensin-con- verting enzyme 2 ectodomain shedding from mouse proximal tubular cells. PLoS One 2014; 9: e85958 Salem ES, Grobe N, Elased KM. Insulin treatment attenuates renal ADAM17 and ACE2 shedding in diabetic Akita mice. Am J Physiol Renal Physiol 2014; 306: F629 – F639 Lambert DW, Yarski M, Warner FJ et al. Tumor necrosis factor-alpha convertase (ADAM17) mediates regulated ectodomain shedding of the severe-acute respiratory syndrome-coronavirus (SARS-CoV) receptor, angiotensin-converting enzyme-2 (ACE2). J Biol Chem 2005; 280: 30113 – 30119 Marre M, Bernadet P, Gallois Y et al. Relationships between angiotensin I converting enzyme gene polymorphism, plasma levels, and diabetic retinal and renal complications. Diabetes 1994; 43: 384 – 388 Cambien F, Costerousse O, Tiret L et al. Plasma level and gene polymorph- ism of angiotensinconverting enzyme in relation to myocardial infarction. Circulation 1994; 90: 669 – 676 Alhenc-Gelas F, Richard J, Courbon D et al. Distribution of plasma angiotensin I-converting enzyme levels in healthy men: relationship to environmental and hormonal parameters. J Lab Clin Med 1991; 117: 33 – 39.
(17)
Figure
+4
Documento similar
Analysis of two questionnaires on quality of life of Chronic Obstructive Pulmonary Disease patients*
George Respiratory Questionnaire and Chronic Obstructive Pulmonary Disease Assessment Test in patients with chronic obstructive pulmonary disease based on correlation and
Liabeuf et al., “Serum indoxyl sul- fate is associated with vascular disease and mortality in chronic kidney disease patients,” Clinical Journal of the American Society of
ATR2, angiotensin receptor 2; BNP, brain natriuretic peptide; CCL5, chemokine (C-C Motif) ligand 5; COVID-19, coronavirus disease-19; CRP, C-reactive protein; CV, cardiovascular;
Objective: We examined physician perception of blood pressure control and treatment behavior in patients with previous cardiovascular disease and uncontrolled hypertension as defined
Abbreviations: ACE, angiotensin converting enzyme; Ang II, angiotensin II, ARB, angiotensin receptor blockers; ARE, antioxidant responsive element; AT1R, angiotensin II receptor type
The patients with ADPKD included in the study had worse renal function (worse mean estimated by glomerular filtration rate [eGFR], more in patients with CKD stage 4) and
Canagliflozin and Renal Outcomes in Type 2 Diabetes and Nephropathy (CREDENCE), Dapagliflozin on Renal Outcomes and Cardiovascular Mortality in Patients with Chronic Kidney
A Study on the Relationship between Serum Beta 2-Microglobulin Levels, Underlying Chronic Kidney Disease, and Peripheral Arterial Disease in High-Vascular-Risk
