Analysing spatiotemporal patterns of antibiotics prescriptions
7
0
0
Texto completo
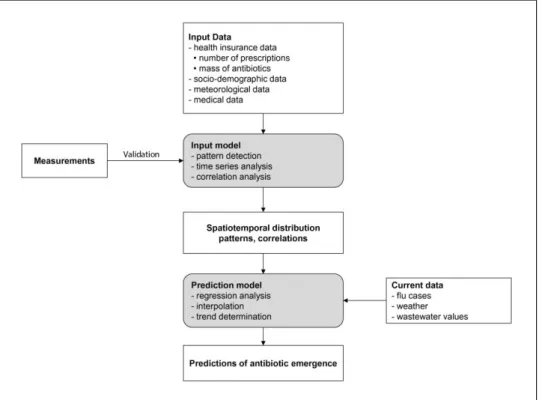
(2) AGILE 2014 – Castellón, June 3-6, 2014. Figure 1: Schema of input model and prediction model. conducted to better understand the actual antibiotic fluxes and the genesis of antibiotic resistance within the sewer system and (2) data driven (statistical) models are getting designed to serve as best estimated guesses on where antibiotics are being released and how they are transported through the sewage system. Figure 1 sketches the conceptual frame for these models and consists of two components: 1. An input model has been designed to analyse historical prescription data, socio-economic data and environmental data to identify typical spatiotemporal patterns of the antibiotic medications, to estimate related antibiotic fluxes into to the sewer system and to evaluate these estimates against different measurements within the sewer system. 2. The input model then serves as the basis for a prediction model to estimate the future release and fluxes of antibiotics into the sewer system. The prediction model shall serve to alert the urban waste water treatment and environmental agencies about the potential occurrence of antibiotic peaks in the sewage and the released waste water. As the treatment of antibiotics is not part of the operational waste water treatment these alerts could also trigger related specific measurements in the sewage plant. The main objective of the input model is to use spatial statistical tools to investigate the variation of antibiotic inputs in time and within the urban districts of Dresden as well as correlate it with other influencing factors that might have an impact at the variation of the antibiotic prescriptions. This paper focuses the design and results of the input model and will discuss some initial design ideas for the prediction model.. 2.1. Input Data. Basis for the input model are data about the ambulant antibiotic prescriptions that have been provided by one of the German compulsory health insurances (AOK PLUS). These data are available in a weekly and monthly temporal resolution for the period from 2005 to 2012. The data are provided for the 64 urban districts of the city of Dresden and aggregated into three age groups: 0 to 14 years, 15 to 64 years, 65 and more years. The following antibiotic substances of various active ingredient groups are examined: amoxicillin, azithromycin, cefuroxime, ciprofloxacin, clarithromycin, clindamycin, doxycycline, levofloxacin-ofloxacin, phenoxymethyl penicillin, roxithromycin and sulfamethoxazole-trimethoprim. Several issues arose when analysing the prescription data from the health insurance. First, the supplied data comprise only the patients of this single insurance company, which represent about 41% of the population of Dresden. So the prescription data is extrapolated to the total population of Dresden. Second, due to medical data protection issues prescription amounts between 1 and 3 are anonymised. In the calculations this problem is handled by setting all anonymised values to the minimum amount of 1. Third, the data can only be delivered with a delay of at least one year. Consequently up-to-date official prescription data are not available for the studies. This fact is seriously hampering the prediction of future antibiotics release into the urban sewer system. To overcome the latter problem it was necessary to identify data of other influencing factors that are related to antibiotic prescriptions and would eventually serve as a proxy for a prediction of antibiotic medication. The identified major influence factors are presented in the following..
(3) AGILE 2014 – Castellón, June 3-6, 2014. Several studies have shown that there is a correlation between respiratory infections and antibiotic prescriptions. On the one hand for the majority of treated cases of respiratory diseases antibiotics are prescribed. This is evident especially during the annual cold waves and winter flu season, which regularly are accompanied by a significant increase of antibiotic prescriptions [4, 8, 20]. On the other hand often a secondary bacterial infection follows a flu infection, as the organism is already weakened due to the fight against the viruses. Therefore bacteria can more easily lead to further infections that are then often treated by the use of antibiotics – where partially antibiotic prescriptions are filled prophylactically, without bacterial caused symptoms being already present [10, 18]. For these reasons contemporary available representative data about current cases of respiratory diseases have been considered as potential proxies for the input model. Such data is provided by the flu trends portal from Google2. Ginsberg et al. [6] have analysed billions of Google search requests and determined that there is a high correlation between the frequency of particular search terms and the actual number of patients with influenza-like symptoms at a time. For the validation of their results they used historical data of traditional influenza surveillance systems. For Germany Google Flu Trends provides the weekly cases of respiratory infections per 100,000 inhabitants at a Federal State level from 2003 up to the current week [7]. Other influencing factors that have been identified and incorporated into the input model are meteorological (temperature, precipitation, etc.) and sociodemographic (population, employment structure) parameters. For the meteorological parameters the Regional Climate Information System for Saxony, Saxony-Anhalt and Thuringia (ReKIS)3 is used. This database contains – for the city of Dresden – data for 3 climate stations and 3 precipitation stations in a daily resolution for the years 1961 to 2013. At the most comprehensive station about 16 parameters are determined. For the sociodemographic parameters data from the Dresden statistics office is used4. It provides yearly data at an urban district level about the population, discriminated by sex and nine age groups and data on employees and unemployed persons as relative proportions of the relevant age group. The health insurance company AOK PLUS provided data on the age structure of their patients in 5 age groups at the urban district level for the year 2011. Most of the input data described here can be explored via the ANTI-Resist Geoportal5.. 2.2. Methods. In a first step the antibiotic prescriptions have been modelled regarding their temporal and spatial distribution using various statistical and GIS-based methods. The temporal analysis has been carried out by time series analysis in R using the STL function, which decomposes a 2. http://google.org/flutrends/. 3. http://www.rekis.org. 4. www.dresden.de/de/02/06/auskunft/medien/atlas.html. 5. http://antiresist.dyndns.org/client/. time series into three components: seasonal variation, longterm trend and random noise (remainder component) [3]. Thus, the temporal variation of the prescriptions of the individual antibiotic substances in the overall city as well as in the individual urban districts could be examined as to whether there are certain long-term trends and periodic seasonal patterns. An example of the result of such a time series analysis is shown in Figure 2. Figure 2: An example for the resulting components of a time series analysis in R using the STL function (sum of all antibiotic substances, 2008 – 2010). ArcGIS (ESRI ArcGIS 10.2) with its geostatistical methods for pattern recognition has been used to analyse the spatial distribution of the antibiotics prescriptions within the Dresden urban districts. ArcGIS offers several functions for the analysis of local spatial patterns: Hot Spot Analysis (GetisOrd Gi*)6 and Cluster and Outlier Analysis (Anselin Local Morans I)7. Figure 3 and 4 show examples of the results of the respective cluster method. The Hot Spot Analysis results in statistically significant clusters of similarly high values (Figure 3 - red) or low values (Figure 3 - blue) for different confidence levels. In contrast, the result of the Cluster and Outlier Analysis shows not only statistically significant clusters of high values (Figure 4 - red) or low values 6. http://resources.arcgis.com/en/help/main/10.2/#/Hot _Spot_Analysis_Getis_Ord_Gi/005p00000010000000/. 7. http://resources.arcgis.com/en/help/main/10.2/#/Clu ster_and_Outlier_Analysis_Anselin_Local_Moran_s_I/ 005p0000000z000000/.
(4) AGILE 2014 – Castellón, June 3-6, 2014. (Figure 4 - blue) but also districts of high values surrounded by low values (Figure 4 - yellow) and vice versa (Figure 4 white). As the Cluster and Outlier Analysis seemed more meaningful and as it also provides hints to outlier districts, this method has been selected. In this way, the spatial and temporal prescribing patterns of antibiotics in Dresden and their changes over time have been determined. In a next step possible explanations for the occurrence of specific distribution patterns should be identified. Therefore the antibiotic prescription data are analysed to search for statistical correlations (next section) considering the above mentioned influencing factors. The correlation analyses are mostly performed via simple linear Pearson correlation (using SPSS Statistics 21). The input model still needs to be validated with actual measurements in the sewer system made within the project. However, a successful validation study strongly depends on the identification of appropriate measuring points that can be defined as being comparable with the prescription data at the urban district level. Figure 3: Hot Spot Analysis of azithromycin prescriptions in January 2009. 3. Results. 3.1. The individual antibiotic substances are prescribed differently throughout the year, depending on the application or bacteria causing certain infections. The selection of a suitable antibiotic is at the discretion of the attending physician. This is also reflected in the temporal analysis of the antibiotic prescriptions data for the years 2005 to 2011, which showed that the temporal prescription behaviour, especially the seasonal course, differs according to the individual antibiotic substances. While some substances show a more or less pronounced seasonal pattern (amoxicillin, azithromycin, clarithromycin, doxycycline, roxithromycin), others are prescribed relatively evenly over the year (ciprofloxacin, clindamycin) or have no specific pattern (cefuroxime, phenoxymethyl penicillin, levofloxacin-ofloxacin, sulfamethoxazole-trimethoprim). The clearest seasonal pattern is shown by the antibiotics of the macrolide group (azithromycin, clarithromycin, roxithromycin) with maximum prescriptions in the winter season and minimum values during the summer months. Regarding the trend component, most antibiotics indicate a decreasing trend. Only amoxicillin, cefuroxime and levofloxacin-ofloxacin reveal an increasing trend, while for azithromycin and clindamycin there is almost no trend apparent.. 3.2. Figure 4: Cluster and Outlier Analysis of azithromycin prescriptions in January 2009. Time series analysis. Cluster and Outlier analysis. The result of the Cluster and Outlier analysis in ArcGIS depends on the selected distance and spatial relationship of the neighbouring features by which the algorithm calculates the clusters. Therefore, the analysis was first carried out with different parameter settings to find the appropriate preferences. As conceptualization of spatial relationship ZONE_OF_INDIFFERENCE is chosen, where a threshold value specifies whether to include or exclude neighbours and where neighbours are weighted by the Inverse Distance Method after reaching this threshold value. This conceptualization of spatial relationship seemed most suitable for the analysis of the antibiotic prescriptions within the Dresden urban districts, as the polygons of the urban districts have different sizes and the (daily) mobility of citizens may lead to movements across several district boundaries. To cope with these cases it is recommended to use a distance-based conceptualization with a smooth transition as by ZONE_OF_ INDIFFERENCE. The ArcGIS tool Incremental Spatial Autocorrelation8 is used for choosing an appropriate threshold distance. The tool calculates the spatial autocorrelation for various distances, to determine the distance at which the spatial processes (the clustering) are most pronounced. This resulted in proper threshold distances of 2800 and 6400 meters for the data at hand, depending on the scale considered for the resulting clusters. 8. http://resources.arcgis.com/en/help/main/10.1/index .html#//005p0000004z000000.
(5) AGILE 2014 – Castellón, June 3-6, 2014. Figure 5: Weekly cases of respiratory infections and macrolide prescriptions 2009 – 2011. Source: respiratory infections data: Google Flu Trends (www.google.org/flutrends/); prescription data: AOK PLUS (AOK Sachsen und Thüringen) The outcome of these analyses provided resulting cluster maps, which are very different according to the considered antibiotic substance and the given point in time. There were hardly any general patterns for all data. Therefore, the individual cases have to be considered. Nonetheless, there are some urban districts, mostly in the central region of Dresden, that are more often part of a significant cluster than others (see also Figure 4). Thus, from a sewage treatment perspective, these cluster areas are the neighbourhoods that should be given priority and be investigated in more detail.. 3.3. Correlation analysis. As stated above data about respiratory infections are considered as a proxy for antibiotic prescriptions. A correlation analysis on the monthly Google Flu Trends data and the prescriptions for all individual antibiotic substances has been performed (Table 1). As result there are three substances presenting a significant strong correlation with the cases of respiratory infections: azithromycin (r = 0.94, p < 0.01), roxithromycin (r = 0.83, p < 0.01) and clarithromycin (r = 0.76, p < 0.01), all belonging to the macrolide group. These three antibiotics show a seasonal pattern similar to the annual wave of influenza. Consequently the correlation analysis for the three macrolide substances has been repeated with higher resoluted weekly data to include a wider sample and to create a basis for prospective weekly predictions (Figure 5). That way the correlation coefficient has been improved for roxithromycin (r = 0.88, p < 0.01) and clarithromycin (r = 0.90, p < 0.01), for azithromycin (r = 0.91, p < 0.01) it remains almost as high as with the monthly data.. Table 1: Pearson correlation coefficients (R) for monthly Google Flu Trends data and substance-specific antibiotic prescriptions from 2005 to 2011 (n = 84) Antibiotic active ingredient R groups Azithromycin Macrolide 0.94** Roxithromycin Macrolide 0.83** Clarithromycin Macrolide 0.76** Amoxicillin β-Lactam 0.61** Levofloxacin-ofloxacin Fluoroquinolone 0.53** Doxycycline Tetracycline 0.49** SulfamethoxazoleSulfonamide 0.49** trimethoprim Phenoxymethyl penicillin β-Lactam 0.44** Ciprofloxacin Fluoroquinolone 0.41** Cefuroxime β-Lactam 0.27* Clindamycin Lincosamide 0.03 * The correlation is significant at the 0.05 level. ** The correlation is significant at the 0.01 level.. 4. Conclusion and Outlook. The presented study succeeded in identifying spatial and temporal patterns of antibiotic descriptions, offering a promising path for future predictions of antibiotic releases in urban waste water. This work also demonstrated a statistical significant correlation between respiratory infections and prescriptions of antibiotic substances of the macrolide group. However, it should be noted that it is not known when exactly a respiratory infection occurs within a week, how long it lasts and when exactly any antibiotics are prescribed or a secondary infection occurs. Moreover, as a recent study pointed to some issues in the usage of Google Flu Trends [14], further.
(6) AGILE 2014 – Castellón, June 3-6, 2014. investigation are required to validate the first results, presented in this paper. Additional correlation analyses considering other influencing factors as meteorological and sociodemographic parameters are ongoing. Future work will focus (1) on the validation of the input model using the results of the ANTI-Resist measurement campaigns and (2) on the development of a prediction model to derive forecasts of the expected antibiotics input into the sewer system. Predictions will be deduced by the combination of the findings of the input model with up-to-date information using regression and interpolation functions. Based on the shown high correlation between respiratory infections and macrolide prescriptions, the weekly available Google Flu Trends data can be integrated into a simple linear regression model to derive prediction intervals of expected antibiotic inputs into the sewer system for the same week. Thus, the final results could be useful for the sewage treatment plant, which could initiate prompt provisions to increasing antibiotics input events, as well as for the public health sector, which could regulate the prescription behaviour of antibiotics in the appropriate way.. Acknowledgements The project is funded by the Federal Ministry for Education and Research (BMBF) and is part of the program "Research for Sustainable Development". The fruitful cooperation with our ANTI-Resist project partners is gratefully acknowledged. Special thanks go to Daniel Kadner for developing the ANTIResist Geoportal.. References [1] A. L. Batt, S. Kim and D. S. Aga. Comparison of the occurrence of antibiotics in four full-scale wastewater treatment plants with varying designs and operations. Chemosphere, 68(3): 428-435, 2007. [2] C. L. Cheng, Y. C. Chen, T. M. Liu and Y. H. K. Yang. Using spatial analysis to demonstrate the heterogeneity of the cardiovascular drug-prescribing pattern in Taiwan. BMC public health, 11(1): 380, 2011. [3] R. B. Cleveland, W. S. Cleveland, J. E. McRae and I. Terpenning. STL: A seasonal-trend decomposition procedure based on loess. Journal of Official Statistics, 6(1): 3-73, 1990. [4] P. Davey, C. Pagliari and A. Hayes. The patient's role in the spread and control of bacterial resistance to antibiotics. Clinical Microbiology and Infection, 8(s2), 43-68, 2002.. epidemics using search engine query data. Nature, 457(7232): 1012-1014, 2009. [7] Google, editor. Google Flu Trends. Frequently asked questions, 2011. Online available: http://www.google.org/flutrends/intl/ee_us/about/faq.htm l; last accessed 02/2014. [8] H. Goossens, M. Ferech, R. Vander Stichele and M. Elseviers. Outpatient antibiotic use in Europe and association with resistance: a cross-national database study. The Lancet, 365(9459): 579-587, 2005. [9] T. Heberer. Tracking persistent pharmaceutical residues from municipal sewage to drinking water. Journal of Hydrology, 266(3): 175-189, 2002. [10] S. Herold. Pathogenese, Klinik und Therapie der Virusgrippe. Vom harmlosen Infekt bis zur Intensivstation. Pharmazie in unserer Zeit, 40(2): 115119, 2011. (In english: Pathogenesis, clinic and therapy of influenza). [11] W.V. Kern, K. Nink, M. Steib-Bauert and H. Schröder. Regional variation in outpatient antibiotic prescribing in Germany. Infection, 34(5): 269-273, 2006. [12] K. Kümmerer. Antibiotics in the aquatic environment – a review – part I. Chemosphere, 75(4): 417-434, 2009. [13] K. Kümmerer. Antibiotics in the aquatic environment – a review – part II. Chemosphere, 75(4): 435-441, 2009. [14] D. Lazer, R. Kennedy, G. King and A. Vespignani. The Parable of Google Flu: Traps in Big Data Analysis. Science, 343 (6176): 1203-1205, 2014. [15] F. Modarai, K. Mack, P. Hicks, S. Benoit, S. Park, C. Jones, S. Proescholdbell, A. Ising and L. Paulozzi. Relationship of opioid prescription sales and overdoses, North Carolina. Drug and alcohol dependence, 132(1): 81-86, 2013. [16] B. Pauwels and W. Verstraete. The treatment of hospital wastewater: an appraisal. J Water Health, 4: 405-416, 2006. [17] G. Qiu, Y. Song, P. Zeng, L. Duan, and S. Xiao. Combination of upflow anaerobic sludge blanket (UASB) and membrane bioreactor (MBR) for berberine reduction from wastewater and the effects of berberine on bacterial community dynamics. Journal of hazardous materials, 246: 34-43, 2013.. [5] Forschungsverbund Public Health Sachsen und SachsenAnhalt. ANTI-Resist - Online available: http://antiresist.de/; last accessed 02/2014.. [18] T. Schaber. Diagnostik, Therapie und Prävention der Influenza (Virusgrippe). Pneumologie, 57(01): 27-33, 2003. (In english: Diagnosis, Therapy and Prevention of Influenza).. [6] J. Ginsberg, M. H. Mohebbi, R. S. Patel, L. Brammer, M.S. Smolinskiand L. Brilliant. Detecting influenza. [19] B. Spellberg, R. Guidos, D. Gilbert, J. Bradley, H. W. Boucher, W. M. Scheld, J. G. Barlett and J. Edwards..
(7) AGILE 2014 – Castellón, June 3-6, 2014. The epidemic of antibiotic-resistant infections: a call to action for the medical community from the Infectious Diseases Society of America. Clinical Infectious Diseases, 46(2): 155-164, 2008. [20] S. Stone, R. Gonzales, J. Maselli and S. R. Lowenstein. Antibiotic prescribing for patients with colds, upper respiratory tract infections, and bronchitis: a national study of hospital-based emergency departments. Annals of emergency medicine, 36(4): 320-327, 2000..
(8)
Figure


Documento similar
None of these variables showed consistent linear tendencies or trends in the mean values of this data set that can be straightforwardly
Further insight into the stripe phases can be gained by examining the intra- and interlayer pair correlation functions g ij (r) on the liquid (superfluid) side of the transition. 3),
The cluster thus generated based just on drug susceptibility data closely resembles the phylogenies of the lineages derived from genetic data and provides a novel approach to
On the other hand at Alalakh Level VII and at Mari, which are the sites in the Semitic world with the closest affinities to Minoan Crete, the language used was Old Babylonian,
To sum up, by means of a simple method, in a single step at room temperature based on the high insolubility in the reaction medium of the PCs 1 and 2, we can control the
Linked data, enterprise data, data models, big data streams, neural networks, data infrastructures, deep learning, data mining, web of data, signal processing, smart cities,
It could maybe seem somehow insubstantial to consider an actual increase in computing power produced merely by a change in representation, consid- ering that computable functions
Here we can verify what we believe constitutes a paradox: the necessity of con- siderations of an ethical kind is imposed, but from that tradition of Economic Theory whose
