Hybrid loss assessment curve for Colombia: A prospective and retrospective approach
13
0
0
Texto completo
(2) HYBRID LOSS ASSESSMENT CURVE FOR COLOMBIA: A PROSPECTIVE AND A RETROSPECTIVE APPROACH César A. VELÁSQUEZ1, Omar D. CARDONA2, Miguel G. MORA3, Luis E. YAMIN4, Liliana CARREÑO5 and Alex H. BARBAT6 ABSTRACT Countries prone to seismic hazard need to assess the expected risk as a permanent activity in their financial plan; otherwise, they will experience a lack in the information required for the application of disaster risk reduction policies. In this article, a risk assessment methodology is proposed that uses, on the one hand, empiric estimations of loss, based on information available in local disaster data bases, allowing to estimate losses due to small events; on the other hand, it uses probabilistic evaluations to estimate loss for greater or even catastrophic events for which information is not available due the lack of historical data. A “hybrid” loss exceedance curve, which represents the disaster risk in a proper and complete way, is thus determined. This curve merges two components: the corresponding to small and moderate losses, calculated by using an inductive and retrospective analysis, and the corresponding to extreme losses, calculated by using a deductive and prospective analysis.. INTRODUCTION The assessment of risk due to natural hazards is a task of special concern for the communities settled in hazard prone areas, for the local authorities responsible for the welfare of the population, for the academic community which wants to understand and predict the occurrence of those hazards and also for entities dedicated to improving the living conditions of the communities. The disasters caused by natural hazards undermine the capacities and resources of the affected communities (glazier’s fallacy). Furthermore, when those disasters impact recurrently the same settlements, the reconstruction and recovering processes can be interrupted and the consequences of the disasters get deeper. The destruction of assets and the restriction of the capital formation are some of those consequences that also increase the poverty of the members in the affected community and reduce their capacity for adapting and handling future events.. 1. PhD Student, Universitat Politècnica de Catalunya – Barcelona (Spain), [email protected] Professor. Universidad Nacional de Colombia – Manizales (Colombia), [email protected] 3 PhD Student, Universitat Politècnica de Catalunya – Barcelona (Spain), [email protected] 4 PhD Student, Universitat Politècnica de Catalunya – Barcelona (Spain), [email protected] 5 Researcher, Centre Internacional de Mètodes Numèrics en Enginyeria (CIMNE) – Barcelona (Spain), [email protected] 6 Professor, Universitat Politècnica de Catalunya – Barcelona (Spain), [email protected] 2. 1.
(3) Intensive risk refers to the possibility of occurring extreme, low frequency hazard events, usually geographically concentrated. It is associated to high intensity hazard events that are able to affect simultaneously an important number of exposed elements, overwhelming the response capacity of the local and even of the national emergency response agencies (Cardona et al. 2008b; Cardona et al. 2012). Extensive risk refers to high frequency events, usually affecting only a few communities each time; in this case, the local and national emergency response mechanisms could be effective when used. Modelling small disasters is a difficult task, especially at country level, due to the large amount of information required and the susceptibility of the results to the local data (like topography or soil mechanics), that is, the results have high variability over small changes of these input data. Even more, the exposure data will also require details only available for big cities but not at rural areas. Nevertheless, the accumulated losses due to extensive, recurrent risk could lead to the exhaustion of the available resources and, thus, to the lack of capacity to absorb future losses and to recover from future events (ERN-AL 2011; UNISDR 2009, 2011, 2013). The prospective assessment can represent the risk for the low frequency events which, due to their expected magnitude and intensity, can have catastrophic consequences (as they can impact simultaneously large areas and several urban centres). The prospective assessment can be made by methodologies like CAPRA (ERN-AL 2010), which accounts for the uncertainty in the event (location, magnitude and how it manifests itself), the uncertainty in the exposed assets (building response to the event) and the uncertainty in the used models. This assessment of intensive risk is required due to the lack of historical data regarding catastrophic events and the need to anticipate credible future economic losses which, in case of occurrence, could compromise the fiscal sustainability of the affected region or even the country. The retrospective risk assessment employs an approach similar to the insurance industry, in which data from previous years are statistically processed in order to obtaining a premium for a given sector (e.g. automotive, health, life, home). Finally, using these results, the retrospective loss exceedance curve can be obtained. This curve is of special importance, because it can relate, based on the observed data, economic losses with their expected occurrence frequency; it shows how often an economic loss has occurred or has been surpassed and, if the trends are kept, how often could it be expected or surpassed in the future. The objective of this article is to describe a new comprehensive methodology for risk assessment in which the accumulated effect of minor and frequent past events is combined with the potential effect of extreme events whose catastrophic impact can have consequences affecting the fiscal and sovereign sustainability of a country. Thus, the proposed approach considers both, the extensive risk which must be retained using reserve funds and reduced with effective vulnerability intervention strategies, as well as the intensive risk, that mainly must be the object of strategies for financial protection and risk transfer (Marulanda et al. 2010; Cardona et al. 2008a). The proposed simplified evaluation of the consequences of small scale disasters, rather than estimating the real or the total value of losses, provides estimates of the minimum cost or minimum impact on the society assets; this minimum cost is the amount which can be expected to be covered by the government due to its fiscal responsibility (if any) with the vulnerable sectors of society, and that has been ignored so far. The effect of insurance policies or risk transfer instruments has not been considered herein.. PROSPECTIVE ASSESSMENT OF RISK The prospective risk assessment is the evaluation of the consequences of future catastrophic events upon the existing set of exposed assets. These events are modelled based on current knowledge of the movement of the earth’s tectonic plates, a detailed definition of the different seismogenic sources (e.g. geometry, location, magnitude recurrence curve) and in some cases the properties of local soil for obtaining a local response (Egozcue et al. 1991). For a probabilistic risk assessment, the definition of the events must include, besides the epicentre and event magnitude, the expected occurrence 2.
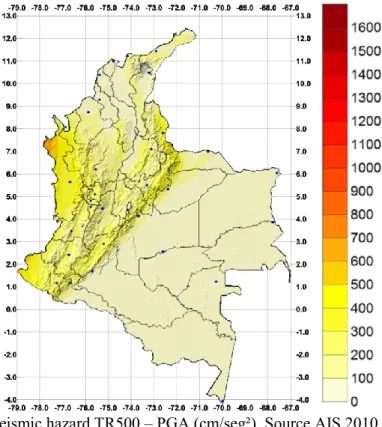
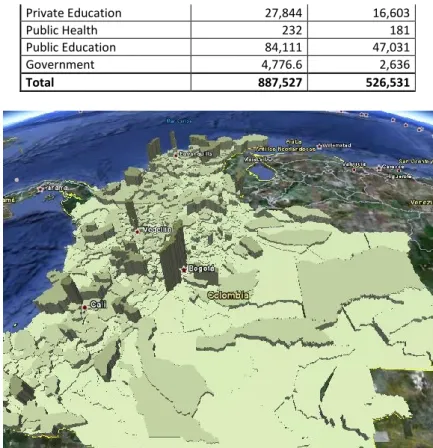
(4) C.A. Velásquez, O.D. Cardona, M.G. Mora, L.E. Yamin, M.L. Carreño and A.H. Barbat. 3. frequency. The software CRISIS2007 (Ordaz et al. 2007) was therefore selected for the hazard definition; this computer program is part of the CAPRA platform (ERN-AL 2010). The hazard is characterize by existing studies (AIS 2010, Salgado et al. 2010) and obtained as a catalogue of probable events, in which each event contains its epicentre, magnitude and frequency. The Figure 1 displays the peak ground acceleration (PGA) map for a uniform return period (TR) of 500 years.. Figure 1. Colombian seismic hazard TR500 – PGA (cm/seg²). Source AIS 2010 After the hazard is defined, the next step consists in defining the set of exposed assets and their expected response (vulnerability) to the selected hazard (Barbat et al. 1998; Barbat et al. 2010; Barbat et al. 2011). Considering the limitations on the existing data (i.e. there is not a building by building country database available that also includes constructive system, foundation, and location) an approximate model or proxy will be defined. The exposed assets proxy will use demographic, construction and macroeconomic indicators and statistics. The vulnerability will be defined using information available in the literature (e.g. HAZUS, Risk-UE, CAPRA) or by using computational models (Lagomarsino et al. 2006; Lantada et al. 2009a, 2009b; Vargas et al. 2013a, 2013b, 2013c). Table 1 displays the total economic valuation of buildings for different use groups (residential, commercial, industrial, and governmental). The residential use group has been separated in three different subgroups based on the average income in low (L), medium (M) and high (H). Figure 2 shows the exposed value of constructions per municipality. Table 1. Buildings area and economic valuation Use group Residential L Residential M Residential H Commercial Industry Private Health. Construction area 2 3 [m x10 ] 81,123 297,168 27,700 234,469 129,840 263. Economic value 6 [US$x10 ] 17,259 172,987 25,572 129,370 114,624 269.
(5) Private Education Public Health Public Education Government Total. 27,844 232 84,111 4,776.6 887,527. 16,603 181 47,031 2,636 526,531. Figure 2. Total exposed value per municipality.. 100. 0.01. 10. 0.1. 1. 1. 0.1. 10. 0.01. 100. 0.001. 1,000. 0.0001. 10,000. 0.00001 1.. 10. 100. 1,000. 10,000. Return Period [years]. Loss exceedence rate [#/year]. Using the CAPRA platform, it is possible to combine the hazard, the exposed assets database and its vulnerability, allowing the depiction of natural hazard risk by means of the Loss Exceedance Curve (LEC) and of the Average Annual Loss (AAL). The LEC relates a given economic loss (horizontal axis) with the annual frequency (left vertical axis) with which an event could generate a similar or greater loss, as shown on figure 3. The LEC is obtained using the equation. 100,000 100,000. Expected loss [Millions of Units]. Figure 3. Loss exceedance curve.. v( p ) . events. Pr(P p Event ) F i. i 1. 4. A. ( Eventi ). (1).
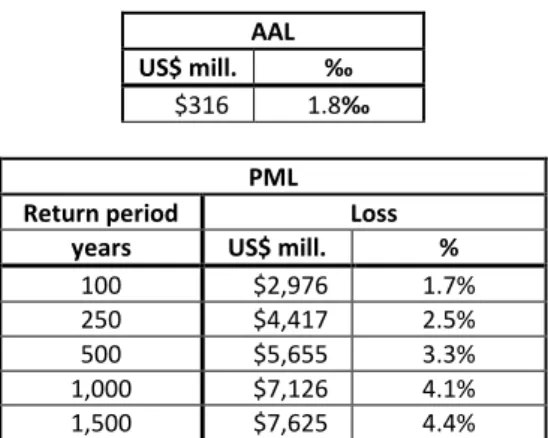
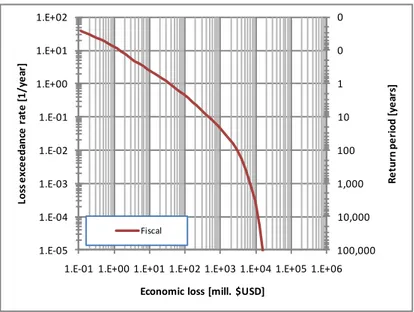
(6) C.A. Velásquez, O.D. Cardona, M.G. Mora, L.E. Yamin, M.L. Carreño and A.H. Barbat. 5. In this equation, v(p) is the exceedance rate of loss, p; FA (Eventi) is the annual frequency of occurrence of the Eventi; Pr(P > p| Eventi) is the probability of the loss to be greater than or equal to p, conditioned by the occurrence of the (Eventi). The integral over the equation 1 defines the AAL . AAL v( p)dp. (2). 0. The AAL, could be communicated as the amount of resources that the assessed party (in this case a country) require to save each year in order to recover the losses caused by all the disasters. Even if in some cases the accumulated fund is not enough for covering extreme disasters, this fund will recover over time during future and less catastrophic periods. As previously stated, the performed analysis accounts only for the country’s fiscal portfolio, which was considered to be composed by: low-income population inventory; public assets used for medical and healthcare services; public assets used for educational and cultural services; and public assets and buildings used for administrative services. Table 2 summarizes the probabilistic results obtained for Colombia employing the CAPRA platform; it expresses the results as the probable maximum loss (PML) that can be expected for the exposed portfolio of assets for a specified return period. The PML values depend on the degree of dispersion of the evaluated assets. It should be kept in mind that the values obtained for different return periods correspond to the PML of the entire area and that, when evaluated for a part of this area, they could significantly change because of the level of risk concentration. For fiscal responsibility, the AAL and the PML are obtained at country level. These risk metrics correspond to the losses that the country would have to face due to the potential damage in public and low income population assets which, under the assumptions of this paper, would have to be covered by the government in the case of a major disaster. Table 2. Probabilistic risk results for Colombia AAL US$ mill. $316. ‰ 1.8‰ PML. Return period years 100 250 500 1,000 1,500. Loss US$ mill. $2,976 $4,417 $5,655 $7,126 $7,625. % 1.7% 2.5% 3.3% 4.1% 4.4%. Figure 4 shows the loss exceedance curve obtained from the probabilistic assessment for Colombia. In. this curve, it is possible to see how often an economic loss is expected to be reached or surpassed. For example, it shows that each year an event with losses of at least one million US dollars is expected, and 100 USD millions are lose in average once every two and a half years..
(7) 0. 1.E+01. 0. 1.E+00. 1. 1.E-01. 10. 1.E-02. 100. 1.E-03. 1,000. Return period [years]. Loss exceedance rate [1/year]. 1.E+02. 10,000. 1.E-04 Fiscal. 1.E-05. 100,000. 1.E-01 1.E+00 1.E+01 1.E+02 1.E+03 1.E+04 1.E+05 1.E+06 Economic loss [mill. $USD]. Figure 4. Probabilistic LEC for Colombia – fiscal portfolio. RETROSPECTIVE ASSESSMENT OF RISK The retrospective assessment of risk corresponds, to the risk associated to small and disperse disasters, which in general relates to the impact caused over small settlements. This approach considers past damages as a predictor of future losses in a methodology similar to the insurance industry, in which data from previous years is used in order of establishing a premium in sectors on which the models are too complex or not reliable enough. In the case of natural hazards, modelling small disasters (in special when evaluating a whole country) is a difficult, if not, impossible task. This is due to several factors like the amount of information required (the whole country) and the susceptibility of the results to small variability on the data (for the hazard, exposure and vulnerability). For the seismic assessment of risk in small areas, the response of the soil is required as well as a more precise definition of the structures and their vulnerability, as it is no longer valid the law of large numbers. This assessment is performed by the means of a statistical analysis over a disaster database like EM-DAT (CRED) or DesInventar (OSSO). The disaster databases do not store the complete catalogue of historic disasters; instead, they are collecting the more complete set of events (including if possible previous but well documented events). This means that, in the best case, there will be available a sample of events large enough to be studied and from which recommendations could be obtained. Nevertheless, it is important remembering that the information and data stored can have errors and requires a permanent review. Table 3. Records available per disaster database - Colombia Database. Period. Records. DesInventar EM-DAT. 1914-2011 1906-2011. 30,761 228. Considering the number of available records (Table 3), the spatial resolution (country or municipality) and its public access, the DesInventar disaster database was selected to perform the retrospective assessment of risk. The records available in the database require a process of filtering, which removes records without consequences and records caused by anthropic activities; a process of classification and grouping on which consequences of one event, that are disperse over several records are merge; and finally a process of economic valuation, which allows the assess of economic losses based on the physical damage of the disaster. These processes are described in more detail in the GAR reports (UNISDR 2011 and 2013) and in the corresponding background papers (ERN-AL 2010, CIMNE et al. 2013). 6.
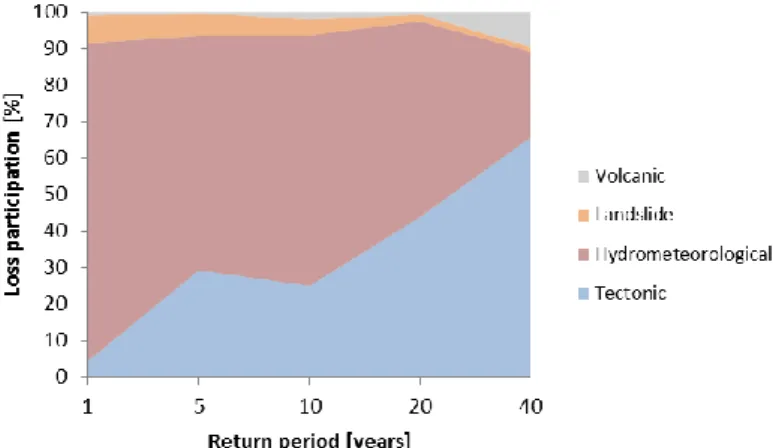
(8) C.A. Velásquez, O.D. Cardona, M.G. Mora, L.E. Yamin, M.L. Carreño and A.H. Barbat. 7. The largest number of records in the DesInventar database corresponds to the sectors of the most vulnerable population and the responsibility of the government upon those sectors, additionaly to their own public assets, will be denominated as fiscal responsibility. It is due to the lack of proper building codes, the lack of enforcement on housing solutions, the lack of land use policies, the lack of prevention works, or because it is required by laws. The damages over the private sector will not be considered as fiscal responsibility, due to the possibility of this sector to assess risk and buy insurance, to access to financial markets and to their own resources. Therefore, the proposed approach is oriented towards the public sector as a tool to generate concern regarding the losses to the public social infrastructure and to the low-income population sectors that it supports. Those losses, due to their small-scales and high occurrence rate, usually are not covered by the insurance market; therefore the corresponding authorities and the local government need to be aware of this liability. When we couple retrospective risk with the catastrophic one, we obtain a comprehensive view of natural disaster risk which allows its measurement. And, once risk is measured, it is possible to determinate the best policies for its reduction and management. As the disaster database contains events from other causes besides seismic, it is possible with little or no extra effort to characterize the landscape of small disasters. Figure 5 displays the relative impact that different hazard categories have had over the last 40 or more years and, if the trends are kept, their future impact.. Figure 5. Relative impact of losses per category – Colombia Finally, as the obtained results represent economic losses, a frequency analysis is possible for each of the categories of natural hazard and for all the categories. Thus, the retrospective or empiric loss exceedance curve is determined. This curve shows the historic frequency with which each loss is reached or exceeded. The loss exceedance curve, LEC, provides the most complete description of risk. It displays the relation between a given loss (usually economic) and the annual rate with which that specific loss will be reached or exceeded. Figure 6 shows a LEC which correlates an expected loss (horizontal axis) with its estimated frequency (left vertical axis). As the frequency is the inverse of the return period, the loss can also be represented as a function of the return period (the right vertical axis)..
(9) 0.001. 100. 0.01. 10. 0.1. Return period [years]. Loss exceedance rate [1/year]. 1,000. 1. 1. 10. 0.1. Landslide Tectonic All events. 0.01. Hydrometeorological Volcanic. 100. 0.001. 0.01. 0.1. 1. 10. 100. 1,000. 1,000 10,000. Economic loss [Million US$]. Figure 6. Loss exceedance curves by category for Colombia The reliability of the analysis is based on the information provided by the disaster databases employed. Thus, there is a permanent need for reviewing and auditing the different database records and their information sources. Other elements, like the chosen variables, the replacement items and their cost, could be improved in country specific assessments.. HYBRID LOSS EXCEEDANCE CURVE Once the results from the prospective (that accounts for future catastrophic events, which are yet to occur and for which no records exist) and the retrospective (that accounts for small disasters) assessments are obtained, that is, the corresponding loss exceedance curves, LEC, those curves can be coupled in a unique curve. These two segments define the hybrid loss exceedance curve or HLEC (Velasquez et al. 2011 and 2014, UNISDR 2011 and 2013). Figure 7 displays the retrospective and prospective curves obtained in the previous steps and, at the time, same the hybrid curve which is build, in part as the envelope of both curves and in part by joining them by making use of interpolation. 1,000. 0.001 Retrospective Curve Prospective Curve HLEC. 10. 0.01. 0.1. 1. 1. 0.1. 10. 0.01. 100. 0.001. 1,000. 0.0001. 10,000. 0.00001 0.01. 0.1. 1. 10. 100. 1,000. 10,000. Return period [years]. Loss exceedance rate [#events / year]. 100. 100,000 100,000. Expected loss [Millions of Units]. Figure 7. Hybrid loss exceedance curve for Colombia Other results of the methodology herein proposed, which not necessarily correspond to seismic hazard are displayed in figures 8 to 17. These results were included in the UNISDR Global Assessment Reports (UNISDR 2011, 2013).. 8.
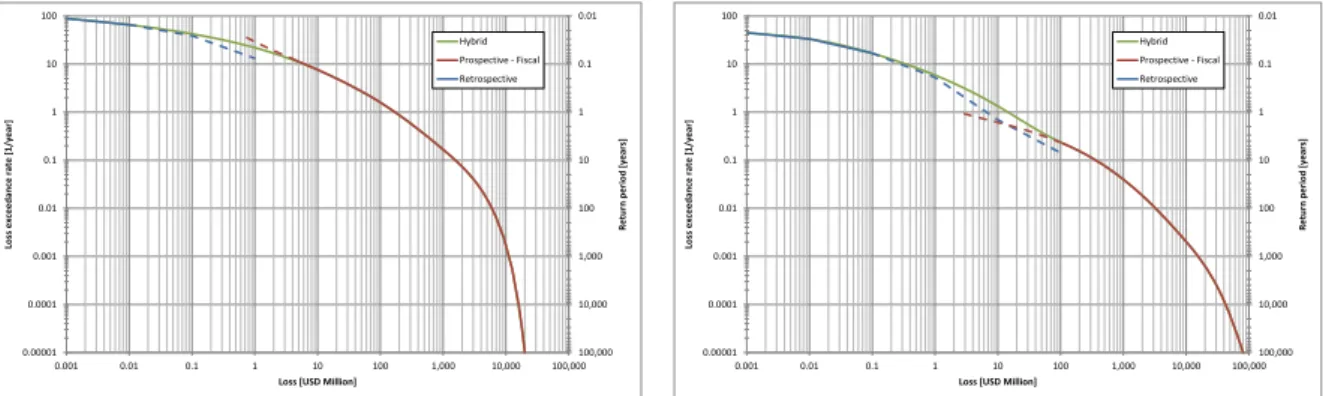
(10) C.A. Velásquez, O.D. Cardona, M.G. Mora, L.E. Yamin, M.L. Carreño and A.H. Barbat. 100. 0.01. 10. 0.01. Hybrid. Hybrid. Prospective - Fiscal. Prospective - Fiscal. 10. 0.1. 1. 0.1. 10. 0.01. 100. Loss exceedance rate [1/year]. 1. Return period [years]. 1. 0.1. 10. 0.01. 100. 0.001. 1,000. 0.001. 1,000. 0.0001. 10,000. 0.0001. 10,000. 0.1. 1. 10. 100. 1,000. 10,000. 0.00001 0.001. 100,000 100,000. 0.01. 0.1. 1. 10. 100. 1,000. 100. 0.01. 100. 0.01 Hybrid. Hybrid Prospective - Fiscal. 10. 0.1. Prospective - Fiscal. 10. 0.1. 10. 0.01. 100. 1 Loss exceedance rate [1/year]. 1 Return period [years]. Loss exceedance rate [1/year]. 1. 0.1. Retrospective. Retrospective. 1. 0.1. 10. 0.01. 100. 0.001. 1,000. 0.001. 1,000. 0.0001. 10,000. 0.0001. 10,000. 0.00001 0.001. 0.01. 0.1. 1. 10. 100. 1,000. 10,000. 100,000 100,000. 0.00001 0.001. 0.01. 0.1. 1. Loss [USD Million]. 10. 100. 1,000. 10,000. 100,000 100,000. Loss [USD Million]. Figure 10 Hybrid LEC for Ecuador. Figure 11 Hybrid LEC for El Salvador. 100. 0.01. 100. 0.01. Hybrid. Hybrid. Prospective - Fiscal. 10. 0.1. Prospective - Fiscal. 10. Retrospective. 0.1. Retrospective. 0.1. 10. 0.01. 100. 1 Loss exceedance rate [1/year]. 1 Return period [years]. 1 Loss exceedance rate [1/year]. 100,000 100,000. Figure 9 Hybrid LEC for Costa Rica. Figure 8 Hybrid LEC for Bolivia. 1. 0.1. 10. 0.01. 100. 0.001. 1,000. 0.001. 1,000. 0.0001. 10,000. 0.0001. 10,000. 0.00001 0.001. 0.01. 0.1. 1. 10. 100. 1,000. 10,000. 100,000 100,000. 0.00001 0.001. 0.01. 0.1. 1. Loss [USD Million]. 10. 100. 1,000. 10,000. 100,000 100,000. Loss [USD Million]. Figure 12 Hybrid LEC for Guatemala. Figure 13 Hybrid LEC for Honduras. 100. 0.01. 100. 0.01. Hybrid. Hybrid. Prospective - Fiscal. 10. 0.1. Prospective - Fiscal. 10. Retrospective. 0.1. Retrospective. 0.1. 10. 0.01. 100. 1. Loss exceedance rate [1/year]. 1. Return period [years]. 1. Loss exceedance rate [1/year]. 10,000. Loss [USD Million]. Loss [USD Million]. 1. 0.1. 10. 0.01. 100. 0.001. 1,000. 0.001. 1,000. 0.0001. 10,000. 0.0001. 10,000. 0.00001 0.001. 0.01. 0.1. 1. 10. Return period [years]. 0.01. Return period [years]. 0.00001 0.001. 100. 1,000. Loss [USD Million]. Figure 14 Hybrid LEC for Mexico. 10,000. 100,000 100,000. 0.00001 0.001. 0.01. 0.1. 1. 10. 100. Loss [USD Million]. Figure 15 Hybrid LEC for Nepal. 1,000. 10,000. 100,000 100,000. Return period [years]. Loss exceedance rate [1/year]. 1. 0.1. Retrospective. Retrospective. Return period [years]. 100. 9.
(11) 0.01. 10. 100. 0.01. Hybrid. Hybrid. Prospective - Fiscal. Prospective - Fiscal. 0.1. 10. Retrospective. 0.1. 10. 0.01. 100. 1 Loss exceedance rate [1/year]. 1 Return period [years]. Loss exceedance rate [1/year]. 1. 0.1. Retrospective 1. 0.1. 10. 0.01. 100. 0.001. 1,000. 0.001. 1,000. 0.0001. 10,000. 0.0001. 10,000. 0.00001 0.001. 0.01. 0.1. 1. 10. 100. 1,000. 10,000. 100,000 100,000. 0.00001 0.001. Loss [USD Million]. Figure 16 Hybrid LEC for Peru. 0.01. 0.1. 1. 10. 100. 1,000. 10,000. Return period [years]. 100. 100,000 100,000. Loss [USD Million]. Figure 17 Hybrid LEC for Venezuela. CONCLUSIONS Employing similitudes with the insurance industry, it is possible to correlate the previous damages and losses to the future risk caused by small disasters (at least at short term). This is particularly helpful when thinking in the complexity of modelling the effect of small disasters over large areas considering, among others, the amount of data, the spatial resolution and the susceptibility of the results. When the retrospective LEC is combined with the prospective LEC (obtained from a catastrophic risk assessment) it defines the hybrid LEC (Velasquez et al. 2014) providing a more robust and comprehensive profile which can describe, simultaneously, the country’s extensive and intensive risk. The study performed at country level shows that it is indispensable to measure risk retrospectively, with an empirical focus and, at the same time, prospectively, with a probabilistic focus. The lack of procedures to evaluate losses due minor and repetitive events has prevented until now that governments be aware of the enormous losses due to such events and that they retain. The proposed approach and the case studies performed in this article, permit not only to illustrate but also to promote the interest of decision makers towards an effective risk management, based on the complete and multi-hazard risk assessment facilitated by the hybrid loss exceedance curve. The proposed hybrid curve allows capturing aspects which the prospective LEC is not able to consider, avoiding the underestimation of the consequences of small-scale and recurrent events. And, obviously, it is important to have the possibility of estimating expected losses that a country may face perhaps every year and of planning the economical mechanism needed to recover more promptly.. ACKNOWLEDGEMENTS This work has been sponsored by UNISDR, and has been used as a background paper in the GAR report (UNISDR, 2011, 2013). We want to thank the following local institutions for their help and collaboration: Colombia (INGENIAR, ITEC) and Nepal (NSET). We also thank to the Florida International University for their support in the PhD studies of two of the authors. This work has been also partially sponsored by the European Commission (project DESURBS-FP7-2011-261652). The authors are also grateful for the support of the Ministry of Education and Science of Spain, project “Enfoque integral y probabilista para la evaluación del riesgo sísmico en España, CoPASRE” (CGL2011-29063).. REFERENCES Asociación Colombiana de Ingeniería Sísmica-AIS, (2010) Estudio General de Amenaza Sísmica de Colombia. Comité AIS-30 Barbat, A. H., Mena U. and Yépez, F. (1998). “Evaluación probabilista del riesgo sísmico en zonas urbanas”, Revista internacional de métodos numéricos para cálculo y diseño en ingeniería, 14(2), 247-268. 10.
(12) C.A. Velásquez, O.D. Cardona, M.G. Mora, L.E. Yamin, M.L. Carreño and A.H. Barbat. 11. Barbat, A. H., Carreño, M. L., Pujades, L. G., Lantada, N., Cardona O. D. and Marulanda, M. C. (2010). “Seismic vulnerability and risk evaluation methods for urban areas. A review with application to a pilot area”, Structure and Infrastructure Engineering, 6, 1–2, 17–38. Barbat, A. H., Carreño, M. L., Cardona O. D. y Marulanda, M. C. (2011). “Evaluación holística del riesgo sísmico en zonas urbanas”, Revista internacional de métodos numéricos para cálculo y diseño en ingeniería, 27(1), 3-27. Cardona, O. D., Ordaz, M. G., Yamin, L. E., Marulanda, M. C. & Barbat, A. H. (2008a). Earthquake Loss Assessment for Integrated Disaster Risk Management. Journal of Earthquake Engineering, 12, 48-59. Cardona, O. D., Ordaz, M. G., Marulanda, M. C. & Barbat, A. H. (2008b). Estimation of Probabilistic Seismic Losses and the Public Economic Resilience—An Approach for a Macroeconomic Impact Evaluation. Journal of Earthquake Engineering, 12, 60-70. Cardona O.D., Marulanda, M. C., Velásquez, C. A. & Barbat, A.H. (2012). Earthquake loss assessment for evaluation of the sovereign risk and financial sustainability of countries: Economic impacts, fiscal responsibilities and contingent liabilities. Presented at the 15th World conference on earthquake engineering. Lisbon, Portugal. CIMNE, EAI, INGENIAR & ITEC. (2013). Probabilistic Modelling of Natural Risks at the Global Level: The Hybrid Loss Exceedance Curve. Back-ground Paper prepared for the 2013 Global Assessment Report on Disaster Risk Reduction. CRED (n.d.). EM-DAT: The OFDA/CRED International Disaster Database – www.emdat.net. Brussels, Belgium: Université catholique de Louvain. Dirección web http://emdat.be/. Last visit the 2nd of February 2014. Egozcue, J. J., Barbat, A. H., Canas, J. A., Miquel J. and Banda, E. (1991). “A method to estimate occurrence probabilities in low seismic activity regions”, Earthquake Engineering and Structural Dynamics, 20(1), 43-60. ERN-AL (2010). CAPRA, Compressive approach for probabilistic risk assessment. World Bank, InterAmerican Development Bank. Retrieve from ecapra.org. ERN-AL (2011). Probabilistic Modeling of Disaster Risk at Global Level: Development of a methodology and implementation of case studies. Phase 1A: Colombia, México and Nepal. Background paper prepared for the 2011 Global Assessment Report on Disaster Risk Reduction. Geneva, Switzerland. UNISDR. Lagomarsino S. & Giovinazzi S. (2006) Macroseismic and mechanical models for the vulnerability and damage assessment of current buildings. Bulletin of Earthquake Engineering; 4(4): 415-443. Lantada N., Pujades L. G. & Barbat A. H. (2009a) Vulnerability index and capacity spectrum based methods for urban seismic risk evaluation. A comparison. Natural Hazards; 51(3): 501-524. Lantada, N., Irizarry, J., Barbat, A. H., Goula, X., Roca, A., Susagna, T. & Pujades, L. G. (2009b). Seismic hazard and risk scenarios for Barcelona, Spain, using the Risk-UE vulnerability index method. Bulletin of Earthquake Engineering, 8(2), 201-229. Marulanda, M. C., Cardona, O. D. & Barbat, A. H. (2010). Revealing the socioeconomic impact of small disasters in Colombia using the DesInventar database. Disasters, 34(2), 552-570. Ordaz M, Aguilar A, Arboleda J, (2007) CRISIS 2007 V7.6, Program for computing seismic hazard. Instituto de Ingeniería. Universidad Nacional Autónoma de México. OSSO (n.d.) Desinventar.org - DesInventar Project. Cali, Colombia: Corporación OSSO. Dirección web http://desinventar.org/en/. RISK-UE (2001–2004). An advanced approach to earthquake risk scenarios, with applications to different European cities. Website http://www.risk-ue.net Salgado M, Bernal G, Yamín L, Cardona O (2010) Evaluación de la amenaza sísmica de Colombia. Actualización y uso en las nuevas normas colombianas de diseño sismo resistente NSR-10. Revista de Ingeniería. 32: 28-37. Universidad de Los Andes, Bogotá, Colombia. UNISDR (2009). Global Assessment Report on Disaster Risk Reduction: Risk and poverty in a changing climate. Geneva, Switzerland: United Nations International Strategy for Disaster Reduction. UNISDR (2011). GAR2011: Global Assessment Report on Disaster Risk Reduction: Revealing risk, redefining development. Geneva, Switzerland: United Nations International Strategy for Disaster Reduction. UNISDR (2013) GAR2013: Global Assessment Report on Disaster Risk Reduction – From shared risk to shared value: The business case for disaster risk reduction. Geneva, Switzerland: United Nations International Strategy for Disaster Reduction. Vargas, Y. F., Pujades, L. G. & Barbat, A. H. (2013a). “Evaluación probabilista de la capacidad, fragilidad y daño sísmico en edificios de hormigón armado”, Revista internacional de métodos numéricos para cálculo y diseño en ingeniería, 29(2), 63-78. Vargas, Y. F., Pujades, L. G., Barbat, A. H. & Hurtado, J. E. (2013b). “Capacity, fragility and damage in reinforced concrete buildings: a probabilistic approach”, Bulletin of Earthquake Engineering, DOI 10.1007/s10518-013-9468-x..
(13) Vargas, Y. F., Barbat, A. H., Pujades, L. G. & Hurtado, J. E. (2013c). “Probabilistic seismic risk evaluation of reinforced concrete buildings”, Structures and Buildings (Proceedings of the Institution of Civil Engineering), 2013, http://dx.doi.org/10.1680/stbu.12.00031 Velásquez, C. A., Cardona, O. D., Yamin, L. E., Mora, M. G., & Barbat, A. H. (2011). Curva de excedencia de pérdidas híbrida para la representación del riesgo. Cuarto Congreso Nacional de Ingeniería Sísmica, Granada, España. Velásquez, C. A., Cardona, O. D., Mora, M. G., Yamin, L. E., Carreño, M. L., Barbat, A. H. (2014). Hybrid loss exceedance curve (HLEC) for disaster risk assessment. Natural Hazards Journal 72(2): 455–479. 12.
(14)
Figure
+4

Documento similar
Figure 4.16 shows the training and validation progression for a vanilla U-Net model and for two Attention Gated U-Net models, trained with Dice and Hybrid Loss functions and with
Laura Recalde, Continuous Petri Nets: Expressivity, Analysis and Control of a Class of Hybrid Systems (a satellite event of the 30 th International Conference on Applications
K) is the Banach space of continuous functions from Vq to K , equipped with the supremum norm.. be a finite or infinite sequence of elements
In this guide for teachers and education staff we unpack the concept of loneliness; what it is, the different types of loneliness, and explore some ways to support ourselves
No obstante, como esta enfermedad afecta a cada persona de manera diferente, no todas las opciones de cuidado y tratamiento pueden ser apropiadas para cada individuo.. La forma
The expansionary monetary policy measures have had a negative impact on net interest margins both via the reduction in interest rates and –less powerfully- the flattening of the
Jointly estimate this entry game with several outcome equations (fees/rates, credit limits) for bank accounts, credit cards and lines of credit. Use simulation methods to
In our sample, 2890 deals were issued by less reputable underwriters (i.e. a weighted syndication underwriting reputation share below the share of the 7 th largest underwriter
