Effect of high pressure carbon dioxide processing on pectin
1methylesterase activity and other orange juice properties
2H. Briongos, A.E. Illera, M. T. Sanz ∗, R. Melgosa, S. Beltrán, A.G. Solaesa 3
Department of Biotechnology and Food Science (Chemical Engineering Section), University of 4
Burgos, 09001 Burgos. Spain 5
Abstract:
6
Inactivation of pectinmethylesterase (PME) and quality parameters of orange juice have been 7
studied after high pressure carbon dioxide (HPCD) treatment. The HPCD treatment conditions 8
covered a wide range of temperature from 2 to 40 ºC, far below normal thermal treatment, while 9
operating pressure was varied from 10 to 30 MPa and exposure time from 3 to 60 min. A 10
decrease in PME activity was found, even at the lowest temperature studied in this work, 2 ºC. 11
Different inactivation kinetic models were used to correlate the PME residual activity: the two-12
fraction model, the fractional-conversion model and the Weibull model. The two-fraction model 13
presents the lowest mean relative deviation. Some quality parameters such as colour, pH, ºBrix, 14
turbidity, ascorbic acid, total acidity and particle size distribution (PSD) were also determined 15
right after HPCD treatment and along storage at 4ºC up to 12 days. PSD shows that HPCD 16
treatment results in a volume increase of small particles and a volume decrease of large particles 17
∗ Corresponding author. Tel.: +34 947 258810. Fax: ++34947258831. E-mail address
regarding the non-treated orange juice. Calcium content was also determined before and after 18
HPCD treatment to check for insoluble calcium carbonate formation but not significant changes 19
were observed in calcium content after HPCD treatment. 20
Keywords: Orange juice, HPCD, pectin methylesterase, cloud stability
21
1 Introduction
22
Fruit juice and nectars consumption amounted to 9.7 million litres in 2014 in the EU, of which 23
orange juice is one of the most consumed (European Fuit Juice Association, 2015). Cloud loss is 24
a quality defect in orange juice, since cloud particles are involved in the colour, flavour, texture 25
and aroma of orange juice (Klavons, Bennett, & Vannier, 1991). Additionally, consumers 26
associate the cloud loss with spoilage and quality loss. Citrus cloud is a complex mixture of 27
protein, pectin, lipid, hemicellulose, cellulose and other minor components. Cloud particles of 28
citrus juices range from 0.4 to 5 µm, being particles smaller than 2 µm the most stable clouds 29
(Ellerbee & Wicker, 2011). In the literature, one of the most accepted theories of cloud 30
destabilization is based on pectin demethylation by pectinmethylesterase (PME) (EC 3.1.1.11) in 31
a blockwise fashion. The negative charges generated by PME activity allow subsequent 32
formation of insoluble calcium pectate gels with calcium ions present in the juice. These gels can 33
precipitate pulling the cloud with them causing orange juice clarification due to the loss of 34
turbidity (Ellerbee & Wicker, 2011). Thermal treatment of orange juice at 90 ºC for 1 minute is 35
the method currently used to prevent microbial spoilage as well as the inactivation of the PME 36
(Oulé, Dickman, & Arul, 2013). However thermal treatment causes undesirable changes in 37
several quality parameters such as flavour, colour and texture and can also destroy heat-sensitive 38
technologies have gained interest and acceptance as food processing methods due to the 40
consumer increased demand for fresh-like products. Among them, high pressure carbon dioxide 41
(HPCD) has been proposed as an alternative non-thermal pasteurization technique for foods. 42
HPCD can also cause the inactivation of certain enzymes that affect the quality of some foods 43
such as PME in the orange juice under mild operation conditions (Damar & Balaban, 2006). In 44
HPCD treatments, operating temperatures can range between 5 – 60 ºC and pressures usually 45
below 50 MPa. Some other advantages of using HPCD as non-thermal treatment are that carbon 46
dioxide is nontoxic, nonflammable, inexpensive and readily available. It can also be easily 47
removed after treatment by depressurization. 48
Some previous studies dealing with the effect of HPCD treatment on orange juice quality can be 49
found in the literature. The first work was carried out by Balaban, Arreola, Marshall, Peplow, 50
Wei, and Cornell (1991), who found 100 % PME inactivation when using a commercial Milton 51
Roy Supercritical X-10 System while only 86 % PME inactivation was achieved when a custom-52
made supercritical system was used. These authors also found that, when using the custom-made 53
system, cloud significantly increased. Kincal, Hill, Balaban, Portier, Sims, Wei, and Marshall 54
(2006) also reported a high increase in the cloud values (between 446 – 846%) in orange juice, 55
when using a continuous system but a maximum PME inactivation degree of only 46.3%. 56
Recently, Zhou, Bi, Xu, Yang, and Liao (2015) reviewed the effects of HPCD processing on 57
flavour, texture and colour of foods including orange juice. Combined technologies of high 58
power ultrasound assisted SC-CO2 (HPU-SCCO2) have been also reported to inactivate PME of
59
orange juice (Ortuño, Balaban, & Benedito, 2014). These authors found a lowest residual activity 60
of 10.65 %. Therefore, different inactivation degrees have been reported in the literature when 61
an improvement of inactivation of different enzymes by increasing the CO2 concentration in the
63
enzyme solutions when CO2 was fed through a cylindrical filter nozzle (Ishikawa, Shimoda,
64
Kawano, & Osajime, 1995). Unfortunately, in most of the previous studies, no information about 65
the way CO2 is put in contact with the substrate can be found and comparison is difficult to
66
stablish. Additionally, differences in inactivation levels are related to cultivars, original pH of the 67
juice, isoenzyme forms, total solid content and other processing factors. 68
CO2 was used under supercritical conditions in previous reported HPCD treatments of orange
69
juice. The main objective of this work is to assess the effect of HPCD treatment under 70
supercritical and liquid conditions on PME activity. The effect of HPCD processing on other 71
physical and chemical parameters of orange juice will be also studied. 72
2 Materials and methods
73
2.1 HPCD equipment and processing
74
Valencia oranges were purchased from a local supplier. Oranges were squeezed in an orange 75
squeezer. The experimental apparatus used for the HPCD treatment has been designed in our 76
laboratory with a maximum operating pressure and temperature of 30 MPa and 80 ºC 77
respectively (Melgosa, Sanz, G. Solaesa, Bucio, & Beltrán, 2015). It consists of a CO2 reservoir,
78
a high pressure syringe pump with a pressure controller (ISCO 260 D) and 3 high pressure cells 79
immersed in a thermostatic water bath. In a typical HPCD experiment, orange juice was charged 80
into the high pressure cell, which was then placed in the thermostatic water bath at the preset 81
temperature. Afterwards, the system was pressurized and maintained at constant temperature and 82
pressure for a pre-established treatment time. CO2 was fed to the high pressure cell through a
83
CO2 dissolved in the sample. The duration of the pressurization and depressurization was less
85
than 2-3 min and it was not included in the treatment holding time. The high pressure cells were 86
magnetically stirred. Experiments were carried out in a temperature (T) range from 2 to 40 ºC, 87
pressure (p) from 10 to 30 MPa and exposure time (t) from 3 to 60 min. Different pressure cells 88
were arranged in series to carry out experiments at different operating times. After HPCD 89
treatment, the high pressure cells were depressurized and the treated orange juice was analysed 90
(see section 2.2). During depressurization, a temperature decrease of the orange juice was 91
observed due to Joule-Thomson cooling effect depending on applied pressures (Zhou, Zhang, 92
Leng, Liao, & Hu, 2010). 93
PME activity, pH and calcium content were determined before and after HPCD treatment at 94
different operating conditions. To evaluate the effect of HPCD treatment on the self-life of 95
orange juice, a sample of orange juice treated at 30 MPa and 40 ºC for 40 min was stored in the 96
refrigerator (4ºC). Aliquots were taken after 5 and 12 days of storage, and different quality 97
parameters of orange juice were determined and compared with original freshly squeezed orange 98
juice. 99
2.2 Physico-chemical analysis
100
2.2.1 Determination of pectin methylesterase activity. PME activity was determined by using 101
an automatic titrator system (Metrohm Titrando). A 1% of pectin solution (Alfa Aesar Pectin 102
Citrus) prepared in NaCl 0.3 M was used as substrate. 50 mL of pectin solution mixed with 5 mL 103
of orange juice were adjusted to pH 7.5 with NaOH 0.02 N. During hydrolysis at room 104
temperature, pH was maintained at 7.5 by adding NaOH 0.02 N. The amount of NaOH added for 105
carboxylic groups produced per minute and mL of juice at pH 7.5 and room temperature. PME 107
activity was calculated according to the following equation: 108
𝑈𝑈𝑈𝑈𝑈𝑈 𝑚𝑚𝑚𝑚⁄ = (𝑚𝑚𝑚𝑚𝑁𝑁𝑁𝑁𝑁𝑁𝑁𝑁) · (𝑁𝑁𝑁𝑁𝑟𝑟𝑚𝑚𝑁𝑁𝑚𝑚𝑚𝑚𝑚𝑚𝑚𝑚(𝑚𝑚𝑚𝑚𝑗𝑗𝑗𝑗𝑚𝑚𝑓𝑓𝑗𝑗𝑁𝑁𝑜𝑜𝑁𝑁𝑁𝑁𝑁𝑁𝑁𝑁) · (𝑚𝑚𝑚𝑚𝑚𝑚𝑗𝑗𝑚𝑚𝑗𝑗𝑚𝑚) · (𝑜𝑜𝑁𝑁𝑓𝑓𝑚𝑚𝑁𝑁𝑟𝑟) 𝑁𝑁𝑁𝑁𝑁𝑁𝑁𝑁) · (1000) [1]
Results are presented as residual PME activity, defined as the relationship between PME activity 109
after and before HPCD treatment: 110
𝑅𝑅𝑗𝑗𝑚𝑚𝑚𝑚𝑅𝑅𝑗𝑗𝑁𝑁𝑚𝑚𝑈𝑈𝑃𝑃𝑈𝑈𝑁𝑁𝑓𝑓𝑚𝑚𝑚𝑚𝑎𝑎𝑚𝑚𝑚𝑚𝑚𝑚 =𝑈𝑈𝑃𝑃𝑈𝑈𝑈𝑈𝑃𝑃𝑈𝑈𝑁𝑁𝑓𝑓𝑚𝑚𝑚𝑚𝑎𝑎𝑚𝑚𝑚𝑚𝑚𝑚𝑁𝑁𝑓𝑓𝑚𝑚𝑚𝑚𝑎𝑎𝑚𝑚𝑚𝑚𝑚𝑚𝑏𝑏𝑗𝑗𝑜𝑜𝑁𝑁𝑟𝑟𝑗𝑗𝑁𝑁𝑜𝑜𝑚𝑚𝑗𝑗𝑟𝑟𝑁𝑁𝑈𝑈𝐻𝐻𝐻𝐻𝑁𝑁𝑈𝑈𝐻𝐻𝐻𝐻= 𝐴𝐴𝐴𝐴
𝑜𝑜 [2]
2.2.2 Determination of pH, ºBrix, total acidity, Vitamin C and colour. pH of orange juice 111
was determined with a pH-meter (Crison pH & Ion-Meter GLP 22). ºBrix were measured with 112
a Milton Roy refractometer (Model 334610) at 25ºC. Temperature and acidity corrections were 113
made (Kimball, 1999). 114
Total acidity was determined by using an automatic titrator (Metrohm Titrando). A sample of 115
2 mL of orange juice was mixed with 50 mL of distilled water. The mixture was titrated with 116
0.02 N NaOH. Titrable acidity was expressed as citric acid percentage (g citric acid/100g). 117
Vitamin C was determined with 2,6-dichloroindophenol titrimetric method (Kimball, 1999). 118
Colour was evaluated by a Konica Minolta CM-2600d colorimeter. The L*, a* and b* values 119
were obtained representing lightness, red to green colour and yellow to blue colour, respectively. 120
Other conditions are illuminant D65 (daylight source) and a 10º standard observer (perception of 121
∆𝑈𝑈= ��𝑚𝑚∗𝑏𝑏𝑏𝑏𝑏𝑏𝑜𝑜𝑏𝑏𝑏𝑏− 𝑚𝑚 𝑎𝑎𝑏𝑏𝑎𝑎𝑏𝑏𝑏𝑏
∗ �2+�𝑁𝑁
𝑏𝑏𝑏𝑏𝑏𝑏𝑜𝑜𝑏𝑏𝑏𝑏∗ − 𝑁𝑁𝑎𝑎𝑏𝑏𝑎𝑎𝑏𝑏𝑏𝑏∗ �2+�𝑏𝑏𝑏𝑏𝑏𝑏𝑏𝑏𝑜𝑜𝑏𝑏𝑏𝑏∗ − 𝑏𝑏𝑎𝑎𝑏𝑏𝑎𝑎𝑏𝑏𝑏𝑏∗ �2 [3]
Differences in perceivable colour can be classified analytically as not noticeable (0-0.5) slightly 123
noticeable (0.5-1.5), noticeable (1.5-3) well visible (3.0-6.0) and great (6.0-12.0) (Yuk, 124
Sampedro, Fan, & Geveke, 2014). 125
Another parameter that can be used to evaluate alterations in colour of a beverage is the chroma, 126
C, which measures colour intensity: 127
𝐻𝐻= �(𝑁𝑁∗)2+ (𝑏𝑏∗)2 [4]
2.2.3 Determination of turbidity and particle size distribution. Cloud quality was determined 128
by using a spectrophotometric method. The orange juice sample was centrifuged at 9000 r.p.m. 129
for 30 min. The supernatant was poured into a quartz cuvette and absorbance at 660 nm was 130
measured in a Hitachi® spectrophotomter (Model U-2000). Distillated water was used as a blank. 131
Percent cloud change was calculated as: 132
𝑈𝑈𝑗𝑗𝑟𝑟𝑓𝑓𝑗𝑗𝑚𝑚𝑚𝑚𝑓𝑓𝑚𝑚𝑁𝑁𝑗𝑗𝑅𝑅𝑓𝑓ℎ𝑁𝑁𝑚𝑚𝑎𝑎𝑗𝑗 = (𝐹𝐹𝑚𝑚𝑚𝑚𝑁𝑁𝑚𝑚𝑓𝑓𝑚𝑚𝑁𝑁𝑗𝑗𝑅𝑅𝑎𝑎𝑁𝑁𝑚𝑚𝑗𝑗𝑗𝑗 − 𝐼𝐼𝑚𝑚𝑚𝑚𝑚𝑚𝑚𝑚𝑁𝑁𝑚𝑚𝑓𝑓𝑚𝑚𝑁𝑁𝑗𝑗𝑅𝑅𝑎𝑎𝑁𝑁𝑚𝑚𝑗𝑗𝑗𝑗)
𝐼𝐼𝑚𝑚𝑚𝑚𝑚𝑚𝑚𝑚𝑁𝑁𝑚𝑚𝑓𝑓𝑚𝑚𝑁𝑁𝑗𝑗𝑅𝑅𝑎𝑎𝑁𝑁𝑚𝑚𝑗𝑗𝑗𝑗 · 100 [5]
Particle size distribution (PSD) was determined by laser diffraction with a Mastersizer 2000 133
(Malvern® Inst., MA). The system uses a laser light at 750 nm wavelength to size particles from 134
0.4 to 2000 µm by light diffraction. Particle size distribution was calculated by the Fraunhofer 135
model. Size distributions (volume fractions against particle size) and the weight average size 136
expressed as the equivalent surface area mean diameter, D(3,2) and the equivalent volume mean 137
2.2.4 Determination of Calcium content. Calcium in orange juice before and after HPCD 139
treatment was determined by atomic absorption spectrometry (Perkin Elmer 3300). The orange 140
juice was centrifuged (Eppendorf Centrifugue 5804) at 9000 rpm for 30 minutes (Zhou et al., 141
2010). The precipitate was discharged and the calcium content of the supernatant was 142
determined. La2O3 (Merck) was added to samples to a final concentration of 0.5% of lanthanum
143
in the medium. The addition of lanthanum avoids the interference of phosphates in the calcium 144
determination. HCl was also added (5% in the sample) to promote dissolution of both calcium 145
and lanthanum in the medium. Calcium content was obtained by calibration with different 146
standard solutions of calcium (Merck Certipur®, 1 g/L) by following the same method as with 147
the original freshly squeeze orange juice. 148
Some experiments were also performed with a McIlvaine buffer solution containing 0.05 M 149
citric acid and 0.1 M disodium hydrogen phosphate, at pH close to the orange juice (pH ≈ 4), to 150
which calcium was added to achieve a content similar to that in orange juice (around 100 ppm -151
2.5·10-3 MCa2+) using two types of calcium salts (chloride, citrate). A McIlvaine buffer solution
152
was chosen since this solution had a buffer capacity similar to that of orange juice (Yoshimura, 153
Furutera, Shimoda, Ishikawa, Miyake, Matsumoto, Osajima, & Hayakawa, 2002). 154
2.3 Kinetic data analysis
155
Different kinetic models were tested to correlate the inactivation kinetics of PME (Hu et al., 156
2013) . 157
Two-fraction kinetic model. This model takes into account the existence of several isoenzymes 158
were considered to be inactivated according to first-order kinetics, but independently of each 160
other: 161
𝐴𝐴= 𝐴𝐴𝐿𝐿𝑗𝑗𝑒𝑒𝑒𝑒(−𝑘𝑘𝐿𝐿𝑚𝑚) +𝐴𝐴𝑆𝑆𝑗𝑗𝑒𝑒𝑒𝑒(−𝑘𝑘𝑆𝑆𝑚𝑚) [6]
where AL and AS (AS = 1 - AL) are the activity of the labile and stable fractions respectively and
162
kL and kS (min-1) the inactivation rate constants of both the labile and stable fractions
163
respectively. 164
Fractional-conversion model. A fraction-conversion model is a special case of a first order 165
kinetic model that takes into account the non-zero residual activity after prolonged heating 166
and/or pressure (A∞) treatment: 167
𝑚𝑚𝑚𝑚(1− 𝑜𝑜) =𝑚𝑚𝑚𝑚 �(𝐴𝐴(𝐴𝐴−𝐴𝐴∞)
𝑜𝑜− 𝐴𝐴∞)�=−𝑘𝑘𝑚𝑚 [7]
𝐴𝐴= 𝐴𝐴∞+ (𝐴𝐴𝑜𝑜− 𝐴𝐴∞)𝑗𝑗𝑒𝑒𝑒𝑒(−𝑘𝑘𝑚𝑚) [8]
Weibull model. This model can be written in the power-law form as (Ortuño et al., 2014): 168
𝑚𝑚𝑁𝑁𝑎𝑎10�𝐴𝐴𝐴𝐴
𝑜𝑜�= −𝑏𝑏𝑚𝑚
𝑛𝑛 [9]
where b is a non-linear rate parameter and n is the shape factor. 169
2.4 Statistical analysis
170
All analyses were conducted using software Statgraphics X64. The results are presented as a 171
determined based on an analysis of the variance with the Tukey’s honestly significant difference 173
(HSD) method at p-value ≤ 0.05. 174
To estimate the kinetic parameters for the different models tested in this work, non-linear 175
regression was performed by using the Marquardt algorithm (Statgraphics X64). The mean 176
relative deviation (MRD) between experimental and calculated residual activities was also 177
evaluated: 178
𝑃𝑃𝑅𝑅𝐻𝐻 =1𝑚𝑚 � � �𝑅𝑅𝐴𝐴𝑐𝑐𝑎𝑎𝑐𝑐𝑐𝑐𝑅𝑅𝐴𝐴− 𝑅𝑅𝐴𝐴𝑏𝑏𝑒𝑒𝑒𝑒
𝑏𝑏𝑒𝑒𝑒𝑒 � 𝑎𝑎𝑐𝑐𝑐𝑐𝑠𝑠𝑎𝑎𝑠𝑠𝑒𝑒𝑐𝑐𝑏𝑏𝑠𝑠
�· 100 [10]
3 Results and discussion
179
3.1 Effect of HPCD treatment on PME activity
180
PME activity was determined before and after HPCD treatment at different operating conditions: 181
10 to 30 MPa, 2 to 40 ºC and for 3 to 60 min. To consider HPCD as an effective non-thermal 182
treatment, temperatures assayed in this work were lower than 40ºC in all the experiments 183
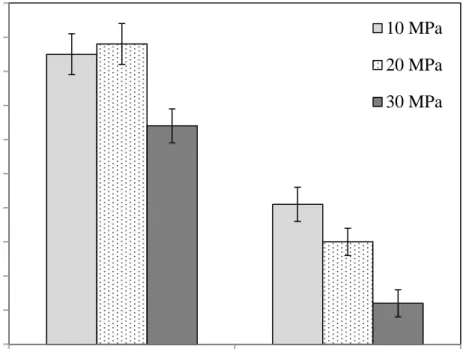
Figure 1 shows the residual activity of the PME as a function of operating pressure after 20 min 184
of HPCD treatment at two different operating temperatures (2 and 21ºC). At each temperature, 185
PME activity decreases with increasing CO2 pressure. Even at the lowest temperature essayed in
186
this work, 2 ºC, some PME inactivation degree was reached, especially at the highest operating 187
pressure. From Figure 1, it can be also observed that at a fix operating pressure, the higher the 188
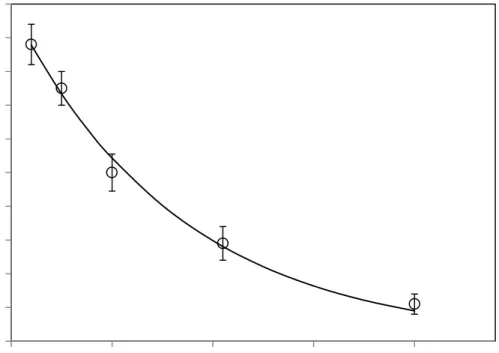
temperature, the higher the inactivation degree. This fact can be also observed in Figure 2 where 189
a simple exponential function of residual activity with temperature has been found: 190
A/Ao = (0.99±0.03)·exp((-0.060±0.004)·T) R2 = 0.993 [11]
where T is the temperature in Celsius degrees. In addition to the intrinsic effect of temperature 192
on enzyme inactivation, high temperatures can stimulate the diffusivity of CO2 and also
193
accelerate the molecular collisions between CO2 and the enzyme (Hu et al., 2013).
194
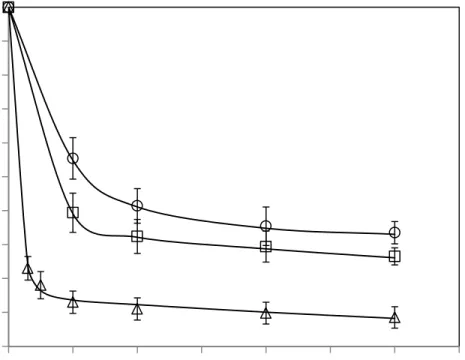
Figure 3 shows the effect of operating time at different operating conditions. In all cases, a sharp 195
decrease of PME activity is observed at the beginning of the process, while longer operation 196
times do not involve further substantial enzyme inactivation. This behaviour may indicate that 197
HPCD-labile and HPCD-stable PME fractions coexist in the Valence orange juice. Multiple 198
isoenzymes have been also observed for PME extracts from other sources such as carrot, peach 199
and apple (Zhi, Zhang, Hu, Wu, & Iao, 2008) (Zhou, Zhang, Hu, Liao, & He, 2009b) after 200
HPCD treatment. 201
Table 1 presents previous results found in the literature on the inactivation of PME in orange 202
juice after HPCD treatment. Balaban et al. (1991) reached a 100% of inactivation in a Milton 203
Roy System after 4 h of treatment at 29 MPa and 50 ºC. The inactivation percentage decreased 204
down to 82 % when using a static custom made supercritical system. In this work, similar 205
inactivation degrees were reached when working at similar operating pressure (30 MPa) but 206
lower operating temperatures (40 ºC), and shorter treatment times (less than 60 min). The faster 207
inactivation reached in our work could be due to the way CO2 was fed into the sample through
208
CO2-microbubbles, which helps to maximizes the interface area for the orange juice and the
209
CO2. Inactivation percentages slightly higher than 50 % were reached when using a continuous
210
HPCD system (Kincal et al., 2006). Table 1 also presents the inactivation degree of PME in 211
orange juice when using a combined technology of high power ultrasound-assisted supercritical 212
carbon dioxide (HPU-SCCO2). The lowest residual activity reported by HPU-SCO2 is similar to
213
cases, an increase in the solubilisation rate of pressurized CO2 in the orange juice could
215
accelerate the inactivation rate. Table 1 also presents the degree of inactivation of PME in orange 216
juice after heat pasteurization at 90ºC for 10 s and 20 s as recently reported by Agcam, Akyıldız, 217
and Evrendilek (2014). 218
Different factors have been reported to affect the inactivation of PME by thermal and non-219
thermal treatments. Bull, Zerdin, Howe, Goicoechea, Paramanandhan, Stockman, Sellahewa, 220
Szabo, Johson, and Steward (2004) studied the influence of natural variations of pH in orange 221
juice due to the harvesting season on PME inactivation by High Pressure Processing, HPP, (pH 222
range: 3.6-4.3). These authors found that low values of pH (pH=3.6) help to the inactivation of 223
PME by HPP. However, based on the results presented in Table 1, no correlation can be 224
established between pH of orange juice and the inactivation degree reached by HPCD. For 225
instance, the value of pH of Valence orange juice reported by Balaban et al. (1991) was 3.8 226
while in this work, pH was found to be around 4.1 but similar degree of PME inactivation was 227
reached in both cases. In this regard, in the literature, there are some studies about pH lowering 228
induced by contact to pressurized CO2. Meysammi, Balaban, and Teixeira (1992) reported that
229
the pH of orange juice remained essentially constant when adding CO2 in the pressure range
0.1-230
5.5 MPa. However, Balaban et al. (1991) measured the pH of orange juice in contact to 231
pressurized CO2 at higher operating pressures, 31 MPa and 27 MPa, observing that pH was
232
lowered by about 0.7 pH units (from 3.6 to 2.9 and from 3.8 to 3.1). In any case, these authors 233
explained that, for substantial PME inactivation, pH must be lowered to 2.4. Therefore, different 234
factors seem to determine PME inactivation. 235
Some studies on fluorescence intensity of PME treated with HPCD showed modifications in the 236
suggested enzyme inactivation mechanisms in food processing by HPCD, such as formation of 238
different complex with CO2 molecules or decomposition of the enzyme by CO2 have been also
239
recently reviewed by Hu et al. (2013). 240
3.1.1 Kinetic analysis
241
In this work, as expected from the shape of PME residual activity (see Fig. 3), inactivation 242
curves were not well fitted to the first order kinetic model (r2 ≤ 0.71), although Balaban et al. 243
(1991) found good correlation of the inactivation kinetics with a first order model at 31 MPa and 244
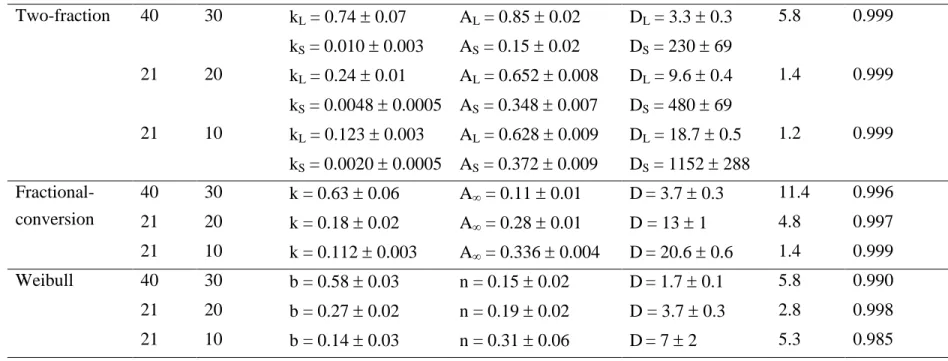
55ºC (D = 20.9 min). The kinetic parameters of the different models tested in this work are listed 245
in Table 2. This Table also includes the decimal reduction time (D value), defined as the 246
treatment time needed for a 10-fold reduction of the initial enzyme activity at a given condition, 247
the statistical parameters for the fit of the kinetic models, r2 and the mean relative deviation 248
(MRD) between experimental and calculated residual activities (Eq. 10). For the two-fraction 249
model, AL was higher than AS and kL was 50-70 times higher than kS indicating that there is a
250
fast inactivation period followed by a decelerated decay. Therefore, the corresponding DL and DS
251
followed the opposite trend. kL and AL from the two-fraction model increased with increasing
252
pressure. The same tendency was found for k and b for the fractional-conversion and the Weibull 253
models, respectively; while the residual activity A∞ and the exponent, n, decreased with 254
increasing pressure. The lowest MRD was obtained for the two-fraction model. 255
3.2 Effect of HPCD treatment on quality parameters and storage study
256
The highest PME inactivation degree was obtained at 30 MPa and 40ºC (see Figure 3). 257
Therefore, to carry out the storage study, samples were treated by HPCD at 30 MPa and 40ºC for 258
evaluated along 12 days of storage at 4 ºC. PME activity and other quality parameters in orange 260
juice, such as PSD, turbidity, colour, ºBrix, total acidity and ascorbic acid, were recorded as a 261
function of storage time. 262
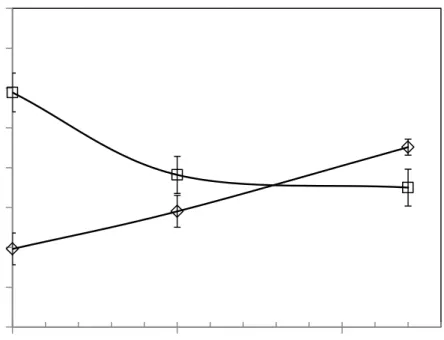
3.2.1 PME activity. Figure 4 shows that PME recovered some activity during storage at 4 ºC. 263
This result suggests that PME inactivation by HPCD could be somehow reversible. Similar 264
results were obtained by Arreola et al. (1991) and Niu et al. (2010) after HPCD treatment of 265
orange juice. The increased PME activity along storage has been attributed to isoenzymes arising 266
during the storage of orange juice (Agcam et al., 2014). On the contrary, when using a 267
commercial PME lyophilized power produced from the peel of Valencia oranges no recovery in 268
PME activity was observed during 7 day-storage at 4ºC after HPCD treatment (8-30 MPa, 55ºC 269
for 10 min), (Zhou, Wu, Hu, Zhi, & Liao, 2009). In any case, an extracted enzyme suspended in 270
a buffer solution can give different inactivation results from those obtained in an original juice. 271
Different results have been found in the literature on the activity of other enzymes after HPCD 272
treatment during storage. Horseradish peroxidase treated at 55ºC and 8 – 22 MPa recovered 273
activity after storage for 7 and 21 days at 4ºC; however this was not obvious when treated at 30 274
MPa (Gui, Chen, Wu, Wang, Liao, & Hu, 2006). PPO from potato recovered 28% of its original 275
activity during the first two weeks of frozen storage, and then its activity slightly decreased with 276
storage time; however no restoration activity was found for PPOs from lobster and brown (Chen, 277
Balaban, Wei, Marshall, & Hsu, 1992). Therefore, different behaviour has been observed 278
regarding the enzyme and the source of the enzyme. 279
3.2.2 Cloud. Changes in cloud values (Eq. 5) after HPCD treatment and the corresponding 280
values along storage are presented in Figure 4. After HPCD treatment cloud was improved, 281
value decreased, but even after 12 days cloud enhancement remained 18% higher than the 283
original orange juice. Kincal et al. (2006) reported a cloud increase higher than 600%, with little 284
influence of operating pressure when orange juice was treated in continuous HPCD equipment. 285
Arreola et al. (1991) found that cloud increased from 27% to 400% regardless temperature or 286
treatment time. Niu et al. (2010) also found an increase of cloud values around 100%, with little 287
effect of operating time. In this work, values of cloud enhancement were close to the lowest 288
value reported by Arreola et al. (1991). These authors also found that cloud enhancement was 289
less in orange juice drained after depressurization of the system compared to orange juice 290
samples withdrawn while the system was under pressure. This could explain the values of cloud 291
enhancement obtained in this work, especially when comparing to a continuous HPCD system. 292
Taking into account these results, cloud seems to be stabilized after HPCD in a non-enzymatic 293
way, since some PME is still active. Kincal et al. (2006) suggested that HPCD treatment could 294
lead to precipitation of calcium ions present in the orange juice due to the formation of insoluble 295
calcium carbonate. It has been described that dissolved CO2 could form carbonic acid that
296
dissociates into bicarbonate that could be converted to carbonate when the pressure is released 297
(Kincal et al., 2006) (Yuk et al., 2014). To study the role of formation of insoluble calcium 298
carbonate in cloud stabilization, calcium content was determined before and after HPCD. 299
Effect of HPCD treatment on Calcium content. 300
Table 3 presents the residual calcium content, defined as the percentage relationship between the 301
calcium content after and before HPCD treatment, for calcium solutions in a McIlvaine buffer at 302
pH close to the orange juice. It can be observed that calcium content did not change significantly 303
after HPCD treatment. Table 3 also shows the residual calcium content after HPCD treatment at 304
slightly lower values after HPCD treatment than in buffer solutions, no significant differences 306
have been determined among sample means of buffer and orange juices when applying the 307
Tukey’s HSD method. 308
In this regard, the effect of different experimental variables on CaCO3 solubility has been
309
recently reported in the literature (Coto, Martos, Peña, Rodríguez, & Pastor, 2012). CaCO3
310
solubility increased with operating pressure (pressurized CO2) and decreased with temperature
311
and pH of the medium. For instance, at 40ºC CaCO3 solubility in water at 1 bar and 40 bar is
312
about 4.2·10-4 MCa2+ and 2.3·10-2 MCa2+, respectively. Although CaCO3 solubility at atmospheric
313
pressure is very small, depends strongly on pH increasing as pH decreases (for instance, at 25 ºC, 314
at pH = 7 MCa2+=2·10-3 and at pH = 6 MCa2+=9·10-3). Therefore, taking into account that at the
315
low pH of orange juice, only a small amount of dissolved CO2 is converted into bicarbonate
316
dissociating into free hydrogen ions (Zhou et al., 2015) and that calcium carbonate solubility 317
increases by decreasing pH, calcium content in orange juice was in fact not expected to change 318
much after HPCD processing. To our knowledge, the only measurement of calcium content 319
before and after HPCD treatment, was reported by Zhou et al. (2010), who found no significant 320
effects on the calcium content of peach juice, which is also an acidic juice (pH ~ 3.8), after 321
HPCD treatment. 322
To explain the cloud enhancement after HPCD treatment, the possible effect of homogenization 323
induced by gas expansion during the depressurization step has been studied by determining the 324
particle size distribution, PSD. 325
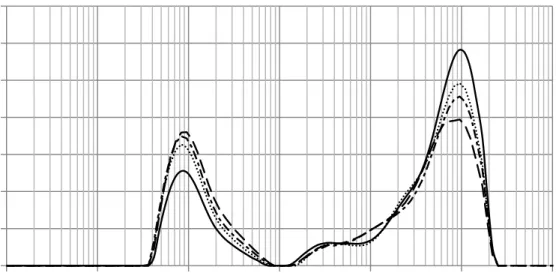
3.2.3 Particle size distribution. PSD of orange juice before and after HPCD treatment has been 326
represented in Figure 5. Two maximums around 0.8 µm and 850 µm can be observed. The size 327
cloud having particle sizes of 2 μm and smaller (Ellerbee & Wicker, 2011). The larger particle 329
size in Figure 5 is due to the presence of some settling pulp. In this regard, it must be emphasized 330
that laser diffraction methods generates a volume distribution. The total volume of all particles 331
with diameters less than 5 µm represents 24.5 % of the total volume of particles but represents 332
100 % in number distribution. That is, although the number of bigger particles is very small 333
represents a high volume distribution when compared to cloud particles. Clarification of juice 334
takes place when stable cloud showed aggregation by shifting the PSD distribution to larger 335
diameters (Corredig, Kerr, & Wicker, 2001). However, HPCD treatment results in an increase of 336
the volume peak of the smaller particles and a decrease of large particles (Figure 5). This 337
behaviour of orange juice PDS helps to understand the cloud enhancement after HPCD 338
treatment. This fact has been explained in terms of the effect of the homogenization caused by 339
HPCD treatment due to several reasons, such as high internal stress surpassing the tensile 340
strength of the particles when CO2 is removed from the vessel (Niu et al., 2010). Figure 5 also
341
presents PSD of treated orange juice after 5 and 12 days storage. It can be observed that the 342
volume peak of the small particles increased during the storage, while the volume peak of the 343
large particles decreased. This behaviour could be attributed to the remained active PME that 344
could decompose the high molecular weight compound and then reduce the size of particles. 345
Values of D[3,2] and D[4,3] of freshly squeezed juice, after treatment and after 5 and 12 days 346
storage are presented in Table 4. According to Figure 5, the values after HPCD treatment were 347
lower than those of freshly squeezed orange juice and a continuous decrease was observed with 348
increasing storage time, but this decrease was not significant different along storage (Table 4). In 349
observed in the values of d(0.1), d(0.5) and d(0.9) which correspond to the size of particle below 351
which 10%, 50% and 90% of the sample lies, respectively. 352
3.2.4 pH, total acidity, ºBrix, ascorbic acid and colour. 353
pH, ºBrix and total acidity did not change significantly in orange juice after HPCD treatment and 354
remained essentially constant during storage (Table 5). The low pH of the original orange juice 355
made difficult the dissociation of the carbonic acid, formed by dissolved CO2 in the juice, into
356
H+ ions. However, in some studies, a decrease in the pH of orange juice has been reported during 357
HPCD treatment (Oulé et al., 2013; Balaban et al., 1991). The pH decrease has been thus 358
associated with the state and density of CO2 in the juice during the treatment (Oulé et al., 2013).
359
Further investigations should be performed to analyse the pH of the sample during treatment, due 360
to different results found in the literature (see section 3.1). 361
The content of ascorbic acid decreased after HPCD treatment (around 14%) and continued 362
decreasing during storage. However the decrease of the ascorbic content after HPCD treatment is 363
lower than after pasteurization treatments. Oule et al. (2013) reported a decrease of the vitamin C 364
content of 13% after HPCD treatment (25 MPa, 40ºC) while after pasteurization vitamin C 365
decreased 43% (90ºC and 60 s). This difference is attributed not only to the lower temperatures 366
employed in HPCD treatments but also to the O2-free environment and the low solubility of
367
vitamin C in SC-CO2. In this work, higher loss of vitamin C has been observed during storage
368
(10% and 24% after 5 and 12 days respectively) than other values found in the literature during 369
storage. For instance, Oulé et al. (2013) found around 5% vitamin C loss after 56 days storage at 370
4 ºC. This high percentage loss could be due to the presence of O2 during storage, but also to the
371
pH of the orange juice used in this work (4.11-4.12), since it is known that more acidic 372
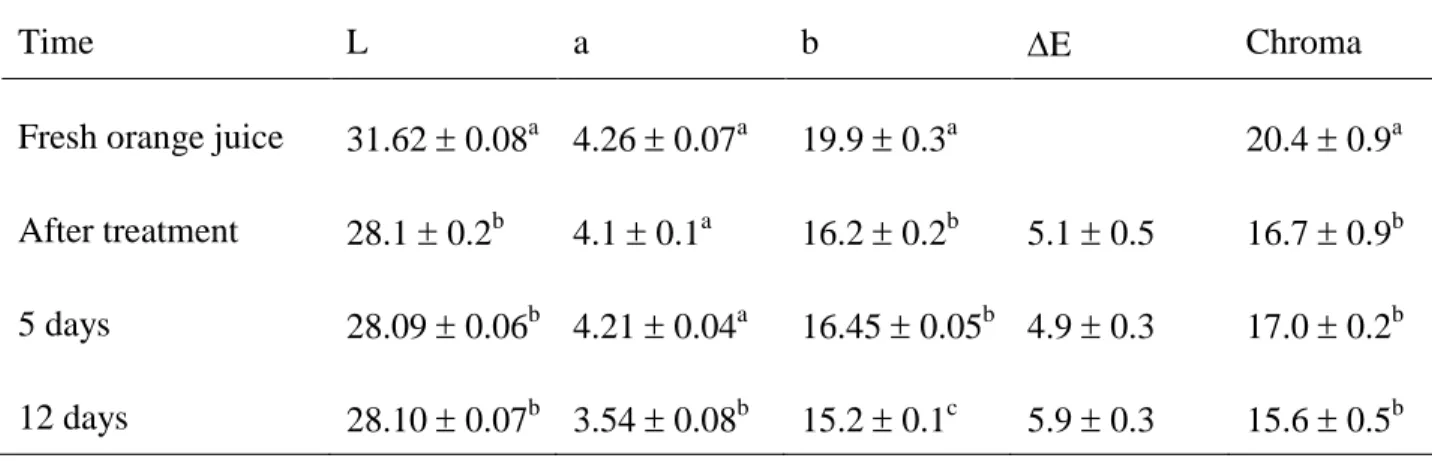
Table 6 lists the L*, a*, b* parameters of freshly squeezed orange juice, after HPCD treatment 374
and during storage. Lightness (L*) and yellowness (b*) significantly decreased indicating the 375
darkening of the orange juice and less yellow and more blue colour after HPCD processing. On 376
the contrary, redness (a*) was not significant different in the untreated and HPCD processed 377
orange juice. In the literature, differences have been reported for the lightness, redness and 378
yellowness in HPCD-treated orange juice (Zhou et al., 2015). During storage, lightness (L*), 379
redness (a*) and yellow (b*) did not change significantly after 5 days storage; however redness 380
and yellowness decreased significantly after 12 days storage. According to Zhou et al. (2015) the 381
colour of foods can be influenced by biochemical or chemical reaction as well as physical effects 382
induced by HPCD. Among other mechanisms, oxidation of ascorbic acid could also lead to the 383
colour change (Zhou et al., 2015). This would agree with the results reported in Table 5 of 384
ascorbic acid content. The change in colour, ∆E (Eq 3) is also presented in Table 6 and visible 385
differences in colour after HPCD treatment have been determined (∆E ≈ 5). Kincal et al. (2006) 386
also reported ∆E values as high as 13.83, at 72 MPa and a ratio of 0.64 CO2/juice (w/w). Chroma
387
values listed in Table 6 show that HPCD treatment results in a significant lower colour intensity 388
juice after processing but no significance differences have been observed along storage. 389
4. Conclusions
390
Freshly squeezed orange juice has been treated by HPCD under different operating conditions. 391
PME in orange juice was effectively inactivated by HPCD showing a fast initial decrease that 392
remained nearly constant after prolonged HPCD treatment. The inactivation degree increased 393
with pressure and temperature. Different inactivation kinetic models were used to correlate the 394
residual PME activity, being the two-fraction model the best with the lowest mean relative 395
since its activity is slightly recovered along storage at 4 ºC. PSD shows an increase of the 397
volume peak of the smaller particles (0.3-5 μm) and a decrease of large particles after HPCD 398
treatment, supporting the cloud enhancement observed. Calcium content does not change 399
significantly after HPCD treatment, proving that insoluble calcium content was not formed. 400
Further investigation should be done to analyse the effect of cloud enhancement after HPCD 401
treatment. 402
ACKNOWLEDGMENTS
403
To Hyperbaric. To the Spanish Government through MINECO (CTQ2015-64396-R). R.
404
Melgosa acknowledges MINECO for a grant (BES-2013-063937). A. G. Solaesa acknowledges
405
the Burgos University for a pre-doctoral fellowship.
406
References:
Agcam, E., Akyıldız, A., & Evrendilek, G. A. (2014). Effects of PEF and heat pasteurization on PME activity in orange juice with regard to a new inactivation kinetic model. FOOD
CHEMISTRY, 165, 70–76. http://doi.org/10.1016/j.foodchem.2014.05.097
Arreola, A. G., BalaBan, M. O., Marshall, M. R., Peplow, A. J., Wei, C., & Cornell, J. A. (1991). Supercritical Carbon Dioxide Effects on Some Quality Attributes of Single Strength Orange Juice. Journal of Food Science, 56(4), 1030–1033.
Balaban, M. O., Arreola, A. G., Marshall, M., Peplow, A., Wei, C. I., & J., C. (1991). Inactivation of Pectinesterase in Orange Juice by Supercritical Carbon Dioxide. Journal of
Food Science, 56(3), 743–750.
Bull, M. K., Zerdin, K., Howe, E., Goicoechea, D., Paramanandhan, P., Stockman, R., … Stewart, C. M. (2004). The effect of high pressure processing on the microbial , physical and chemical properties of Valencia and Navel orange juice. Innovative Food Science and
Emerging Technologies, 5, 135–149. http://doi.org/10.1016/j.ifset.2003.11.005
Chen, J. S., Balaban, M. O., Wei, C. I., Marshall, M. R., & Hsu, W. Y. (1992). Inactivation of polyphenol oxidase by high-pressure carbon dioxide. Journal of Agricultural and Food
Chemistry, 40, 2345–2349. http://doi.org/10.1021/jf00024a005
Corredig, M., Kerr, W., & Wicker, L. (2001). Particle size distribution of orange juice cloud after addition of sensitized pectin. Journal of Agricultural and Food Chemistry, 49(5), 2523–2526. http://doi.org/10.1021/jf001087a
Coto, B., MArtos, C., Peña, J. L., Rodríguez, R., & Pastor, G. (2012). Fluid Phase Equilibria Effects in the solubility of CaCO 3 : Experimental study and model description. Fluid Phase
Equilibria, 324, 1–7. http://doi.org/10.1016/j.fluid.2012.03.020
Damar, S., & Balaban, M. O. (2006). Review of Dense Phase CO 2 Technology : Microbial and Enzyme Inactivation , and Effects of Food Quality. Journal of Food Science, 71(1), 1–11. Ellerbee, L., & Wicker, L. (2011). Calcium and pH influence on orange juice cloud stability.
Journal of the Science of Food and Agriculture, 91(May 2010), 171–177.
http://doi.org/10.1002/jsfa.4169
European Fruit Association, (2015). Liquid Fruit. Market report. Retrieved from http://www.aijn.org/files/default/aijn2015-report.pdf
Gui, F., Chen, F., Wu, J., Wang, Z., Liao, X., & Hu, X. (2006). Inactivation and structural change of horseradish peroxidase treated with supercritical carbon dioxide. Food
Chemistry, 97, 480–489. http://doi.org/10.1016/j.foodchem.2005.05.028
Hu, W., Zhou, L., Xu, Z., Zhang, Y., & Liao, X. (2013). Enzyme Inactivation in Food Processing using High Pressure Carbon Dioxide Technology. Critical Reviews in Food Science and
Nutrition, 53(2), 145–161. http://doi.org/10.1080/10408398.2010.526258
Ishikawa, H., Shimoda, M., Kawano, T., & Osajime, Y. (1995). Inactivation of Enzymes in an Aqueous Solution by Micro-bubbles of Supercritical Carbon Dioxide. Bioscience,
Biotechnology, and Biochemistry, 59(4), 628–632.
Academic/Plenum Publishers. http://doi.org/10.1017/CBO9781107415324.004
Kincal, D., Hill, W. S., Balaban, M., Portier, K. M., Sims, C. A., Wei, C. I., & Marshall, M. R. (2006). A continuous high-pressure carbon dioxide system for cloud and quality retention in orange juice. Journal of Food Science, 71(6), 338–344. http://doi.org/10.1111/j.1750-3841.2006.00087.x
Klavons, J. A., Bennett, R. D., & Vannier, S. H. (1991). Nature of the Protein Constituent of Commercial Orange Juice Cloud. J. Agric. Food Chemistry, 39(9), 1545–1548.
Melgosa, R., Sanz, M. T., G. Solaesa, Á., Bucio, S. L., & Beltrán, S. (2015). Enzymatic activity and conformational and morphological studies of four commercial lipases treated with supercritical carbon dioxide. The Journal of Supercritical Fluids, 97, 51–62. http://doi.org/10.1016/j.supflu.2014.11.003
Meyssami, B., Balaban, M. O., & Teixeira, A. A. (1992). Prediction of pH in Model Systems Pressurized with Carbon Dioxide7. Biotechnology Progress, 8, 149–154.
Niu, L., Hu, X., Wu, J., Liao, X., Chen, F., Zhao, G., & Wang, Z. (2010). Effect of Dense Phase Carbon Dioxide Process on Physicochemical Properties and Flavor Compounds of Orange Juice. Journal of Food Processing and Preservation, 34(2010), 530–548. http://doi.org/10.1111/j.1745-4549.2009.00369.x
Ortuño, C., Balaban, M., & Benedito, J. (2014). Modelling of the inactivation kinetics of Escherichia coli , Saccharomyces cerevisiae and pectin methylesterase in orange juice treated with ultrasonic-assisted supercritical carbon dioxide. The Journal of Supercritical
Fluids, 90, 18–26. http://doi.org/10.1016/j.supflu.2014.03.004
Oulé, K. M., Dickman, M., & Arul, J. (2013). Properties of Orange Juice with Supercritical Carbon Dioxide Treatment. International Journal of Food Properties, 16(February 2014), 1693–1710. http://doi.org/10.1080/10942912.2011.604893
Yoshimura, T., Furutera, M., Shimoda, M., Ishikawa, H., Miyake, M., Matsumoto, K., … Hayakawa, I. (2002). Inactivation Efficiency of Enzymes in Buffered System by Continuous Method with Microbubbles of Supercritical Carbon Dioxide. Journal of Food
Science, 67(9), 3227–3231.
Yuk, H. G., Sampedro, F., Fan, X., & Geveke, D. J. (2014). Nonthermal Processing of Orange Juice Using a Pilot-Plant Scale Supercritical Carbon Dioxide System with a Gas-Liquid Metal Contactor. Journal of Food Processing and Preservation, 38, 630–638. http://doi.org/10.1111/jfpp.12013
Zhi, X., Zhang, Y., Hu, X., Wu, J., & Iao, X. (2008). Inactivation of Apple Pectin Methylesterase Induced by Dense Phase Carbon Dioxide. Journal of Agricultural and Food Chemistry, 56, 5394–5400.
Zhou, L., Bi, X., Xu, Z., Yang, Y., & Liao, X. (2015). Effects of high-pressure CO2 processing on flavor, texture, and color of foods. Critical Reviews in Food Science and Nutrition,
55(6), 750–68. http://doi.org/10.1080/10408398.2012.677871
Zhou, L., Wu, J., Hu, X., Zhi, X., & LIao, X. (2009). Alterations in the Activity and Structure of Pectin Methylesterase Treated by High Pressure Carbon Dioxide. Journal of Agricultural
and Food Chemistry, 57, 1890–1895.
of pectin methylesterases from carrot and peach by high-pressure carbon dioxide. Food
Chemistry, 115, 449–455. http://doi.org/10.1016/j.foodchem.2008.12.028
Zhou, L., Zhang, Y., Leng, X., Liao, X., & Hu, X. (2010). Acceleration of precipitation formation in peach juice induced by high-pressure carbon dioxide. Journal of Agricultural
Table 1. PME inactivation values in orange juice after HPCD and other non-thermal treatments
System pH p, MPa T, ºC t, min Inactivation Reference
Milton Roy System 3.8 29 50 240 100% (Balaban et al., 1991)
Custom made system 3.8 29 45 120 84% (Balaban et al., 1991)
Static 3.9 40 55 10 36% (Niu et al., 2010)
Static 3.9 40 55 60 95% (Niu et al., 2010)
Continuous 3.7 72 24 10* 56% (Kincal et al., 2006)
Static 4.12 30 40 20-60 90-92 % This work
HPU-SCCO2 3.8 23 41 10 89 % (Ortuño et al., 2014)
Pasteurization 3.5 0.1 90 10 - 20 s 93 – 96 % (Agcam et al., 2014)
Table 2. Estimated kinetic parameters of orange juice PME inactivation at different operating conditions, for different kinetic models Kinetic model T, ºC p, MPa Model parameters D value, min MRD r2 (p<0.05) Two-fraction 40 30 kL = 0.74 ± 0.07 AL = 0.85 ± 0.02 DL = 3.3 ± 0.3 5.8 0.999
kS = 0.010 ± 0.003 AS = 0.15 ± 0.02 DS = 230 ± 69
21 20 kL = 0.24 ± 0.01 AL = 0.652 ± 0.008 DL = 9.6 ± 0.4 1.4 0.999
kS = 0.0048 ± 0.0005 AS = 0.348 ± 0.007 DS = 480 ± 69
21 10 kL = 0.123 ± 0.003 AL = 0.628 ± 0.009 DL = 18.7 ± 0.5 1.2 0.999
kS = 0.0020 ± 0.0005 AS = 0.372 ± 0.009 DS = 1152 ± 288
Fractional-conversion
40 30 k = 0.63 ± 0.06 A∞ = 0.11 ± 0.01 D= 3.7 ± 0.3 11.4 0.996 21 20 k = 0.18 ± 0.02 A∞ = 0.28 ± 0.01 D = 13 ± 1 4.8 0.997
21 10 k = 0.112 ± 0.003 A∞ = 0.336 ± 0.004 D= 20.6 ± 0.6 1.4 0.999 Weibull 40 30 b = 0.58 ± 0.03 n = 0.15 ± 0.02 D= 1.7 ± 0.1 5.8 0.990 21 20 b = 0.27 ± 0.02 n = 0.19 ± 0.02 D = 3.7 ± 0.3 2.8 0.998
21 10 b = 0.14 ± 0.03 n = 0.31 ± 0.06 D= 7 ± 2 5.3 0.985
Table 3. pH and Calcium content of different McIlvaine buffer solutions and orange juice after HPCD treatment.
System pH before
HPCD
pH after HPCD
HPCD treatment Residual Ca2+, % p, MPa T, ºC t, min
McIlvaine buffer 101 ppm Ca (Ca3Cit2)
3.92 3.86 20 21 20 95 ± 2a
McIlvaine buffer……… 100 ppm Ca (CaCl2)
3.97 3.97 20 21 20 96 ± 5a
Orange juice 4.18 4.18 10 21 20 91 ± 2a
Orange juice 4.16 4.12 10 40 20 96 ± 5a
Orange juice 4.17 4.13 30 21 20 91 ± 2a
Orange juice 4.16 4.15 30 40 20 93 ± 4a
Orange juice 4.17 4.14 10 40 40 90 ± 5a
Table 4. Effect of HPCD treatment on the particle size distribution of orange juice after HPCD treatment and during storage.
Time D[3,2] D[4,3] d(0.1) d(0.5) d(0.9)
Table 5. Changes in orange juice pH, ºBrix, total acidity and ascorbic acid.
Time pH ºBrix(1) Total acidity,
g citric acid/100mL1
Ascorbic acid mg/100 mL Fresh orange juice 4.11 ± 0.05a 11.50 ± 0.08a 0.52 ± 0.05a 50 ± 1a After treatment 4.09 ± 0.05a 11.35 ± 0.05a 0.53 ± 0.04a 43 ± 1b 5 days 4.11 ± 0.05a 11.45 ± 0.06a 0.50 ± 0.03a 39 ± 2c 12 days 4.12 ± 0.05a 11.45 ± 0.06a 0.49 ± 0.04a 33 ± 1d
Data: mean ± SD (n=3). Different letters in a column indicate significant differences by the Tukey’s honestly significant difference (HSD) method at p-value ≤ 0.05.
(1)
Table 6. Changes in orange juice colour.
Time L a b ∆E Chroma
Figure 1. Effect of pressure on orange juice PME inactivation (T = 2 and 21ºC, t = 20 min). Data: mean ± SD (n=3).
0 0.1 0.2 0.3 0.4 0.5 0.6 0.7 0.8 0.9 1
2 ºC
21 ºC
R
es
id
u
al
ac
tiv
ity
, A
/A
o
Figure 2. Effect of temperature on orange juice PME inactivation (p = 20 MPa, t = 40 min). Continuous line is an exponential function of residual activity as a function of temperature (Equation 11). Data: mean ± SD (n=3).
0.0 0.1 0.2 0.3 0.4 0.5 0.6 0.7 0.8 0.9 1.0
0 10 20 30 40
R
es
id
u
al A
ctiv
ity
, A
/A
o
Figure 3. Effect of operating time on PME inactivation at different operating conditions (△ 40ºC
and 30 MPa, 21ºC, 20 MPa; ○, 21ºC, 10 MPa). Data: mean ± SD (n=3). Continuous lines correspond to the two-fraction model.
0
0.1
0.2
0.3
0.4
0.5
0.6
0.7
0.8
0.9
1
0
10
20
30
40
50
60
70
R
es
id
u
al
ac
tiv
ity
, A
/A
o
Figure 4. Evolution of PME residual activity and cloud percentage (Eq. 5) in HPDC treated (30 MPa, 40 ºC and 40 min) orange juice during storage at 4ºC. (◇ PME residual activity, cloud percentage). Data: mean ± SD (n=3).
0
5
10
15
20
25
30
35
40
0
5
10
R
es
idua
l a
ct
ivi
ty
, %
; C
loud
cha
nge
%
Figure 5. Particle Size Distribution (PSD) of orange juice freshly squeezed ( ─ ), immediately after treatment by HPCD at 30 MPa, 40ºC for 40 min (····); after 5 days storage at 4ºC (-·-·) ; after 12 days storage at 4ºC (− − −).
0 1 2 3 4 5 6 7
0.01 0.1 1 10 100 1000 10000