Two
‐
stage gas
‐
phase bioreactor for the combined removal of hydrogen
sulphide, methanol and
α
‐
pinene
Eldon R. Rene, Yaomin Jin, María C. Veiga & Christian Kennes
Environmental Technology, Volume 30, Issue 12, 2009, pages 1261-1272 DOI:10.1080/09593330903196868
Abstract:
Biological treatment systems have emerged as cost‐effective and eco‐friendly techniques for treating waste gases from process industries at moderately high gas flow rates and low pollutant concentrations. In this study, we have assessed the performance of a two‐stage bioreactor, namely a biotrickling filter packed with pall rings (BTF, 1st stage) and a perlite + pall ring mixed biofilter (BF, 2nd stage) operated in series, for handling a complex mixture of hydrogen sulphide (H2S), methanol (CH3OH)
and α‐pinene (C10H16). It has been reported that the presence of H2S can reduce the
biofiltration efficiency of volatile organic compounds (VOCs) when both are present in the gas mixture. Hydrogen sulphide and methanol were removed in the first stage BTF, previously inoculated with H2S‐adapted populations and a culture containing Candida boidinii, an acid‐tolerant yeast, whereas, in the second stage, α‐pinene was removed predominantly by the fungus Ophiostoma stenoceras. Experiments were conducted in five different phases, corresponding to inlet loading rates varying between 2.1 and 93.5 g m−3 h−1 for H
2S, 55.3 and 1260.2 g m−3 h−1 for methanol, and 2.8 and 161.1 g m−3
h−1 for α‐pinene. Empty bed residence times were varied between 83.4 and 10 s in the first stage and 146.4 and 17.6 s in the second stage. The BTF, working at a pH as low as 2.7 as a result of H2S degradation, removed most of the H2S and methanol but only
very little α‐pinene. On the other hand, the BF, at a pH around 6.0, removed the rest of the H2S, the non‐degraded methanol and most of the α‐pinene vapours. Attempts
were originally made to remove the three pollutants in a single acidophilic bioreactor, but the Ophiostoma strain was hardly active at pH <4. The maximum elimination capacities (ECs) reached by the two‐stage bioreactor for individual pollutants were 894.4 g m−3 h−1 for methanol, 45.1 g m−3 h−1 for H2S and 138.1 g m−3 h–1 for α‐pinene.
The results from this study showed the potential effectiveness of a two‐stage bioreactor for treating H2S together with two hydrophilic and hydrophobic VOCs that
are typically emitted from wood industries.
Keywords
Introduction
Rapid industrial proliferation in the last few decades has contributed to an enormous increase in the generation of waste gas from many industries and production processes. This has led to increasingly stringent regulatory requirements in many countries in recent years. Biological treatment systems such as biotrickling filters (BTF) and biofilters (BF) have shown promising results for handling waste gases at low concentrations and at moderately high flow rates. Bioprocesses depend on the activity of microorganisms to decontaminate polluted air, through a series of complex phenomenological steps comprising absorption, adsorption, diffusion and biodegradation. The pollutants are thereby oxidized to CO2, H2O and other harmless
end products [1]. To date, most lab‐scale biofiltration studies address the removal of single pollutants under relatively constant operating conditions. Such conditions are highly unusual at wastewater treatment plants and in other full‐scale applications. Waste gases arising from wood industries consist of a complex mixture of H2S and
other reduced sulphur compounds (RSCs), such as dimethyl sulphide, dimethyl disulphide and methyl mercaptan, as well as volatile organic compounds, such as methanol, terpenes, alcohols, phenol, ketones, and formaldehyde [1]. Hydrogen sulphide, methanol and α‐pinene are representative inorganic, hydrophilic and hydrophobic pollutants present in these emissions, respectively. Emissions of H2S give
rise to nuisance odours, as they smell like rotten eggs, and have been shown to cause negative effects on the environment. Exposure to H2S is harmful to crops and
vegetation and is highly corrosive to materials. According to the US Occupational Safety and Health Administration, a maximum safe exposure limit for this compound is 20 ppm at the workplace, but the odour from this gas can be detected down to concentrations below 0.5 ppb [2]. Methanol (CH3OH) is a hydrophilic compound and
one of the 189 hazardous air pollutants listed in Title III of the 1990 Clean Air Act Amendment proposed by the US Environmental Protection Agency [3]. α‐Pinene (C10H16), on the other hand, is a hydrophobic volatile organic chemical (VOC) that is
hardly water soluble, and is emitted by forest product industries, particularly sawmills and composite board mills, as well as the pulp and paper industry (vapour pressure: 10 mm Hg at 25 °C, water solubility: 2.5 ppm at 25 °C) [3–5]. It can cause acute health effects, which include irritation due to direct eye contact, ingestion or inhalation. However, its carcinogenic, mutagenic and tetragenic effects are unknown. The presence of methanol and α‐pinene, as well as other VOCs, in air emissions from wood industries has been the subject of recent environmental regulations, and the industries are required to apply an appropriate technology to reduce their emissions.
Most of the reported research focuses either on biofiltration of mixtures of VOCs or mixtures of RSCs [6–8]. Only a few researchers have worked on the co‐treatment of H2S and VOCs [9–11]. One problem encountered is that the pH of the biofilm will drop
may temporarily be inhibited with the rapid pH decline, thereby reducing the effectiveness of the treatment of organic compounds and sulphides. Another problem with acid production is that acids degrade organic media, such as compost, and can open channels in some areas and cause compaction in others. In addition, the head loss will rise, thereby increasing the operating costs and decreasing the efficiency. A two‐stage BF for the treatment of waste air from wastewater treatment plants has been successfully tested [12]. The first stage, a BF packed with lava rock, was optimized for removal of H2S, whereas the second stage was a conventional BF using
wood chip. However, it was observed that the pH of the wood chip medium in the second‐stage BF had fallen to 2.5 near the inlet by the end of the study. When treating air polluted with a high H2S concentration, this may reduce the efficiency of the
second‐stage BF. Also, the results indicated that there was a considerable flow heterogeneity in both the acidic gas‐phase BF and the wood chip BF. The co‐treatment of H2S and organic vapour investigated in a lava‐rock pilot‐scale BF, operating at a pH
of 4.0, showed high removal efficiencies (REs) for H2S (96%) and VOC (53.2%) at an
empty bed residence time (EBRT) of 12.2 s [13]. The results showed that microbial species in a low pH environment were also capable of degrading organic compounds. The feasibility for sequential biofiltration of H2S and a VOC vapour (methyl tert‐
butylether, MTBE) from waste air from a wastewater treatment plant was evaluated using laboratory‐scale and field studies [14]. The results showed complete removal of both H2S and MTBE at a loading rate of 8.3 g H2S m−3 h−1 (EBRT 15 s) and 33 g MTBE
m−3 h−1 (EBRT 60 s), respectively. In a BTF coupled with a BF, the co‐treatment of H2S
with low concentrations of aliphatic and aromatic VOCs, predominantly toluene vapours, did not exhibit any inhibition in removal profiles [15]. Toluene removal efficiencies were greater than 90% at a concentration of 41 ppb, and average H2S
removal efficiencies were about 75% at a concentration of 314 ppm.
In our previous work [11], a low‐pH single‐stage BTF was successfully designed for the co‐treatment of H2S and methanol. An Ophiostoma stenoceras strain that utilizes α‐
pinene as a sole carbon and energy source was also isolated. It has been reported that introducing methanol to an already existing bacterial community (Thiobacillus sp. and
Sulfobacillus sp.) enhanced bacterial diversity, which led to increased biodegradation of both H2S and methanol [16]. In a recent study, a hybrid system combining a BF and a
BTF section, with different microbes and operating pH levels, for the overall removal of H2S, α‐pinene, and methanol from polluted air was tested in our lab. However, the
performance of the hybrid system for α‐pinene was not good because of the low fungal growth in the BF section due to the only moderate tolerance of the fungus to acidification. A two‐stage system consisting of a low‐pH BTF stage and a fungal BF stage may solve this problem. The fungal BF stage can be protected from acidification because most of the H2S and methanol can be removed in the first stage. Also, even if
a small amount of H2S enters the second stage, this will not be a problem because the
was to test the two‐stage system for the overall removal of H2S, methanol and α‐
pinene from polluted air. The bioreactors were operated under different conditions in order to maximize the performance of the system.
Materials and methods
Microorganisms and media composition
A mixture of an autotrophic H2S‐degrading culture and an acid‐tolerant methanol‐
degrading yeast (Candida boidinii) was used as inoculum for the BTF stage. The inoculum was obtained from the previous co‐treatment of H2S and methanol in a BTF
operated at a low pH of 2.0. A new fungal isolate, Ophiostoma stenoceras, was isolated as dominant strain from a BF originally used for treating α‐pinene. The composition of the mineral salt medium used in the BTF was (in g L−1 of deionized water): KH
2PO4 2.0,
K2HPO4 2.0, NH4Cl 0.4, MgCl2·6H2O 0.2, FeSO4·7H2O 0.01. The medium used in the
fungal BF had the following composition (g L−1): K
2HPO4 0.5, MgSO4·7H2O 0.1, KH2PO4
4.5, NH4Cl 2.0 and 2 mL of a trace element and vitamin solution [17]. The bed’s
moisture content was maintained constant by periodic addition (once every three days) of fresh mineral salt medium (pH 5.9) from the top of the BF.
Experimental set‐up
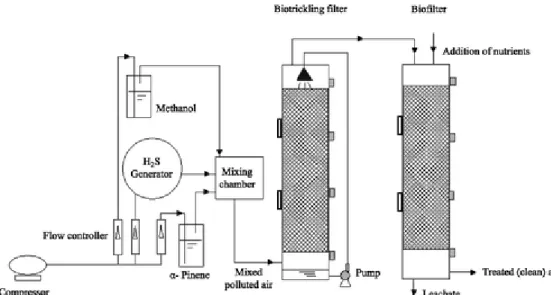
The two‐stage bioreactor comprising a BTF and a BF is shown in Figure 1. The first stage is a 2.78 L BTF, in which a mixed H2S‐degrading culture and an acid‐tolerant yeast
Figure 1 Schematic of the two‐stage bioreactor (BTF followed by BF).
A compressed air stream was split into three flows. Hydrogen sulphide was generated by passing the major portion of the air stream over an H2SO4 solution into which a
solution of Na2S was dripped. Different gas‐phase H2S concentrations were obtained
by changing the Na2S concentration and/or dripping rate. The other two minor air
streams were bubbled through liquid methanol and α‐pinene, respectively, in flasks. The three streams were combined in a mixing chamber and fed to the bottom of the BTF column in a countercurrent flow mode. The aqueous mineral medium described above was continuously recirculated over the packed bed using a peristaltic pump (323E/D, Watson‐Marlow Limited, Falmouth, England) at a constant volumetric flow rate of 2.77 L h–1. The exit air from the top of the BTF was later fed through the fungal BF in a downflow mode. The two‐stage bioreactor’s performance was estimated by calculating the elimination capacity of the filter bed and removal efficiency of the corresponding pollutant at different inlet loading rates, according to equations defined elsewhere in the literature [1].
Analytical methods
The pH was measured with a Crison 507 pH meter (Crison Instruments S.A., Barcelona, Spain), using a combined glass electrode. A glass U‐tube water manometer was used to measure the pressure drop across the filter bed height. The moisture content (%) in the filter bed (stage II) was measured according to the procedure described elsewhere [18]. Hydrogen sulphide concentration was determined using a hand‐held sensor (Dräger Sensor XSEC H2S HC6809180, Dräger Safety Hispania S.A., Madrid, Spain). Gas
phase concentrations of methanol and α‐pinene were measured via gas chromatographic analysis using a Hewlett‐Packard 5890 series II GC. The GC was equipped with a flame ionization detector. The following flow rates were used: H2 – 30
mL min−1, air – 300 mL min−1. The inlet and outlet streams were sampled. The GC was
Thermo Scientific, USA) and helium was used as the carrier gas (flow rate: 2.0 mL min−1). The temperatures at the GC injection, oven and detection ports were 150, 150
and 150 °C, respectively. Similarly, CO2 concentrations were measured using another
Hewlett‐Packard 5890 GC fitted with a thermal conductivity detector (TCD). The CO2
concentrations were determined at an injection temperature of 90 °C, an oven temperature of 25 °C and using a TCD at 100 °C [11]. Pall ring and perlite samples, immobilized with biomass and exposed to methanol, H2S and α‐pinene vapours, were
prepared for observations under the electron microscope according to the procedure described elsewhere [17]. Examinations were performed with a JEOL JSM‐6400 scanning electron microscope (JEOL Ltd., Japan) working at a voltage of 20 kV and a working distance of 15 mm, and with Oxford Instruments (Abingdon, England) energy‐ dispersive x‐ray equipment.
Results and discussion
Performance of the biotrickling filter and biofilter during start‐up
During the first 14 d, the concentrations of methanol were kept relatively high (1.5–5 g m−3) because of the good removal of that pollutant, while H
2S concentrations were less
than 0.05 g m−3. In the BTF, though nearly 82% methanol was removed, giving rise to ECs as high as 205 g m−3 h−1, the removal of H2S was just about 80% at low loading
rates. In that reactor, an uneven biomass distribution was noticed along the bed height, with a more clustered biomass in the top section and a fairly meagre biomass in the bottom section of the filter bed. On the 15th day, the BTF was stopped for six hours and repacked manually to distribute the biomass evenly along the bed height. The concentration of methanol was lowered to 0.6 g m−3.
After this new start‐up and from the 16th day, the concentration of H2S and methanol
were increased slowly. The H2S and methanol removal efficiencies in the BTF improved
slowly, reaching an EC of 197 g m−3 h−1 for methanol and 1.9 g m−3 h−1 for H2S. The
much higher EC reached for methanol was presumably because of the much faster growth and activity of the heterotrophic VOC‐degrader. The increase in RE was also well correlated with the decline in pH of the recycled mineral salt medium, presumably because of the production of H+ and sulphate from the oxidation of H2S [19]. The
medium was replaced once every four days or when its pH dropped below 2.7. On the other hand, the BF (2nd stage), though fed with low concentrations of α‐pinene (<0.2 g m−3), showed steady and increasing removal performance, where nearly 100% of the incoming α‐pinene was removed at the end of the 28th day, corresponding to an EC of 3.9 g m−3 h−1. The moisture content in the BF was monitored periodically by collecting
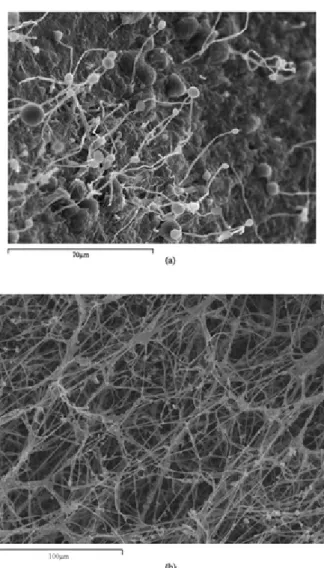
start‐up period, both the BTF and BF were ready to be tested for their performance under different operating conditions. Media samples were collected after 44 days of continuous operation and subjected to SEM (scanning electron microscopy) analysis. From the SEM photographs shown in Figure 2, it can be seen that a mixed culture composed of bacteria, yeasts (presumably Candida boidinii) and filamentous fungi (Figure 2a) was present in the BTF, whereas Ophiostoma sp. was clearly predominant in the BF (Figure 2b). These images were confirmed based on previous observations by our research group [11,20].
Figure 2 SEM images taken from (a) the first‐stage BTF and (b) the second‐stage BF.
Long‐term removal performance of the biotrickling filter and biofilter
After start‐up, experiments were carried out in five phases, at flow rates of 0.12, 0.24, 0.36, 0.5 and 1 m3 h–1 corresponding to different EBRTs and inlet loading rates of H
2S,
Table 1. Experimental conditions of the two‐stage bioreactor.
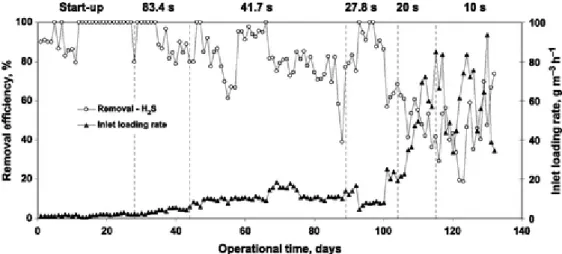
During the first experimental phase (days 29–43), at EBRTs of 83.4 s (BTF) and 146.4 s (BF), the concentration of all three compounds was gradually increased: 0.04–0.1 g m−3 for H2S, 4.7–6.8 g m−3 for methanol and 0.2–0.3 g m−3 for α‐pinene (Figures 3–5). The
removal efficiency for H2S and methanol in the BTF was nearly 100%, while α‐pinene
removal in the BTF was about 12%. The remaining α‐pinene was completely removed in the 2nd stage BF. The complete biodegradation of H2S produces sulphuric acid. Since
there is no biotransformation consuming the acid, the latter accumulates very fast in the recycling trickling phase, and pH drops significantly to a point where the microbial activity is largely inhibited. In this study, pH was monitored constantly in the recycled liquid, and the values varied between 2.7 and 4.0. Originally it was planned to use only a single‐stage acidic bioreactor inoculated with the mixture of acid‐tolerant microorganisms, i.e. the H2S‐degrading culture, Candida boidinii and Ophiostoma stenoceras. However, the acidophilic fungus (Ophiostoma sp.) only tolerated moderately acidic conditions and was hardly active at a pH below 4.0. Conversely, the yeast (Candida boidinii) showed a much better tolerance to pH values below 4.0.
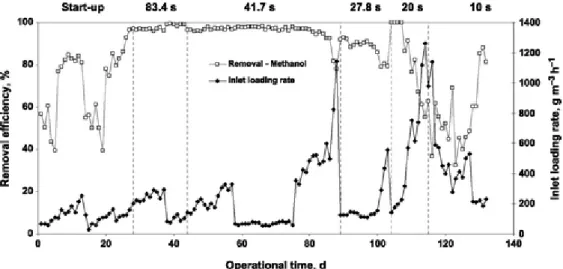
Figure 4 Removal efficiency profile of methanol in the BTF.
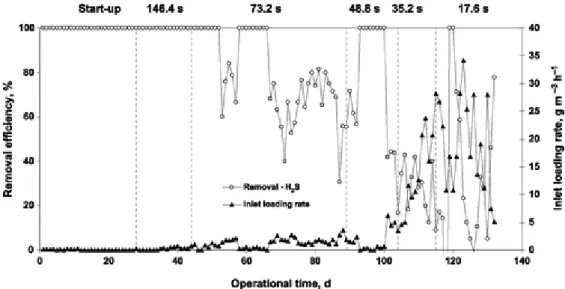
Figure 5 Removal efficiency profile of α‐pinene in the BTF.
Phase II
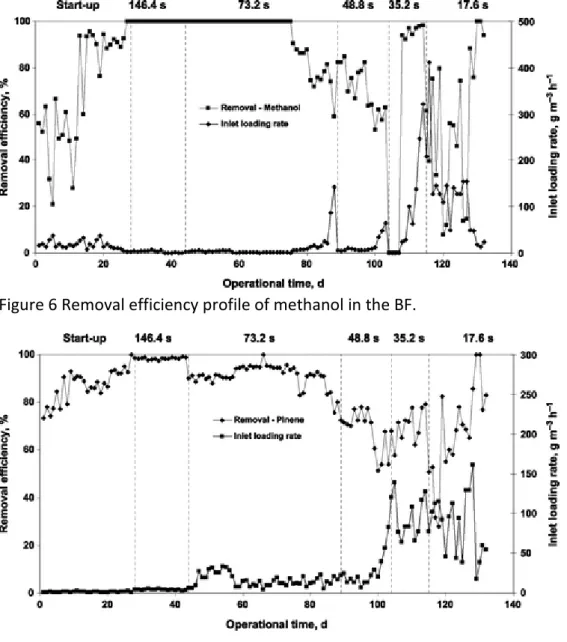
At lower EBRTs of 41.7 s in the BTF and 73.2 s in the BF, and for methanol loading rates varying between 135 and 327 g m−3 h−1 in Phase II (days 44–57), almost 98% of methanol was removed in the BTF, while the remaining part was removed in the 2nd stage BF (Figure 6). Under such conditions, though the inlet loading rates of H2S were
low (6–10.8 g m−3 h−1), the H2S removal in the BTF at an EBRT of 41.7 s dropped from
100% to 66.7%. Hence it was decided to reduce the methanol load and increase the H2S load, thereby enhancing the growth of autotrophic microorganisms and preventing
the surplus growth of heterotrophic organisms that could more easily use methanol rather than H2S. A similar reduction in H2S removal was observed in previous studies
methanol (>57 ppm) reduced the elimination capacity of H2S from 23.8 to 6.4 g m−3
h−1. However in the BF (2nd stage), for α‐pinene loading rates up to 33 g m−3 h−1, more
than 90% of that pollutant was removed (Figure 7). From the 58th day, the concentration of methanol was reduced and kept constant (∼0.7 g m−3) for the next 18 days. Though 100% removal of methanol was plausible in the BTF, interestingly more than 90% of H2S was also removed in the BTF for loading rates up to 18 g m−3 h−1,
whereas just <5% of the remaining H2S was removed in the BF (Figure 8). These results
suggest that low loading rates of methanol (100 g CH3OH m−3 h−1) and moderate
loading rates of H2S are preferred in the BTF in order to achieve high removal
efficiencies without mutual inhibition of both pollutants. Contrary to the present data, it has been observed earlier that the presence of methanol had no significant effect on H2S removal rates in a BF packed with porous, inflated glass material, thereby
achieving ECs as high as 380 and 95 g m−3 h−1 for methanol and H
2S, respectively [10].
Figure 6 Removal efficiency profile of methanol in the BF.
Figure 8 Removal efficiency profile of hydrogen sulphide in the BF.
In the later steps of operation, from the 77th day, the methanol concentration was increased steadily (3.2 to 13.2 g m−3) to estimate its maximum elimination capacity. The loading rates were increased from 327 g m−3 h−1 to 1145.2 g m−3 h−1, where a
maximum EC of 894.5 g m−3 h−1 was noticed with 78.1% removal in the BTF. The BF in
the second stage (Figure 6) was able to remove nearly 60% of the remaining methanol when fed at a loading rate of 142.8 g m−3 h−1. Though the loading rate of H2S in the BTF
was maintained at around 10 g m−3 h−1 during this phase, the removal of H
2S dropped
by about 30–60% (Figure 3) depending on the applied methanol load. However, this stark increase in the methanol load did not affect α‐pinene removal in the BF and its removal was consistently greater than 90%, irrespective of the load (Figure 7).
Phase III
In phase III, at a flow rate of 0.36 m3 h–1 and EBRTs of 27.8 s in the BTF and 48.8 s in the BF, the loading rates were varied between 4.6 and 25.2 g m−3 h−1, 109 and 554 g
m−3 h−1, and 18.7 and 150.8 g m−3 h−1 for H2S, methanol and α‐pinene, respectively. In
the BTF, for loading rates less than 10 g H2S m−3 h−1, H2S removal was greater than
95%, whereas this value dropped to 65% when the load was increased beyond 20 g m−3 h−1. This could possibly be due to an increase in the methanol concentration (days
100–103) from 1.2 to 4.3 g m−3. The results clearly indicate severe antagonistic effects on H2S removal due to the presence of an easily biodegradable VOC – methanol. The
BTF was also able to remove nearly 10% of the incoming α‐pinene vapour, though most α‐pinene removal occurred in the second stage (Figure 7). A maximum EC of 44.6 g α‐pinene m−3 h−1 was observed in the BF at an inlet loading rate of 82.7 g m−3 h−1.
Phases IV and V
and 35.2 s and 17.6 s in the 2nd stage, and subjected to very high loading rates of individual pollutants. The H2S loading rates were varied between 19 and 93.5 g m−3 h−1,
while methanol and α‐pinene loading rates were varied between 140 and 1260 g m−3 h−1, and 36.3 and 248.6 g m−3 h−1, respectively. At the lowest EBRT of 10 s, the BTF was not able to remove any α‐pinene from the contaminated mixture, whereas both H2S
and methanol were removed moderately under the tested conditions. For instance, on the 130th day, at H2S loading rate of 93.5 g m−3 h−1 and methanol loading rate of 221 g
m−3 h−1, the removal efficiencies of H2S and methanol were 47.6% and 85.2%,
respectively, in the BTF, followed by 100% removal of the remaining methanol and a mere 5.1% removal of the remaining H2S in the second stage (BF). Even under such
extreme conditions, during the final two phases of operation, the maximum EC of α‐ pinene in the BF was 138.1 g m−3 h−1 with 85.7% removal, which is highly similar to our previous studies on α‐pinene removal, as a single pollutant, in a fungal biofilter inoculated with Ophiostoma [20]. However, the EBRT was quite low here, i.e. 17.6 s, to be compared to an EBRT of 72s used in the fungal biofilter.
Pressure drop variations
The pressure drop in the BTF was initially very low at less than 0.8 cm H2O, and
increased to a maximum of about 4.6 cm H2O at the end of the experiments, when the
flow rate was 1 m3 h−1. On the other hand, the fungal BF (2nd stage) showed no
increase in pressure drop during the experimental period, and these values fluctuated moderately from 0.3 to 0.9 cm H2O, irrespective of the flow rate, despite the fact that
fungal biofilters are often expected to become clogged faster than other systems because of the filamentous morphology of fungi [21].
Relationship between inlet loading rate and elimination capacity in the bioreactors
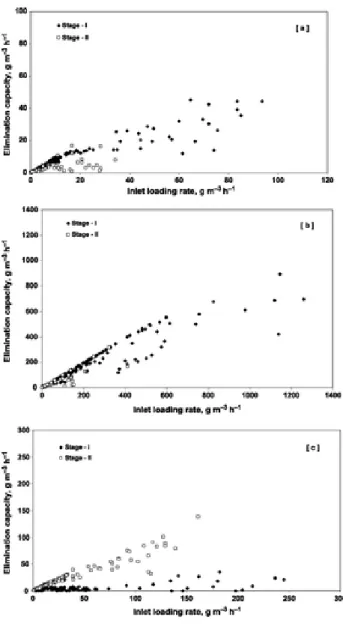
To establish suitable operating criteria necessary for scaling up the bioreactors, the relationship between the inlet loading rates and the elimination capacities has to be identified. Such relationships are shown in Figure 9, by comparing the elimination capacity of the bioreactors in stage I (BTF) and stage II (BF) for individual pollutants. The elimination capacity is defined as the amount of pollutant degraded per unit time, normalized to the volume of packed bed [22]. As shown in Figure 9, the relationship between the inlet load and elimination capacity is almost linear for all the pollutants up to a critical load after which the linear trend tends to either decrease slightly or become nearly constant. Such a pattern for elimination capacity profiles are quite common for biological treatment systems such as BTFs and BFs, where the maximum performance is affected by a number of factors that include pollutant load and toxicity, microbial growth rate and activity, physico‐chemical parameters, O2 consumption
Figure 9 Elimination capacity of stage I BTF (♦) and stage II BF (□): (a) hydrogen sulphide (b) methanol (c) α‐pinene.
Hydrogen sulphide
Hydrogen sulphide loads applied to the BTF (1st stage) varied from 1.5 to 93.5 g m−3
h−1, whereas the non‐degraded H2S entering the second stage BF had loads varying
between 0.27 and 34.2 g m−3 h−1, for the entire operation time of 132 days. A maximum EC of 45.1 g m−3 h−1 was achieved in the first stage, followed by a maximum
EC of 16.8 g m−3 h−1 in the second stage (Figure 9a). Under aerobic conditions,
oxidation of H2S by chemotrophs occurs with O2 as an electron acceptor, while the
electron donors could be So, H2S or S2O3 2− [24,25]. Under oxygen‐limiting conditions,
sulphur is the major end product. Otherwise, sulphate is formed as well. This can be represented by the following equations:
(2)
(3)
In aerobic autotrophic oxidation of sulphide [26], the following reaction would occur:
(4)
According to the stoichiometry of the aerobic biological oxidation, oxygen is the key parameter that controls the level of oxidation. The sulphate formed during the process could be later removed through precipitation in a settling tank coupled to the BTF, rather than being treated and eventually converted again to H2S in a wastewater
treatment plant [17].
Methanol
The maximum EC of methanol was 894.4 g m−3 h−1 in the first stage followed by 315 g m−3 h−1 in the second stage (Figure 9b). These values for methanol are significantly higher than the results of our previous studies, where the reported maximum EC was 236 g m−3 h−1 in a BTF [11] and 280 g m−3 h−1 in a lava rock BF [27]. Ideally, if the entire
methanol supplied to the reactor is oxidized to carbon dioxide, the removal of 1 g of methanol will result in the production of 1.375 g of CO2 according to Equation (5),
neglecting biomass growth. Such a complete conversion was confirmed through mass balance calculations.
(5)
α‐Pinene
comparable to the results of our previous studies (146 g m−3 h−1), where pinene was treated individually in a lava rock BF in the presence of Ophiostoma sp. [20]. In the BTF (1st stage), a maximum EC of 35.4 g α‐pinene m−3 h−1 was attained, though the majority of the α‐pinene was removed in the BF. Leachate samples collected periodically from the BF were analysed for pH, and these values were found to vary from 3.5 to 4.9 depending on the applied pollutant loading rates. The pH drop here was mainly due to the use of NH4Cl as the nitrogen source.
The presence of filamentous fungi, such as Ophiostoma stenoceras, offers some advantages in the BF. Fungi develop hypea, which could provide a large surface area in contact with the gas phase so that a direct efficient mass transfer from the gas phase to the biofilm phase is possible. This allows a faster uptake of hydrophobic compounds (α‐pinene) than in flat aqueous bacterial biofilms [21,28]. Carbon dioxide was identified as the end product (CO2 data not shown), the rest being converted to
biomass. From previous shake flask experiments with Ophiostoma stenoceras, the yield coefficient of biomass was determined to reach 1.25 kg dry biomass per kg α‐ pinene consumed [20]. The following stoichiometry was derived considering the yield coefficient value and the fact that NH4Cl was used as the nitrogen source and that the
typical cellular composition could be denoted as C5H7NO2 [1].
(6)
Conclusions
The methanol degrader (a yeast) appeared to tolerate very low pHs (below 3.0), but the α‐pinene degrader (a fungus) tolerated only mild acidification (around pH 4.0). The pH dropped below 3.0 in the first‐stage reactor removing H2S and methanol.
In the BTF, the presence of methanol had a significant effect on H2S removal, at high
inlet loading rates of methanol. For methanol loading rates less than 66 g m−3 h−1, although 100% methanol was removed, more than 90% H2S was removed for H2S loads
less than 18 g m−3 h−1. The presence of α‐pinene in the waste gas stream did not
appear to show any antagonistic or synergistic effects on H2S and methanol removals
in the biotrickling filter. The maximum EC of methanol and H2S reached as high as
894.4 g m−3 h−1 and 45.1 g m−3 h−1, respectively.
biological catalyst for rapid mass transfer of the hydrophobic pollutant, α‐pinene, from the gas phase to the aqueous biofilm.
Acknowledgements
The present research was financed by the Ministry of Foreign Affairs (Project: A/015962/08) and through European FEDER funds. Eldon R. Rene thanks the Ministry of Science and Innovation for his ‘Juan de La Cierva’ post‐doctoral research contract. Yaomin Jin was financially supported through a project of the Xunta de Galicia (Project: PGIDIT05PXIC10304PN). The authors would also like to thank M.E. López, University of La Coruńa, for her help and collaboration during the final stages of some experiments.
References
• 1. Kennes, C. and Veiga, M.C. 2001. “Bioreactors for Waste Gas Treatment”.
Dordrecht: Kluwer Academic.
• 2. Busca, G. and Pistarino, C. 2003. Technologies for the abatement of sulphide
compounds from gaseous streams: A comparative overview. J. Loss Prev. Process Ind., 16: 363–371.
• 3. Spicer, G.W., Gordon, S.M., Holdren, M.W., Kelly, T.J. and Mukund, R. 2002.
Air Pollution Handbook – Measurements, properties and fate of ambient air, Boca Raton, , USA: CRC Press, Lewis Publisher.
• 4. Kleinheinz, G.T., Bagley, S.T., St. John, W.P., Rughani, J.R. and McGinnis, G.D.
1999. Characterization of alpha‐pinene–degrading microorganisms and application to a bench‐scale biofiltration system for VOC degradation. Arch. Environ. Contam. Toxicol., 37: 151–157.
• 5. Dhamwichukom, S., Kleinheinz, G.T. and Bagley, S.W.T. 2001. Thermophilic
biofiltration of methanol and alpha‐pinene. J. Ind. Microbiol. Biotechnol., 26: 127–133.
• 6. Aizpuru, A., Malhautier, L., Roux, J.C. and Fanlo, J.L. 2001. Biofiltration of a
mixture of volatile organic emissions. J. Air Waste Manage. Assoc., 51: 1662– 1670.
• 7. Ruokojärvi, A., Ruuskanen, J., Martikainen, P.J. and Olkkonen, M. 2001.
Oxidation of gas mixtures containing dimethyl sulfide, hydrogen sulfide, and methanethiol using a two–stage biotrickling filter. J. Air Waste Manage. Assoc., 51: 11–16. 2001
• 8. Sercu, B., Nunez, D., van Langenhove, H., Aroca, G. and Verstraete, W. 2005.
Operational and microbiological aspects of a bioaugmented two‐stage biotrickling filter removing hydrogen sulfide and dimethyl sulphide. Biotechnol. Bioeng., 90: 259–269.
• 9. Cox, H.H.J. and Deshusses, M.A. 2002. Co–treatment of H2S and toluene in a
biotrickling filter. Chem. Eng. J., 87: 101–110.
• 10. Sologar, V.S., Lu, Z. and Allen, D.G. 2003. Biofiltration of concentrated
• 11. Jin, Y., Veiga, M.C. and Kennes, C. 2007. Co‐treatment of hydrogen sulphide
and methanol in a single‐stage biotrickling filter under acidic conditions.
Chemosphere, 68: 1186–1193.
• 12. Chitwood, D.E., Devinny, J.S. and Reynolds Jr, F.E. 1999. Evaluation of a
two‐stage biofilter for treatment of POTW waste air. Environ. Prog., 18: 212– 221.
• 13. Devinny, J.S. and Chitwood, D.E. 2000. Two‐stage biofiltration of sulfides
and VOCs from wastewater treatment plants. Water Sci. Technol., 42: 411–418.
• 14. Cox, H.H.J., Deshusses, M.A., Converse, B., Shroeder, E.D., Vasooghi, D.,
Samar, P. and Iranpour, R. 2003. Odor and VOC removal from wastewater treatment plant headworks ventilation air using a biofilter. Water Environ. Res., 5: 444–454.
• 15. Martinez, A., Rathubandla, S., Jones, K. and Cabezas, J. 2008. Biofiltration of
wastewater lift station emissions: Evaluation of VOC removal in the presence of H2S. Clean Technol. Environ. Policy, 10: 81–87.
• 16. Ding, Y., Das, K.C., Whitman, W.B. and Kastner, J.R. 2006. Enhanced
biofiltration of hydrogen sulphide in the presence of methanol and resultant bacterial diversity. Trans. ASABE, 49: 2051–2059.
• 17. Jin, Y., Veiga, M.C. and Kennes, C. 2005. Autotrophic deodorization of
hydrogen sulphide in a biotrickling filter. J. Chem. Technol. Biotechnol., 80: 998– 1004. [CrossRef], [Web of Science ®]
• 18. Mohammad, T., Veiga, M.C. and Kennes, C. 2007. Mesophilic and
thermophilic biotreatment of BTEX‐polluted air in reactors. Biotechnol. Bioeng., 97: 1423–1438. [CrossRef], [PubMed], [Web of Science ®]
• 19. Duan, H., Koe, L.C.C., Yan, R. and Chen, X. 2006. Biological treatment of H2S
using pellet activated carbon as a carrier of microorganisms in a biofilter. Water Res., 40: 2629–2636.
• 20. Jin, Y., Veiga, M.C. and Kennes, C. 2006. Performance optimization of the
fungal biodegradation of α‐pinene in gas‐phase biofilter. Proc. Biochem., 41: 1722–1728.
• 21. Kennes, C. and Veiga, M.C. 2004. Fungal biocatalysts in the biofiltration of
VOC polluted air. J. Biotechnol., 113: 305–319.
• 22. Kennes, C., Rene, E.R. and Veiga, M.C. 2009. Bioprocesses for air pollution
control. J. Chem. Technol. Biotechnol., 84: 1419–1436.
• 23. Veiga, M.C. and Kennes, C. 2001. Parameters affecting performance and
modelling of biofilters treating alkylbenzene polluted air. Appl. Microbiol. Biotechnol., 55: 254–258.
• 24. Buisman, J.N., Post, R., Ijspreet, P., Geraats, S. and Lettinga, G. 1989.
Biotechnological process for sulphide removal with sulphur reclamation. Acta Biotechnol., 9: 271–283.
• 25. Syed, M., Soreanu, G., Falletta, P. and Béland, M. 2006. Removal of
hydrogen sulfide from gas streams using biological processes – a review. Can. Biosyst. Eng., 48: 2.1–2.14.
• 26. Kuenen, J.G. 1975. Colourless sulphur bacteria and their role in the sulphur
• 27. Prado, O.J., Veiga, M.C. and Kennes, C. 2005. Treatment of gas‐phase
methanol in conventional biofilters packed with lava rock. Water Res., 39: 2385–2393.
• 28. van Groenestijn, J.W. and Liu, J.X. 2002. Removal of alpha‐pinene from