Validation study of genetic biomarkers of
response to TNF inhibitors in rheumatoid
arthritis
Rosario Lopez-Rodriguez1, Eva Perez-Pampin1, Ana Marquez2, Francisco J. Blanco3, Beatriz Joven4, Patricia Carreira4, Miguel Angel Ferrer5, Rafael Caliz5, Lara Valor6, Javier Narvaez7, Juan D. Cañete8, Maria del Carmen Ordoñez9, Sara Manrique-Arija9, Yiannis Vasilopoulos10, Alejandro Balsa11, Dora Pascual-Salcedo12, Manuel J. Moreno-Ramos13, Juan Jose Alegre-Sancho14, Federico Navarro-Sarabia15, Virginia Moreira15, Rosa Garcia-Portales16, Enrique Raya17, Cesar Magro-Checa17,18, Javier Martin2, Juan J. Gomez-Reino1¤, Antonio Gonzalez1*
1 Experimental and Observational Rheumatology and Rheumatology Unit, Instituto de Investigacio´n Sanitaria, Hospital Clı´nico Universitario de Santiago, Santiago de Compostela, Spain, 2 Instituto de Parasitologı´a y Biomedicina Lo´pez-Neyra, CSIC, Granada, Spain, 3 Rheumatology Department, Instituto de Investigacion Biomedica–Complejo Hospitalario Universitario A Coruna, Coruna, Spain, 4 Reumatology Department, Madrid, Spain, 5 Rheumatology Unit, Hospital Universitario Virgen de las Nieves, Granada, Spain, 6 Rheumatology Unit, Hospital General Universitario Gregorio Maraño´ n, Madrid, Spain, 7 Department of Rheumatology, Hospital Universitario de Bellvitge, Barcelona, Spain, 8 Arthritis Unit, Rheumatology Dpt, Hospital Clinic and IDIBAPS, Barcelona, Spain, 9 Servicio de Reumatologı´a, HRU Carlos Haya, Universidad de Ma´laga, Instituto de Investigacio´n Biome´dica de Ma´laga (IBIMA), Ma´laga Spain, 10 Department of Biochemistry and Biotechnology, University of Thessaly, Larissa, Greece, 11 Rheumatology Unit, Instituto de Investigacio´n Sanitaria del Hospital Universitario La Paz (IdiPAZ), Hospital Universitario La Paz, Madrid, Spain, 12 Department of Immunology, Instituto de Investigacio´n Hospital Universitario La Paz (IdiPAZ), Madrid, Spain, 13 Department of Rheumatology, Hospital Virgen de la Arrixaca, Murcia, Spain,
14 Department of Rheumatology, Hospital Doctor Peset, Valencia, Spain, 15 Rheumatology Unit, Hospital Universitario Virgen Macarena, Sevilla, Spain, 16 Department of Rheumatology, Hospital Virgen de la Victoria, Ma´laga, Spain, 17 Department of Rheumatology, Hospital Clı´nico San Cecilio, Granada, Spain, 18 Department of Rheumatology, Leiden University Medical Center, Leiden, The Netherlands
¤ Current address: Fundacion Ramon Dominguez, Santiago de Compostela, Spain
Abstract
Genetic biomarkers are sought to personalize treatment of patients with rheumatoid arthritis (RA), given their variable response to TNF inhibitors (TNFi). However, no genetic biomaker is yet sufficiently validated. Here, we report a validation study of 18 previously reported genetic biomarkers, including 11 from GWAS of response to TNFi. The validation was attempted in 581 patients with RA that had not been treated with biologic antirheumatic drugs previously. Their response to TNFi was evaluated at 3, 6 and 12 months in two ways: change in the DAS28 measure of disease activity, and according to the EULAR criteria for response to antirheumatic drugs. Association of these parameters with the genotypes, obtained by PCR amplification followed by single-base extension, was tested with regres-sion analysis. These analyses were adjusted for baseline DAS28, sex, and the specific TNFi. However, none of the proposed biomarkers was validated, as none showed associa-tion with response to TNFi in our study, even at the time of assessment and with the out-come that showed the most significant result in previous studies. These negative results are a1111111111 Marquez A, Blanco FJ, Joven B, Carreira P, et al. (2018) Validation study of genetic biomarkers of response to TNF inhibitors in rheumatoid arthritis. PLoS ONE 13(5): e0196793.https://doi.org/ 10.1371/journal.pone.0196793
Editor: Mohammed S. Orloff, University of Arkansas for Medical Sciences, UNITED STATES
Received: November 28, 2017
Accepted: April 19, 2018
Published: May 7, 2018
Copyright:©2018 Lopez-Rodriguez et al. This is an open access article distributed under the terms of theCreative Commons Attribution License, which permits unrestricted use, distribution, and reproduction in any medium, provided the original author and source are credited.
Data Availability Statement: All relevant data are within the paper and its Supporting Information files.
notable because this was the first independent validation study for 12 of the biomarkers, and because they indicate that prudence is needed in the interpretation of the proposed bio-markers of response to TNFi even when they are supported by very low p values. The results also emphasize the requirement of independent replication for validation, and the need to search protocols that could increase reproducibility of the biomarkers of response to TNFi.
Introduction
Rheumatoid arthritis (RA) is a systemic autoimmune disease mainly characterized by
inflam-mation of synovial joints [1]. If poorly treated, RA is very painful and incapacitating, and it
can lead to joint deformities, loss of job and mobility, and premature death. Currently, the prognosis is much better than before the turn of the XXI century thanks to drugs that are
spe-cifically targeted to immune mediators [1,2]. The first drugs of this class were the TNF
inhibi-tors (TNFi), infliximab, and adalimumab, which are monoclonal anti-TNF antibodies, and etanercept, which is a recombinant soluble TNF receptor. Now, more TNFi are available together with other drugs targeting IL6, B cells, T cells or intracellular kinases. This range of drugs is welcomed because none of them is effective in all patients. Typically about 30% of the patients fail to respond to any of the drugs, and an additional 30% of patients show only a par-tial response. This between-patient variability has not prevented the rheumatologists to aim for remission or low disease activity, which they seek by changing from one drug to another,
and by combining them with conventional antirheumatic drugs [1,2]. The election of drug
fol-lows a trial and error approach, which is very unsatisfactory because these drugs are expensive and have potential side effects. Furthermore, delayed control of the disease worsens long term prognosis. A very attractive alternative will be to use biomarkers for personalizing the treat-ment [3,4].
An important effort has been directed to the discovery of genetic biomarkers of response to
TNFi [5,6]. It has involved candidate gene studies and Genome-Wide Association studies
(GWAs). This effort has led to some remarkable findings: the two SNPs (rs3794271 and rs284511) that have achieved association with response to TNFi below the GWAS significance
threshold of p<5 x10⁻⁸[7,8]; the association of thePTPRClocus in three large independent
studies [9–11]; and two other SNPs (rs6427528 and rs113878252) with very convincing
evi-dence of association with response to etanercept [12,13]. Regrettably, none of these results or
any of the other proposed biomarkers is sufficiently validated, either because an independent validation is still pending, or because of lack of replication in other studies.
Here, our aim has been to validate 18 SNPs that were previously associated with response to
TNFi in RA [7,8,14–18]. This list of SNPs includes some of the most promising genetic
bio-markers mentioned above [7,8], and others [14–18]. Unfortunately, none of the SNPs showed
association with response to TNFi in our RA patients.
Materials and methods
Patients
The study population consisted of 581 patients with RA according to the ACR 1987 criteria
[19]. They were treated with an TNFi as the first targeted antirheumatic drug by indication of
the attending rheumatologist. This treatment indication was made with independence of the 00186]. The funders had no role in study design,
data collection and analysis, decision to publish, or preparation of the manuscript.
study. Recruitment of samples was approved by the local ethics committees and patients gave their written informed consent. The study was conducted according to the principles of the Declaration of Helsinki (2013) and was approved by the Research Ethics Committee of Galicia (Spain, code 2014/387). The patients were of European origin (Spanish ancestry = 530 and Greek ancestry = 51). Change in Disease Activity Score 28 joints (ΔDAS28 = DAS28baseline
−DAS28follow-up) was used as the primary outcome. The DAS28 composite index includes
erythrocyte sedimentation rate, self-reported global patient health, and counts of swollen joints
and of tender joints among 28 selected joints [20]. A score over 5.1 indicates high disease
activ-ity, whereas below 3.2 indicates low activity. In addition, response according to the European
League Against Rheumatism (EULAR) criteria was assessed [21]. Non-responders are defined
as patients showing0.6 improvement from baseline DAS28, or showing modest
improve-ment,1.2, but remaining with high disease activity, DAS28>5.1. Good responders show
DAS283.2 and improvement from baseline>1.2. The remaining patients are considered
moderate responders.
Genotyping
Eighteen SNPs were selected because of previous association with response to TNFi in RA
irre-spective of ethnicity or country of origin (Table A inS1 Text) [7,8,14–18]. Genotyping was
conducted by multiplex PCR amplification followed by single-base extension with the SNaP-shot Multiplex Kit (Applied Biosystems, Foster City, California). The primers, probes and detailed protocols used for these analyses are available from the authors upon request.
Replica-tion in duplicate genotyping reacReplica-tions of 10% of the samples, genotype call rate94%,
con-cordance with the Hardy–Weinberg equilibrium (p<0.01), and with SNP frequencies in the
HapMap collections [22], were used for quality control (Table B inS1 Text). Two SNPs
(rs10520789 and rs1679568) did not follow the Hardy–Weinberg equilibrium and were excluded. The R statistical package SNPAssoc was used for Hardy-Weinberg equilibrium
assessment and allelic frequency calculation [23].
Statistical analysis
The main outcome of treatment wasΔDAS28 at 6 months. EULAR non-responders compared
with responders (good + moderate) or non-responders compared with good responders
(mod-erate responders left out) at any time, andΔDAS28 at 3 or 12 months were considered
second-ary outcomes. Linear and logistic regression models forΔDAS28 and EULAR response were
fitted, respectively. Genotypes were considered in accordance with an additive genetic model of minor allele counts (0, 1 or 2). Therefore, positive regression coefficients indicate a better response associated with minor allele additive effects. Analyses were adjusted for baseline DAS28, sex and the specific TNFi. Results were interpreted considering the number of tests following the Bonferroni approach, consistence of results with the different outcomes, inde-pendence from confounding variables, and previous reports. Statistica 7.0 software (Statsoft, Tulsa, OK, USA) was used for the analyses.
Data availability: all data included in this study is available in theS1 Dataset.
Results
Characteristics of the RA patients
Fifteen patients lacking baseline DAS28 information were excluded. The remaining 566 RA
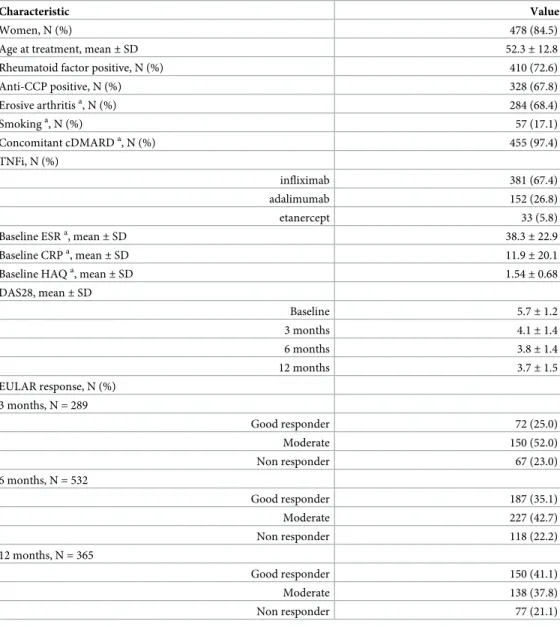
patients showed the demographic and clinical characteristics shown inTable 1. They presented
of the specific RA autoantibodies, and by the high mean disease activity (mean DAS28>5.1) that was not controlled by previous treatments. The patients were evaluated during the course of treatment with infliximab (n = 381), adalimumab (n = 152) or etanercept (n = 33). Response to treatment was evaluated at 3, 6 or 12 months of follow-up with information available for a variable number of patients at each point (n = 289 at 3 months, 532 at 6 months and 365 at 12 months). All of them except 2.6% received TNFi together with conventional antirheumatic drugs. The treatment was associated with a significant decrease in RA activity, which was more
Table 1. Clinical characteristics of the 566 patients with RA.
Characteristic Value
Women, N (%) 478 (84.5)
Age at treatment, mean±SD 52.3±12.8
Rheumatoid factor positive, N (%) 410 (72.6)
Anti-CCP positive, N (%) 328 (67.8)
Erosive arthritisa, N (%) 284 (68.4)
Smokinga, N (%) 57 (17.1)
Concomitant cDMARDa, N (%) 455 (97.4)
TNFi, N (%)
infliximab 381 (67.4)
adalimumab 152 (26.8)
etanercept 33 (5.8)
Baseline ESRa, mean
±SD 38.3±22.9
Baseline CRPa, mean
±SD 11.9±20.1
Baseline HAQa, mean
±SD 1.54±0.68
DAS28, mean±SD
Baseline 5.7±1.2
3 months 4.1±1.4
6 months 3.8±1.4
12 months 3.7±1.5
EULAR response, N (%) 3 months, N = 289
Good responder 72 (25.0)
Moderate 150 (52.0)
Non responder 67 (23.0)
6 months, N = 532
Good responder 187 (35.1)
Moderate 227 (42.7)
Non responder 118 (22.2)
12 months, N = 365
Good responder 150 (41.1)
Moderate 138 (37.8)
Non responder 77 (21.1)
Abbreviations: N, number; SD, standard deviation; anti-CCP, anti-cyclic citrullinated peptide antibodies; cDMARDs, conventional disease-modifying anti-rheumatic drugs; HAQ, health assessment questionnaire; DAS28, Disease Activity Score 28 joints; ESR, erythrocyte sedimentation rate; CRP, C-reactive protein; EULAR, The European League Against Rheumatism.
a
Data from<85% of the patients were available: 415 for erosive arthritis, 334 for smoking, 467 for concomitant cDMARDs, 375 for baseline ESR, 378 for baseline CRP and 372 for baseline HAQ.
marked during the first 3 months than at later times. The mean DAS28 value remained in a
narrow range from the 3rdmonth onward (4.1 to 3.7). In a similar way, the frequency of
non-responders according to the EULAR criteria was very uniform at the three assessment times (21.1 to 23.0%).
Analysis of association with response to TNFi
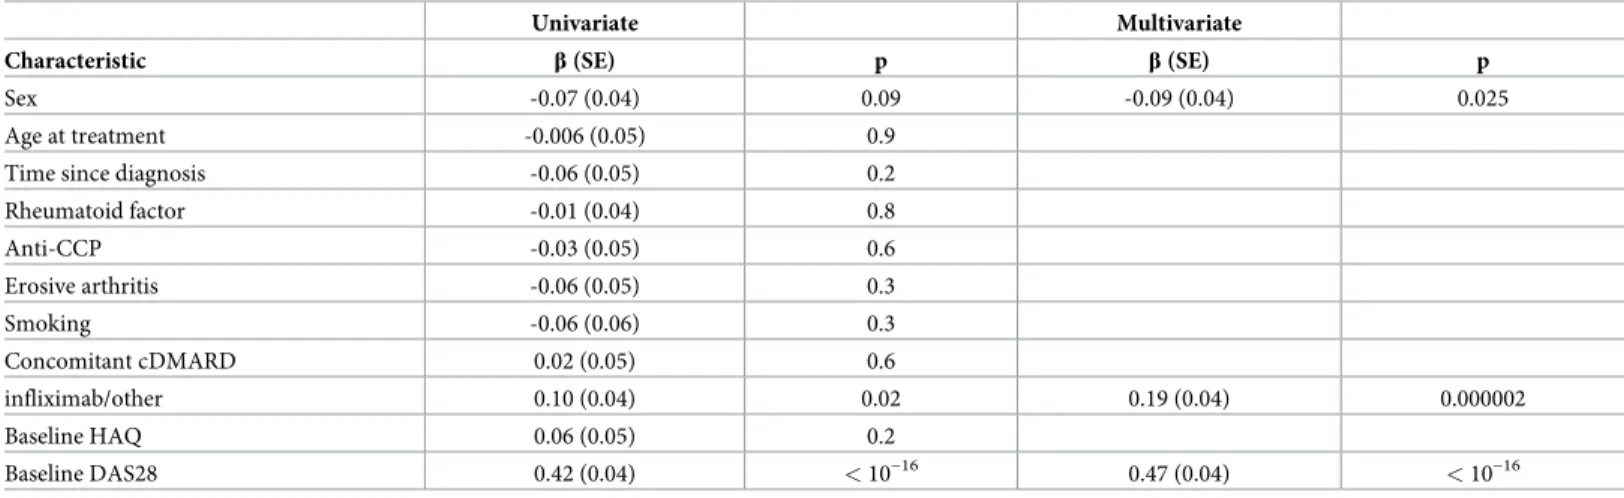
Univariate analyses identified clinical and demographic variables that were associated with ΔDAS28 at 6 months (Table 2). The strongest association was found betweenΔDAS28 and baseline DAS28. It was followed by the specific TNFi used, and by sex. These three variables
retained association in the multivariate analysis including them (Table 2). Therefore, they
were retained as potential confounders for all analyses. No association betweenΔDAS28 at 6
months and age at the start of treatment, time since disease onset, presence of autoantibodies (rheumatoid factor or anti-cyclic citrullinated peptides) or erosions, smoking, concomitant
antirheumatic drug, or baseline disability was observed (Table 2).
Two of the 18 SNPs failed quality control and were excluded from analysis. None of the remaining 16 SNPs was associated with response to TNFi in our patients when the threshold
of significance was adjusted for the number of tests (p<0.003). Specifically, none of the SNPs
was associated with the primary outcome,ΔDAS28 at 6 months, or with the secondary
out-comesΔDAS28 at 3 or at 12 months, even at the level of the uncorrected 0.05 p value (Table 3).
Regarding the secondary outcomes based in EULAR criteria, only a SNP showed nominal association with EULAR non-response (rs10925026 at 6 months), but it was not below the adjusted p value, and the direction of changes was not consistent at other assessment times (Table 4).
Direct comparison with previous studies
We also checked the consistency of our results with the previous studies in which the
biomark-ers had been proposed [7,8,14–18]. This implied to consider the same time of assessment,
mea-sure of response, reference allele, and direction of change (improvement or lack of
improvement) that produced the lowest p value in previous studies (Table 5). In addition, we
considered the comparability of the minor allele frequencies (MAF), the proportions of
Table 2. Characteristics of the patients associated withΔDAS28 at 6 months in either univariate or multivariate regression. Univariate Multivariate
Characteristic β(SE) p β(SE) p
Sex -0.07 (0.04) 0.09 -0.09 (0.04) 0.025
Age at treatment -0.006 (0.05) 0.9
Time since diagnosis -0.06 (0.05) 0.2
Rheumatoid factor -0.01 (0.04) 0.8
Anti-CCP -0.03 (0.05) 0.6
Erosive arthritis -0.06 (0.05) 0.3
Smoking -0.06 (0.06) 0.3
Concomitant cDMARD 0.02 (0.05) 0.6
infliximab/other 0.10 (0.04) 0.02 0.19 (0.04) 0.000002
Baseline HAQ 0.06 (0.05) 0.2
Baseline DAS28 0.42 (0.04) <10−16 0.47 (0.04) <10−16
Abbreviations:β, coefficient of the regression; SE, standard error; anti-CCP, anti-cyclic citrullinated peptide antibodies; cDMARDs, conventional disease-modifying anti-rheumatic drugs; HAQ, health assessment questionnaire; DAS28, Disease Activity Score 28 joints.
patients on each specific TNFi and on concomitant treatment with cDMARD, and the fraction of ACPA positive patients, as all these factors could influence the association.
First, we compared the direction of effect. Only 5 of the 12 SNPs, in which this information was available from the previous studies, showed consistency in direction between our results
Table 3. Results of the linear regression between the studied SNPs andΔDAS28 at 3, 6 and 12 months of treatmenta.
3 mo. 6 mo. 12 mo.
Locus SNP Allele βb p βb p βb p
ALPL rs885813 C - 0.04 0.5 0.01 0.8 - 0.05 0.3
rs885814 T - 0.03 0.5 0.0006 1.0 - 0.06 0.2
CARD8 rs10403848 A - 0.08 0.13 - 0.02 0.5 - 0.03 0.6
rs11672725 T - 0.01 0.8 - 0.01 0.9 - 0.03 0.5
GFRA1 rs7070180 T - 0.02 0.7 - 0.07 0.07 - 0.005 0.9
LRPAP1 rs3468 A 0.02 0.7 0.03 0.5 - 0.04 0.3
LRRC55 rs717117 G - 0.01 0.8 - 0.02 0.6 0.03 0.6
MAP2K6 rs11870477 C 0.02 0.7 0.02 0.6 0.05 0.3
MAP3K7 rs284511 T - 0.03 0.6 - 0.05 0.2 - 0.05 0.3
rs284515 G - 0.06 0.3 0.01 0.8 - 0.04 0.4
NLRP3 rs4925659 A - 0.03 0.6 - 0.01 0.7 - 0.004 0.9
rs4925648 T 0.03 0.5 0.05 0.2 - 0.04 0.4
rs10925026 C - 0.01 0.8 - 0.02 0.7 0.02 0.7
rs4612666 T - 0.03 0.6 0.02 0.7 - 0.005 0.9
NR2F2 rs16973982 C 0.06 0.3 0.07 0.08 0.07 0.11
PDE3A-SLCO1C1 rs3794271 G - 0.04 0.5 - 0.01 0.7 0.05 0.3
a
Linear regression was adjusted by baseline DAS28, TNFi and sex.
b
Allβstandard errors were = 0.05 for analyses at 3 and 12 months, and they were = 0.04 for all analyses at 6 months.
https://doi.org/10.1371/journal.pone.0196793.t003
Table 4. Results of the logistic regression between the studied SNPs and the non-responder EULAR class at 3, 6 and 12 months of treatmenta.
3 mo. 6 mo. 12 mo.
SNP Allele OR (CI 95%) p OR (CI 95%) p OR (CI 95%) p
rs885813 C 0.9 (0.5–1.5) 0.6 1.0 (0.6–1.5) 0.8 1.1 (0.6–1.8) 0.8
rs885814 T 1.0 (0.6–1.6) 1.0 1.0 (0.7–1.4) 0.9 1.4 (1.0–2.1) 0.07
rs10403848 A 1.3 (0.7–2.1) 0.4 1.2 (0.8–1.8) 0.3 1.4 (0.8–2.3) 0.2
rs11672725 T 1.1 (0.7–1.7) 0.7 1.0 (0.7–1.5) 0.8 1.2 (0.8–1.9) 0.4
rs7070180 T 1.2 (0.7–2.1) 0.6 1.3 (0.9–2.1) 0.2 1.0 (0.6–1.6) 0.9
rs3468 A 0.9 (0.5–1.5) 0.6 0.7 (0.5–1.1) 0.12 0.9 (0.5–1.6) 0.8
rs717117 G 1.5 (0.6–3.7) 0.4 1.2 (0.6–2.3) 0.6 0.9 (0.3–1.9) 0.7
rs11870477 C 1.2 (0.7–2.1) 0.6 1.0 (0.6–1.5) 0.9 0.7 (0.4–1.3) 0.3
rs284511 T 1.3 (0.9–1.9) 0.3 1.0 (0.8–1.4) 0.9 1.2 (0.8–1.7) 0.4
rs284515 G 1.2 (0.7–2.0) 0.5 0.9 (0.6–1.4) 0.7 1.4 (0.8–2.3) 0.3
rs4925659 A 1.3 (0.9–2.0) 0.2 0.8 (0.6–1.1) 0.2 1.2 (0.8–1.8) 0.4
rs4925648 T 0.9 (0.4–1.7) 0.7 0.7 (0.4–1.1) 0.10 1.0 (0.6–1.7) 1.0
rs10925026 C 0.9 (0.6–1.4) 0.6 1.4 (1.0–1.9) 0.037 0.9 (0.6–1.3) 0.5
rs4612666 T 1.3 (0.9–2.0) 0.2 0.9 (0.6–1.3) 0.5 1.0 (0.7–1.5) 1.0
rs16973982 C 1.1 (0.5–2.0) 0.9 0.9 (0.5–1.5) 0.7 0.9 (0.5–1.6) 0.6
rs3794271 G 1.2 (0.8–1.8) 0.4 0.7 (0.5–1.0) 0.06 0.8 (0.5–1.2) 0.4
aLogistic regression was adjusted for baseline DAS28, the specific TNFi and sex
Abbreviations: OR, odds ratio; CI, confidence interval
and the previous reports, one was completely neutral (rs4925648), and the other 6 SNPs showed
opposite direction (Table 5). Next, we focused in the effect sizes of the 5 SNPs showing the same
direction of effect in the two studies. For the 2 SNPs assessed asΔDAS28 (rs7070180, rs284511),
the regression coefficients were markedly lower in our study than in the previous ones. Also, for the 3 SNPs assessed according with EULAR criteria (rs4612666, rs717117, rs3794271), the odds ratios were notably nearer 1.0 in our results than in previous reports. Information of direction or size of effect for the remaining 4 SNPs (rs885813, rs885814, rs11870477, rs16973982) was not
available in the previous report [14], and only comparison of the p values was possible. The
con-trast between p values for these 4 SNPs was very notable, because none of them showed even a
trend to association in our results, but showed p values1 x10-5in the previous report [14].
We also found the MAF of most of the SNPs in our patients were similar to the observed in
the previous studies reporting association (Table A inS1 Text). All the MAF were less than
20% different from the previously reported in Europeans, except for rs717117 that was about
half as frequent in our patients as in the Danish patients from the previous report [14]. The
MAF differences were larger (+30% and -33%) for the two SNPs, rs284511 and rs284515,
pre-viously reported in Japanese patients [8]. Additionally, our patients were comparable with
pre-vious ones in the percentage receiving concomitant treatment with cDMARD, which ranged
from 73 to 87% except for a study with all patients on combined treatment [16], and in the
fraction of ACPA positive patients, which ranged from 59 to 89% (Table B inS1 Text).
Table 5. Direct comparison of results for the same outcomes in the current and previous studies. Outcomes were eitherΔDAS28 at 3 or 6 months, or the EULAR cri-teria, which were used as a comparison of non-responders (NR) with responders (good + moderate responders (GR + M)) at 3 months, or a comparison of NR with GR either at 3 or 6 months. Only previous studies with significant associations are included. Comparison of effect size and direction, and of p values.
Effect size p
Outcome SNP Current Previous Current Previous Reference
ΔDAS28 β β
3 mo. rs885813 - 0.04 - 0.5 1.0 x10⁻⁵ 14
rs885814 - 0.03 - 0.5 5.5 x10⁻⁶ 14
rs10403848 - 0.08 0.18 0.13 0.02 15
rs11870477 0.02 - 0.7 3.3 x10⁻⁶ 14
rs284515 - 0.06 0.35 0.3 5.6 x10⁻⁵ 8a
rs16973982 0.06 - 0.3 2.8 x10⁻⁶ 14
6 mo. rs7070180 0.07b 0.30 0.07 6.4 x10⁻⁵ 16
rs284511 0.05c 0.41 0.2 2.5 x10⁻⁸ 8
NRvs. (GR+M) OR OR
3 mo. rs11672725 0.92b 1.05 0.7 0.032 15
rs4925659 0.77b 1.06 0.2 0.006 15
rs10925026 1.12b 0.94 0.6 0.017 15
rs4612666 0.75b 0.64 0.2 0.025 17
NRvs. GR
3 mo. rs717117 1.36 10.7 0.4 9.6 x10⁻⁶ 14
rs4925648 1.00b 1.15 1.0 0.035 15
rs3794271 1.28 3.2 0.3 3.5 x10⁻⁶ 14
2.63 1.7 x10⁻⁵ 7
6 mo. rs3468 0.8 1.28 0.4 0.003 18
a
An even lower p value was reported in this study with the joint analysis of response at 3 and at 6 months.
b
Referred to the opposite outcome to match previous analysis.
c
Referred to the opposite allele, because the minor allele is different in the Japanese and the Europeans.
However, there was a lot of heterogeneity in the distribution of the specific TNFi (Table B in
S1 Text). Five studies (three of which were from the same patient registry) showed an even dis-tribution in three fractions receiving either infliximab, adalimumab or etanercept
[7,15,17,18,24]. Two studies, including the current one, showed about 70% of patients on
infliximab and 25% on adalimumab with only 5% on etanercept [14]. Other two studies were
dominated by patients on infliximab or etanercept, with only 10% on adalimumab [8,16]; and
finally, a unique study included 65% of patients treated with adalimumab, with the remaining
patients distributed between the other two TNFi [25].
Discussion
Our attempt to validate genetic biomarkers of response to TNFi has led to increased doubts on their status. Consequently, our results emphasize the need of independent validation of all genetic findings, even of those that reach the GWAS level of significance. In addition, the results call for a revision of the ideas justifying the search of genetic biomarkers, and to con-sider possible ways to improve their reproducibility.
At a first glance, the most surprising lack of association in our patients corresponds to
rs3794271 inPDE3A-SLCO1C1, and rs284511 nearMAP3K7, because the two SNPs have
reached p<5 x10⁻⁸, the GWAS threshold of significance, in previous studies [7,8]. A more
detailed consideration, yet, indicates that our results are not so striking. In relation with rs3794271, because its role as biomarker has already been contradicted by lack of association
with response to TNFi in 1750 UK patients with RA [24]. This study was much larger than the
two studies that discovered this putative biomarker (196 Danish and 315 Spanish patients,
respectively) [7,14]. A fraction of the patients in the UK study differed from the patients in the
two other studies, but these differences seemed irrelevant for the lack of replication [24]. Our
study, which was in all respects comparable to the Danish and Spanish studies [7,14],
rein-forces this conclusion. In relation to the other SNP, rs284511 (and rs284515 in the same
MAP3K7locus), our study is the first independent validation attempt, but the possibility of an ethnic factor in the discordant results should be reckoned as it was discovered in Japanese
patients [8]. An ethnic factor is well known in the genetic component of RA, where most loci
are shared between Europeans and Asians, but 5 loci are specific to one or the other ethnic
group [26]. This possibility was also suggested by the difference in MAF of the twoMAP3K7
SNPs between our study and the Japanese patients, which was larger than the present for SNPs
from European reports. Asian specificity of theMAP3K7association would explain our result
and that none of the previous GWAS in Europeans have mentioned these two SNPs [12–
14,16,25,27].
Other 5 SNPs were initially discovered in the same Danish GWAS that uncovered the
already discussed SNP inPDE3A-SLCO1C1[14]. All of them showed p<10−4in the 196
patients of that study, but none obtained subsequently any support. The low frequency rs717117 SNP has never been reported again. None of the other 4 SNPs was associated with
response to TNFi in a GWAS of 882 RA patients from the Netherlands [25], and rs11870477
was not replicated in 315 patients of a Spanish study [7]. This latter study did not analyze the
other 4 SNPs.
More intriguing is the status of rs7070180 in theGFRA1gene, whose investigation has been
prone to mishaps. This SNP showed significant association (p<10−4) with response to TNFi
in stages 1 and 2 of a UK study (945 patients in total), but its assay failed in stage 3 [16].
Subse-quent studies never mentioned it, until a recent GWAS in Japanese patients [8]. This study
identified rs1679568, other SNP in the sameGFRA1locus, as associated with response to TNFi
UK patients because rs7070180 was not genotyped or imputed in the Japanese patients [8]. Regrettably, our results were also incomplete. On one side, the rs1679568 assay did not pass quality control in our study. On the other, our results for rs7070180 where inconclusive: we
found a smaller effect size than in Plantet al. (β= 0.07vs. 0.30) [16], but concordant direction
of effect and a trend to association (p = 0.07). Consequently, we think the status of this locus is still ambiguous.
The remaining seven SNPs had shown association with response to TNFi that was
signifi-cant according with the criteria applied to their discovery studies [15,17,18], but that was less
convincing from the statistical point of view (p values between 0.05 and 0.003) than the SNPs discussed above. The additional criteria leading to take these SNPs as potential biomarkers included functional studies that established a correlation between the SNPs and molecular changes that seemed important for RA pathogenesis. Six of these SNPs are located in two
inter-esting genes from the point of view of RA pathogenesis,NLPR3(four SNPs) andCARD8(two
SNPs). Five of them were associated with response to TNFi in a study of 1278 UK patients
with RA [15]. In the same study, the authors found differences in expression of theNLPR3and
CARD8genes between monocytes from RA patients and controls, and association linking the
SNPs with the expression ofNLPR3andCARD8in monocytes [15]. Further support for
associ-ation ofNLPR3with the response to TNFi was provided by an independent study of 538
Dan-ish patients with RA [17]. In this study, only aNLPR3SNP (rs4612666) was tested, but it
showed association. The final SNP of the seven in this group (rs3468) was selected from a very attractive study. In it, the A allele of rs3468 was identified primarily as the SNP that was most
associated (p<1.1 x10⁻⁶) with increased DNA methylation at two cis-CpG sites on the
LRPAP1gene, which, in turn, was strongly associated with response to etanercept (p<1.7
x10-8). In addition, there was weak genetic association (p<0.05) of the A allele of rs3468 with
non-response to TNFi in two sets of RA patients (with 56 and 1204 patients, respectively) [18].
Therefore, the relationship was established mainly as indirect. Our results were clearly con-trary to the previously reported and, together with lack of replication of the other six SNPs in this group, reinforce the well-known fact that the main determinant of reproducibility of
genetic associations is the level of statistical association [28,29].
In addition to the specific comments for each SNP of the previous paragraphs, there are other factors that could have contributed to the lack of reproducibility of the results. The
possi-ble impact of differences in ethnicity has already been discussed in relation with theMAP3K7
SNPs. All other SNPs were described in studies done with European patients and ethnicity is less likely a factor for them. In addition, MAF were comparable for all the SNPs from Euro-pean studies except for rs717117, whose low frequency in our patients (MAF = 5.3%) made for a lower statistical power than in the original study (MAF = 11%). Other study characteristics that could impinge in the results, the fraction of patients on concomitant treatment with cDMARD and the fraction with ACPA, can also be dismissed as differential because they were comparable between studies. Nevertheless, there was marked variability in the distribution of the specific TNFi that the patients had received. No common pattern was found among the reports, with our patients being only comparable with a previous study. The two sets of patients showed predominant treatment with infliximab and few patients on etanercept. The other studies were characterized by a variety of TNFi distributions. Considering that some patients who are resistant to a TNFi respond to a different one, it is possible that these differ-ences in representation of the various TNFi have contributed to the lack of replication.
Our results invite to reconsider the search of genetic biomarkers of response to TNFi. The first point to ponder is the heritability of the phenotype, which was unknown until recently,
when a familial component in the response to TNFi was demonstrated [30], and the
heritabil-ity ofΔDAS28 was quantified (h2
genetic studies [31]. However, change in the number of swollen joints or in the number of
ten-der joints, which are components of DAS28, showed larger heritability thanΔDAS28
suggest-ing that they could be used as more discriminant outcomes of treatment [31]. Possible benefits
of these alternative outcomes remain still untested, and we could not assess their performance in our study because they are not available in many of our patients. Other improvement that has been proposed consist in reducing within patient variability by using as outcome the
aver-ages of frequently repeated response assessments [32]. Another point of interest is the
struc-ture of the genetic component of response to TNFi, which has been clarified by recent studies
[27,33,34]. This component is not significantly shared with the RA susceptibility loci, either
taken individually, or in combination [9,33]. In addition, rare variants with strong effect do
not contribute significantly to the response to TNFi [34]. Therefore, only common variants
unrelated with RA susceptibility seem likely, but the effect of each of them appears to be small. This is the conclusion of a thorough study, with many analysis tools and by multiple teams,
done in 2706 RA patients [27]. This conclusion emphasizes the need to continue searching
with more GWAS, which are very powerful for identifying common genetic variants but need to be large to find those of small effect. Also, it emphasizes the importance of pursuing the best
supported biomarkers to establish their value, asPTPRC[9–11], a recently discovered SNP
associated with response to etanercept [13], the SNPs associated in the Japanese GWAS [8], or
other SNPs with significant association in recent meta-analysis [5]. In addition, it is to be
expected that biomarkers will be searched in other ethnicities as we lack information about many populations that could show particular biomarkers of value for the RA patients from the corresponding genetic background.
The available evidence, therefore, shows the need for prudence in claiming new biomarkers, the requirement for independent replication of all previous findings, and the convenience of exploring the possibility of drug-specific biomarkers among the TNFi, and the use of outcomes with high heritability, as change in the number of swollen or tender joints, and of using aver-ages of repeated assessment of these outcomes, to increase the success of genetic studies. Prog-ress along these lines will require new and large collections of patients.
Supporting information
S1 Text. Information on selected previous studies and compatibility with the current study. It includes two tables. Table A: List of SNPs selected for this study with references and
the corresponding quality control results in the current study. Table B: Characteristics of the patients included in previous studies compared with the current study.
(DOCX)
S1 Dataset. Raw data with all the variables and patients considered in this study.
(XLSX)
Acknowledgments
The authors are indebted to the patients that generously have contributed samples and time to this work. They thank Carmen Pena for her excellent technical support.
Author Contributions
Formal analysis: Rosario Lopez-Rodriguez, Antonio Gonzalez.
Resources: Rosario Lopez-Rodriguez, Eva Perez-Pampin, Ana Marquez, Francisco J. Blanco,
Beatriz Joven, Patricia Carreira, Miguel Angel Ferrer, Rafael Caliz, Lara Valor, Javier
Nar-vaez, Juan D. Cañete, Maria del Carmen Ordoñez, Sara Manrique-Arija, Yiannis
Vasilo-poulos, Alejandro Balsa, Dora Pascual-Salcedo, Manuel J. Moreno-Ramos, Juan Jose Alegre-Sancho, Federico Navarro-Sarabia, Virginia Moreira, Rosa Garcia-Portales, Enrique Raya, Cesar Magro-Checa, Javier Martin, Juan J. Gomez-Reino, Antonio Gonzalez.
Writing – original draft: Rosario Lopez-Rodriguez, Antonio Gonzalez.
Writing – review & editing: Rosario Lopez-Rodriguez, Eva Perez-Pampin, Ana Marquez,
Francisco J. Blanco, Beatriz Joven, Patricia Carreira, Miguel Angel Ferrer, Rafael Caliz, Lara
Valor, Javier Narvaez, Juan D. Cañete, Maria del Carmen Ordoñez, Sara Manrique-Arija,
Yiannis Vasilopoulos, Alejandro Balsa, Dora Pascual-Salcedo, Manuel J. Moreno-Ramos, Juan Jose Alegre-Sancho, Federico Navarro-Sarabia, Virginia Moreira, Rosa Garcia-Por-tales, Enrique Raya, Cesar Magro-Checa, Javier Martin, Juan J. Gomez-Reino, Antonio Gonzalez.
References
1. Burmester GR, Pope JE Novel treatment strategies in rheumatoid arthritis. Lancet. 2017; 389: 2338– 2348.https://doi.org/10.1016/S0140-6736(17)31491-5PMID:28612748
2. Smolen JS, Landewe R, Bijlsma J, Burmester G, Chatzidionysiou K, Dougados M, et al. EULAR recom-mendations for the management of rheumatoid arthritis with synthetic and biological disease-modifying antirheumatic drugs: 2016 update. Ann Rheum Dis. 2017; 76: 960–977.https://doi.org/10.1136/ annrheumdis-2016-210715PMID:28264816
3. Karsdal MA, Bay-Jensen AC, Henriksen K, Christiansen C, Genant HK, Chamberlain C, et al. Rheuma-toid arthritis: a case for personalized health care? Arthritis Care Res (Hoboken). 2014; 66: 1273–1280. 4. Cuppen BV, Welsing PM, Sprengers JJ, Bijlsma JW, Marijnissen AC, van Laar JM, et al. Personalized
biological treatment for rheumatoid arthritis: a systematic review with a focus on clinical applicability. Rheumatology (Oxford). 2016; 55: 826–839.
5. Bek S, Bojesen AB, Nielsen JV, Sode J, Bank S, Vogel U, et al. Systematic review and meta-analysis: pharmacogenetics of anti-TNF treatment response in rheumatoid arthritis. Pharmacogenomics J. 2017; 17: 403–411.https://doi.org/10.1038/tpj.2017.26PMID:28607508
6. Oliver J, Plant D, Webster AP, Barton A Genetic and genomic markers of anti-TNF treatment response in rheumatoid arthritis. Biomark Med. 2015; 9: 499–512.https://doi.org/10.2217/bmm.15.18PMID:
26079957
7. Acosta-Colman I, Palau N, Tornero J, Fernandez-Nebro A, Blanco F, Gonzalez-Alvaro I, et al. GWAS replication study confirms the association of PDE3A-SLCO1C1 with anti-TNF therapy response in rheu-matoid arthritis. Pharmacogenomics. 2013; 14: 727–734.https://doi.org/10.2217/pgs.13.60PMID:
23651021
8. Honne K, Hallgrimsdottir I, Wu C, Sebro R, Jewell NP, Sakurai T, et al. A longitudinal genome-wide association study of anti-tumor necrosis factor response among Japanese patients with rheumatoid arthritis. Arthritis Res Ther. 2016; 18: 12.https://doi.org/10.1186/s13075-016-0920-6PMID:
26776603
9. Plant D, Prajapati R, Hyrich KL, Morgan AW, Wilson AG, Isaacs JD, et al. Replication of association of the PTPRC gene with response to anti-tumor necrosis factor therapy in a large UK cohort. Arthritis Rheum. 2012; 64: 665–670.https://doi.org/10.1002/art.33381PMID:21952740
10. Ferreiro-Iglesias A, Montes A, Perez-Pampin E, Canete JD, Raya E, Magro-Checa C, et al. Replication of PTPRC as genetic biomarker of response to TNF inhibitors in patients with rheumatoid arthritis. Phar-macogenomics J. 2015.
11. Cui J, Saevarsdottir S, Thomson B, Padyukov L, van der Helm-van Mil AH, Nititham J, et al. Rheuma-toid arthritis risk allele PTPRC is also associated with response to anti-tumor necrosis factor alpha ther-apy. Arthritis Rheum. 2010; 62: 1849–1861.https://doi.org/10.1002/art.27457PMID:20309874
12. Cui J, Stahl EA, Saevarsdottir S, Miceli C, Diogo D, Trynka G, et al. Genome-wide association study and gene expression analysis identifies CD84 as a predictor of response to etanercept therapy in rheu-matoid arthritis. PLoS Genet. 2013; 9: e1003394.https://doi.org/10.1371/journal.pgen.1003394PMID:
13. Julia A, Fernandez-Nebro A, Blanco F, Ortiz A, Cañete JD, Maymo J, et al. A genome-wide association study identifies a new locus associated with the response to anti-TNF therapy in rheumatoid arthritis. Pharmacogenomics J. 2016; 16: 147–150.https://doi.org/10.1038/tpj.2015.31PMID:25896534
14. Krintel SB, Palermo G, Johansen JS, Germer S, Essioux L, Benayed R, et al. Investigation of single nucleotide polymorphisms and biological pathways associated with response to TNFalpha inhibitors in patients with rheumatoid arthritis. Pharmacogenet Genomics. 2012; 22: 577–589.https://doi.org/10. 1097/FPC.0b013e3283544043PMID:22569225
15. Mathews RJ, Robinson JI, Battellino M, Wong C, Taylor JC, Biologics in Rheumatoid Arthritis G, et al. Evidence of NLRP3-inflammasome activation in rheumatoid arthritis (RA); genetic variants within the NLRP3-inflammasome complex in relation to susceptibility to RA and response to anti-TNF treatment. Ann Rheum Dis. 2014; 73: 1202–1210.https://doi.org/10.1136/annrheumdis-2013-203276PMID:
23687262
16. Plant D, Bowes J, Potter C, Hyrich KL, Morgan AW, Wilson AG, et al. Genome-wide association study of genetic predictors of anti-tumor necrosis factor treatment efficacy in rheumatoid arthritis identifies associations with polymorphisms at seven loci. Arthritis Rheum. 2011; 63: 645–653.https://doi.org/10. 1002/art.30130PMID:21061259
17. Sode J, Vogel U, Bank S, Andersen PS, Hetland ML, Locht H, et al. Genetic Variations in Pattern Rec-ognition Receptor Loci Are Associated with Anti-TNF Response in Patients with Rheumatoid Arthritis. PLoS One. 2015; 10: e0139781.https://doi.org/10.1371/journal.pone.0139781PMID:26440629
18. Plant D, Webster A, Nair N, Oliver J, Smith SL, Eyre S, et al. Differential Methylation as a Biomarker of Response to Etanercept in Patients With Rheumatoid Arthritis. Arthritis Rheumatol. 2016; 68: 1353– 1360.https://doi.org/10.1002/art.39590PMID:26814849
19. Arnett FC, Edworthy SM, Bloch DA, McShane DJ, Fries JF, Cooper NS, et al. The American Rheuma-tism Association 1987 revised criteria for the classification of rheumatoid arthritis. Arthritis Rheum. 1988; 31: 315–324. PMID:3358796
20. Prevoo ML, van ’t Hof MA, Kuper HH, van Leeuwen MA, van de Putte LB, van Riel PL Modified disease activity scores that include twenty-eight-joint counts. Development and validation in a prospective longi-tudinal study of patients with rheumatoid arthritis. Arthritis Rheum. 1995; 38: 44–48. PMID:7818570
21. van Gestel AM, Haagsma CJ, van Riel PL Validation of rheumatoid arthritis improvement criteria that include simplified joint counts. Arthritis Rheum. 1998; 41: 1845–1850. https://doi.org/10.1002/1529-0131(199810)41:10<1845::AID-ART17>3.0.CO;2-KPMID:9778226
22. The 1000 Genomes Project Browser. Accessed on: Available fromhttp://browser.1000genomes.org/ index.html
23. Gonzalez JR, Armengol L, Sole X, Guino E, Mercader JM, Estivill X, et al. SNPassoc: an R package to perform whole genome association studies. Bioinformatics. 2007; 23: 644–645.https://doi.org/10. 1093/bioinformatics/btm025PMID:17267436
24. Smith SL, Plant D, Lee XH, Massey J, Hyrich K, Morgan AW, et al. Previously reported PDE3A-SLCO1C1 genetic variant does not correlate with anti-TNF response in a large UK rheumatoid arthritis cohort. Pharmacogenomics. 2016; 17: 715–720.https://doi.org/10.2217/pgs.16.16PMID:27180831
25. Umicevic Mirkov M, Cui J, Vermeulen SH, Stahl EA, Toonen EJ, Makkinje RR, et al. Genome-wide association analysis of anti-TNF drug response in patients with rheumatoid arthritis. Ann Rheum Dis. 2013; 72: 1375–1381.https://doi.org/10.1136/annrheumdis-2012-202405PMID:23233654
26. Okada Y, Wu D, Trynka G, Raj T, Terao C, Ikari K, et al. Genetics of rheumatoid arthritis contributes to biology and drug discovery. Nature. 2014; 506: 376–381.https://doi.org/10.1038/nature12873PMID:
24390342
27. Sieberts SK, Zhu F, Garcia-Garcia J, Stahl E, Pratap A, Pandey G, et al. Crowdsourced assessment of common genetic contribution to predicting anti-TNF treatment response in rheumatoid arthritis. Nat Commun. 2016; 7: 12460.https://doi.org/10.1038/ncomms12460PMID:27549343
28. Kraft P, Zeggini E, Ioannidis JP Replication in genome-wide association studies. Stat Sci. 2009; 24: 561–573.https://doi.org/10.1214/09-STS290PMID:20454541
29. Gorlov IP, Moore JH, Peng B, Jin JL, Gorlova OY, Amos CI SNP characteristics predict replication suc-cess in association studies. Hum Genet. 2014; 133: 1477–1486. https://doi.org/10.1007/s00439-014-1493-6PMID:25273843
30. Frisell T, Saevarsdottir S, Askling J Does a family history of RA influence the clinical presentation and treatment response in RA? Ann Rheum Dis. 2016; 75: 1120–1125.https://doi.org/10.1136/ annrheumdis-2015-207670PMID:26091906
31. Umicevic Mirkov M, Janss L, Vermeulen SH, van de Laar MA, van Riel PL, Guchelaar HJ, et al. Estima-tion of heritability of different outcomes for genetic studies of TNFi response in patients with rheumatoid arthritis. Ann Rheum Dis. 2015; 74: 2183–2187.https://doi.org/10.1136/annrheumdis-2014-205541
32. Standish KA, Huang CC, Curran ME, Schork NJ Comprehensive analysis of treatment response pheno-types in rheumatoid arthritis for pharmacogenetic studies. Arthritis Res Ther. 2017; 19: 90.https://doi. org/10.1186/s13075-017-1299-8PMID:28494788
33. Jiang X, Askling J, Saevarsdottir S, Padyukov L, Alfredsson L, Viatte S, et al. A genetic risk score com-posed of rheumatoid arthritis risk alleles, HLA-DRB1 haplotypes, and response to TNFi therapy— results from a Swedish cohort study. Arthritis Res Ther. 2016; 18: 288. https://doi.org/10.1186/s13075-016-1174-zPMID:27912794