Spectroscopic estimation of plasma parameters, in the 100-400 ns stage, of a
laser-induced plasma in vacuum
A. Alonso-Medina
ABSTRACT
This work is focused on the interpretation of the emission spectra in laser-induced plasma observed in the phase at 100-400 ns from after the laser pulse, when the discrete emission lines prevail on the continuum emission, can be important to retrieve the initial stage of expansion. A Q-switched neodymium-doped yttrium aluminum garnet laser has been used for the ablation of a lead sample in vacuum. The observed line profiles, corresponding to different species of lead, were analyzed in terms of delay time. Measurements of parameters of the produced plasmas are performed. The results obtained corroborate the importance of considering nonequilibrium effects in the initial stage of plasma expansion. Also, Stark width for two spectral lines of triply ionized lead is given.
Introduction
The optical emission spectroscopy (OES) of laser-induced plasma (LIP) has become a powerful tool for the fundamen-tal studies of laser-material interaction, resulting to be is of paramount importance to investigate laser-produced plas-mas, providing to information about the plasma state gener-ated, and also in view of its usefulness in many practical applications both in material science as in analytical spec-troscopy. LIP industrial applications require a parallel inves-tigation of the formed plasma from a fundamental point of
view; see for example a work recent by this author'1'
method applied to the treated material in Laser Shock Processing (LSP) processes. While the generation of LIP requires an easy experimental set-up, the LIP phenomena need a lot of theoretical and experimental work to be under-stood, especially in the initial stage. [2~41 Also, a great effort
has been made to be understood the LIP at delays after the laser pulse of the microsecond order, where atomic and ionic lines can be detected unambiguously, a choice that is essentially due to compliance with local thermodynamic equilibrium (LTE), an essential condition for interpreting the results. LIP is generated by irradiating samples with irradiance high enough to exceed the breakdown threshold of the examined material. By the interaction of high power laser with matter, the vaporization of surface layers leads to the formation of an expanding atomic plasma. In LIP, all the energy is delivered during the laser pulse and the plasma generated evolves for a few microseconds. The dynamics may be very different, under different experimental condi-tions, observing on succession of prevailing species from ions to atoms and from atoms to molecules. LIP changes its
parameters of plasma fast during its evolution, decreases, the temperature decreases inducing recombination and decreas-ing the number of charged particles in the plasma.2,31 The dynamics of the LIP strongly depends on the characteristics of the external environment in which the LIP is expand-ing. ' To generalize the characteristics of the LIP, it is necessary to specify the experimental conditions. ~4' From
the experimental point of view, LIP has proved to be a valu-able and versatile source of spectroscopic data on neutral and ionized species as has been shown, recently, by this author in.[5~8]
appear, being very interesting from the spectroscopic point of view.
The evolution and the character of the spectral lines of Pb I, Pb II, Pb III, and Pb IV were analyzed in terms of delay time, through the analysis of spectra obtained experi-mentally, as well as the lead plasma temperature and elec-tron density. It is well known that the optical emission of LIP allows the estimation of plasma parameters such as elec-tron temperature, Te, electron number density, Ne, plasma expansion rate, and plasma composition. We do not forget that LIP, being an expanding plasma, changes its parameters fast during its evolution. Also due to developments in the physical and chemical processes occurring in the LIP, issu-ing this varies primarily with time, the temporal evolution of plasma is characterized by the transition through different stages and can be related to the changes of plasma number density (decreasing during the life of the plasma). To verify all the mentioned is as well part of the motivation of the present work.
The main mechanisms responsible for the plasma obtained are the same occurring during ablation in any environment. The nature of ambient gas has a strong influ-ence on the properties of laser-induced ablation plumes. It is important to note that the differences between formation in one environment, or another are related to the plasma confinement. Plasma expansion into vacuum is a subject of great interest for many applications ranging from ultra-cold plasmas,'91 over laser acceleration,'101 to short-wavelength light sources,'111 in obtaining different data on parameter for atomic structure studies.'7,8,121
To carry out the characterization of LIPs, Te and Ne are very important parameters, being necessary requirement for the understanding of processes in the plasma, the problem is how to determine them. One approach to the measure-ment of both Te and Ne is the observation of line spectra. Te and Ne are diagnostic indicators because one can predict from these two parameters the thermodynamic equilibrium existing in this plasma. There are many works in the litera-ture where researchers use commonly use the line broaden-ing method and the Boltzmann plot method to determine the electron number density and the electron temperature, see for example some of the works by this author,'6~8,13~151
that is, the classical approach based on the existence of LTE conditions and of optically thin plasma. However, this method can be only used in the case of the continuous spec-trum is very weak relative to the characteristic lines and the emission spectrum without obvious self-absorption. In the LIP technique, the existence of LTE is the essential requisite for meaningful application of theoretical Boltzmann-Maxwell and Saha-Eggert expressions that relate fundamental plasma parameters and concentration of spe-cies. A detailed systematic discussion of plasma
characteriza-tion was reported in references.'16~201 For LIPs
characterization one of the utmost important factors is to find out emission lines of interest with good signal-to-noise ratio (S/N) having known spectroscopic constant values.
In the present work, temperature and the electron num-ber density of the lead plasma were determined, in the
different delay time, using the different emission lines, by the Saha-Boltzmann plot method and the line broadening method, respectively, as explained later. Also, study possibil-ity of deviations from equilibrium conditions has been taken into account in the different delays. The knowledge of the deviation from LTE is really important to take it into account in practical applications.
Lead is the heaviest element thus far detected in the interstellar medium. O'Toole, in 2004,'211 identified Pb IV lines in the space telescope ultraviolet spectra of the sdB stars Feige 48 and PG 1219 + 534. The Pb III and Pb IV res-onance lines have been detected in the Far Ultraviolet Spectroscopic Explorer spectra of hot subdwarf B (sdB) stars by Chayer et al.'221 Naslim et al.;'231 they have reported the discovery that two stars, HE 2359-2844 and HE 1256-2738, show an atmospheric abundance of lead which is nearly
10,000 times from seen in the Sun. This is measured from optical Pb IV absorption lines (at 3962.48 A, 4049.8 A, and 4496.1 A, to our knowledge these lines have not been observed in any other astronomical object), never previously seen in any star. According to Naslim et al.,'231 the lead abundance is 10-100 times that measured in normal hot-subdwarf atmospheres from ultraviolet spectroscopy.
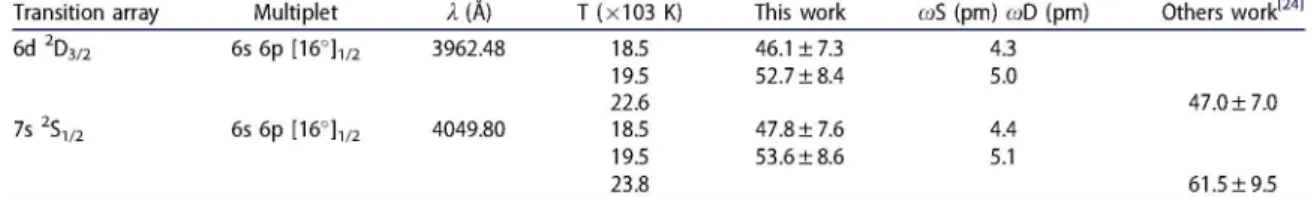
LIPs have been used with extensively as spectroscopic sources for the measurement of Stark widths. The determin-ation of Stark broadening parameters (widths and shifts) of the spectral lines is a vast field of research on account of its considerable interest in applications to astrophysics and in industrial applications. Bukvic et al.'241 presented experimen-tal Stark full-width at half of the maximum line intensity, W, for 34 spectral lines from Pb IV spectra emitted by the pulsed helium discharge. Theoretical calculations of the Stark broadening parameters for 58 lines of Pb IV they have been made using a set of wave-functions obtained from Hartree-Fock relativistic calculations including core-polar-ization effects, Alonso-Medina et al.'251 Later, Hamdi et al.'261 calculated Stark-broadening parameters for 114 spectral lines of triply charged lead ion (Pb IV) using semi-classical perturbation approach in the impact approximation. An aim of this paper is to provide new experimental value of Stark width for spectral lines Pb IV at 3962.48 A and 4049.8 A, with a good agreement with the few experimental values existing in the literature.
Experimental set-up and measurement details
Experimental set-up applied in this work is similar to the LIPs system used in previous papers form Alonso-Medina'5~8,12~15] although the more detailed description is presented in.'7,12,131 The schematic diagram of the experi-mental system is shown in Fig. 1 of the mentioned referen-ces.'5,12,151 A Q-switched laser Nd:YAG (Quantel YG585) (with a 10,640 A wavelength, pulse energy 290 mj, pulse width 7 ns, and repetition rate 20 Hz) is used to produce the laser plasma. The laser energy is measured by a digital energy meter. The laser light was focused at a right angle onto, a spot about 0.5 mm in diameter, in the sample with a
-t
200 nsbl
l
0 . — - _ CO J3 ^ °> — Q- o f " £
p
_
3706.
0
>~
3710.
5
£-3718.3
0
=
728.69
A
CO
W V, = A
<3 o> o en
736
.
37
3
CO
V
Vz
755.
4
A
(
HN/I
v*»~«
APb
l
en
785
.
CO
- ^ V W " * ^ \
3700 3710 3720 3730 3740 3750 3760 3770 3780 3790 3690 3700 3710 3720
Wavelength (A)
(d)
3730 3740 3750 3760 3770 3780 3790 Wavelength (A)
800
700
.c 600 o a c 500
3 0
2- 400
200
o 100 CO Q .
400 ns
a.
<
CO
A
a.
^ f o
8.
3
i~-co
=
£
°5 s ">. S
— xi
a.
< CO o CO CO
3690 3700 3710 3720 3730 3740 3750 3760 3770 3780 3790 3690 3700 3710 3720 Wavelength (A)
3730 3740 3750 3760 3770 3780 3790 Wavelength (A)
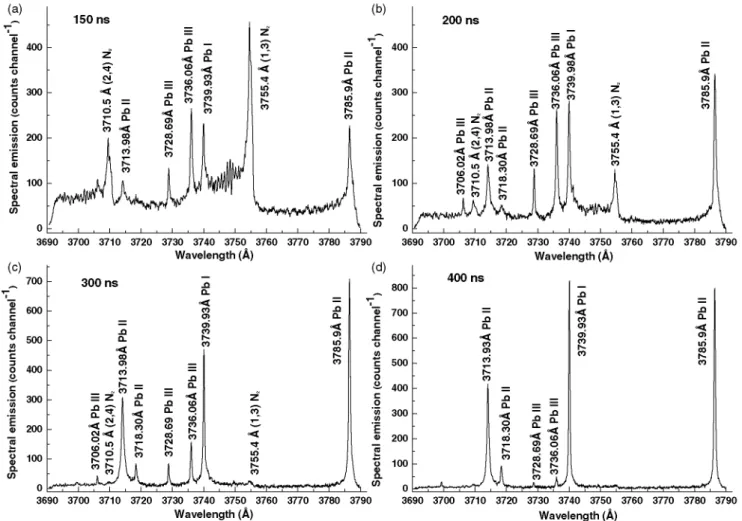
Figure 1. Emission spectrum of laser-induced lead plasma, using thel0,640 A laser, pulse energy 290 mJ, and pulse width 7 ns in vacuum, at different delay times:
150 ns (a), 200 ns (b), 300 ns (c), and 400 ns (d), respectively. Observation of the time evolution of plasma in order to investigate the time evolution of excited plasma species showing predominantly the spectral lines of Pb I, Pb II, and Pb III and two molecular bands of N2 of the spectral region from 3690 to 3790 A.
purity, impurity Ca) was used. The laser irradiance on the blank was 2 x 10¹⁰ Wcm- 2. The target was located inside a chamber, on top of a device capable of moving it horizon-tally with respect to the laser beam, focused in such a way that the plasma was formed in each measurement on the smooth surface of the target and not on the crater formed during the previous measurement, this could influence the intensity of the spectral lines and could lead to the destruc-tion of the sample. The chamber was readied to generate the plasma with the target in vacuum («6.6 Pa).
A 1-m Czerny-Turner spectrometer, range 1900-7000 A, is equipped with a 2400 grooves/mm holographic grating, and a 50-um external slit, equipped with a gated optical multichannel analyzer (OMA III EG&G PARC), which allowed the detection of each spectrum and its digital recording for later numerical analysis. The computer has a card used for communications, through which the commu-nication is made with the central unit OMA. From this, the computer has been programmed the whole process of acqui-sition of data from the OMA and has been received the spectrum, after the end throughout the measurement pro-cess. It has a time resolution, with a minimum duration of the time window of 100-200 ns, and the spectral band detected by the device is about 100 A. This system allowed
recording of spectral regions at different delays after the laser pulse and during a selected time interval. The Pb I, Pb II, Pb III, and Pb IV spectral lines were recorded and vari-ous fragments of molecular bands of N2 and N2 + also appear, at short delays. The spectral lines have been obtained in the wavelength range from 2000 to 7000 A.
measurement was about 3%. More details about the calibra-tion of the system can also be found in previ-ous work.16'12'141
The measurements were repeated at several delay times (in the range of 100-400 ns, delay from the laser pulse) and at a fixed gate time of 100 ns. The analysis of the spectra was made by fitting the observed line, to numerically gener-ated Voigt profiles and, with them, make de-convolution to obtain the Lorentzian and Gaussian profiles, the instrumen-tal profile is convoluted into the resulting profile. The instrumental profile needed for the numerical analysis of each spectrum was determined from the observation of sev-eral narrow spectral lines emitted by a hollow-cathode lamp.
This instrumental profile (Alinstrumentai) has been
Voigt profile full width of half maximum (FWHM) = 0.30 A, (Gaussian FWHM = 0.19 A, and Lorentzian FWHM
= 0.17 A. for a wavelength of 3900 A). Each spectrum is the average of five spectra at five different positions on the tar-get little differences were observed between the five collected spectra, so an error of 5%.
To fit the emission line profiles in the analysis and obtain relative intensity and the FWHM, a software tool has been used that is able to numerically generate Voigt profiles, the convolution of the Lorentzian profile from the Stark broad-ening with the Gaussian profile from Doppler and instru-mental broadening, by an analytical function. For the diagnostic of the plasma, the area under each line profile from the aforementioned fitting represents the relative intensity. The line intensities were obtained by subtracting the background intensity. The investigated spectral lines, in this work, were well isolated from other spectral lines emit-ted by this plasma. We have obtained a good reproducibility («3%) of the investigated spectral line radiation intensities.
To study the homogeneity of the plasma, the same experimental system was used, but in order to have spatial resolution, the light was focused by means of a lens on a 1 mm light guide being able to select the point of the plasma from which the light emission was observed. The lens and optical fiber connector have been mounted on a telescopic spring that allows one to vary their relative distance to coin-cide with the focus distance of the image of the plasma. The support was mounted on an optical bench, allowing move-ment horizontally and vertically in a controlled manner, thereby varying the area of plasma whose image is detected in the optical fiber. The measurement was taken by scanning the plasma emission in two perpendicular directions; through the axis of the plasma with a distance from the blank in the 0.2-2.7 mm range to study the evolution of the plasma in space, and parallel to the surface of the target with a radial distance in the range of 0-1.1 mm, to deter-mine where the different lead atomic species are located in the plasma and to determine the real values of the parame-ters of the plasma (intensities, widths of spectral lines, tem-perature and electron number density), more details about this procedure can be found in references.'6'13'141 It is well known that from the experimental point of view, space resolved characterizations are difficult due to the small size of laser-induced plasmas and thein fast expansion dynamics.
Local profiles were obtained after Abel inversion of the inte-grated intensity.'18'191
The high density of particles forming the plasma is not always an advantage because if transitions are studied whose lower level has a high population density, the spectral lines observed may have self-absorption, it is a priority to verify whether in line the self-absorption is present. Estimation of the absorption coefficient of all the lines studied will be shown in a later discussion.
Results and discussion
In this work, all experiments were carried out using a 7-ns laser pulse from an Nd:YAG, already mentioned, which has always been focused on the same lead target (99.99% Pb and 0.01% Ca) in vacuum, and the accumulation of 15 laser pulses in each delay time. Use of pulses multiple and the variables of laser used in this work, as well as the environ-ment («6.6 Pa vacuum), induce deep modifications in the plasma dynamics and, consequently, in the emission. How is it known, when a laser beam is focused on a solid, the tem-perature of the locally heated region grows rapidly up to the threshold of vaporization and, if the laser power density exceeds a certain critical value that it depends on the test sample, it triggers a chain of ionization phenomenon, the breakdown, which involves the formation of a plasma. This plasma is formed from excited atoms, ions, electrons, and fragments of molecules, as will see in this work.
LIP is a dynamic system in which all the energy is deliv-ered by the laser pulse and then the system evolves spontan-eously before reaching equilibrium with the surrounding environment. Adiabatic expansion of the plasma in three dimensions occurs after termination of the laser pulse this is a conversion of thermal energy into kinetic energy of ele-ments in the plasma. The process is accompanied by a det-onation due to the shockwave caused by rapid heating of the ambient surrounding, there being some controversy on the mechanisms leading to excitation and ionization of the ambient during laser plasma generation.'271 Subsequently, the plasma tends to cool, they are listed the spectra line emission characteristics of transition between bound states, already present in the first instants of the plasma formation, but not observable, by continuous radiation that can be related to the changes of plasma number density.'27,281 To understand the detailed aspects of laser beam interaction with the target material and recombination processes follow-ing the laser ablation, the time-resolved studies of the emis-sion spectra from the plasma offer convenient approach. Spectra emitted by the excited species, neutrals, and ions, and molecules are used to develop quantitative and qualita-tive analytical information.
changes are displayed by different spectroscopic peculiarities. For each spectral interval considered and at each instant of the plasma life, the optical emission was detected and ana-lyzed. In order to investigate the time evolution of excited plasma species, we have recorded spectra in the 2000-7000 A range.
Plasma emission and spectral line analysis
By the analysis of the spectrum, we can see that at the early stages of plasma evolution (first nanoseconds after the laser pulse, <C 100 ns), the amount of energy radiated in form of the continuous spectrum is far greater than the energy radi-ated by the line spectrum, that is to say, the continuum emission, that dominates over lines emission, is high due to mechanisms involving free electrons, inverse Bremsstrahlung, radiative recombination, and photoioniza-tion. In general continuum radiative is due to two processes: Bremsstrahlung and radiative recombination, for the most of the time the continuum emission is detectable, it is the result radiative recombination. The plasma is mainly consti-tuted of ions, atoms, and electrons. The Bremsstrahlung pro-cess in plasmas is due to the deceleration of electrons as they pass close to ions. The electron kinetic energy is mainly given by the absorption of laser photons through the inverse Bremsstrahlung mechanism. Adiabatic expansion of the plasma plume occurs after termination of the laser pulse, this is a conversion of thermal energy into kinetic energy of elements the in plasma plume. In general, continuum radia-tive is due to two processes: Bremsstrahlung and radiaradia-tive recombination, and that for the most of the time in that the continuum emission is detectable, it is the result radiative recombination, see the detailed study in de Giacomo and Hermann'21 and de Giacomo et al.'291
So, we cannot obtain accurate information about atoms, ions, and fragments of molecules because of the overwhelm-ing continuum emission for short delay times («100-150ns). The presence of molecular species in the plasma critically depends on the dissociation energy that is the minimum energy to be delivered to separate both atoms from the ground state of the molecule.'21 At these early times, the electron density is very high and spectral lines of the different species (in this work, atom, and ions of lead) are broadened by the Stark effect due to the electron colli-sions. The density of the plasma is close to that of the irra-diated target. At longer times of the plasma expansion, the spectral lines become narrower, indicating a decrease of the electron density. Discrete emission lines are detectable only after a certain delay time from the laser pulse. The tempera-ture decreases rapidly with plasma expansion, inducing recombination and decreasing the number of heavy particles (atoms, ions, and molecules). The peak widths and profiles in lines spectra are primarily dictated by the temperature and electron density of plasma. It is well known that one approach to the measurement of both electron density and electron temperature is the observation of line and con-tinuum emission intensity, the line to concon-tinuum ratio method. In this method, the ratio of the emission intensity
of an atomic line to the emission intensity of the spectrally adjacent continuum, is indicative of electron temperature, while the absolute intensity of the continuum is indicative of the electron density. Although it is also well known that one of the problems encountered with continuum emission measurements of plasmas is that the spectral observation region should not contain any atomic, ionic, or molecular emission, see for more detail in Bastiaans and Mangold.'301
Under the conditions considered in this work, the emis-sion spectrum of the lead plasma, in vacuum, consist mainly emission lines of Pb I, Pb II, Pb III, Pb IV, and also frag-ments of molecules the N2 (second positive system, C3 n+ u and B3 n+ g, electronic states at 11.1 eV and 7.39 eV, respect-ively) and N2 + (first negative system, B2J^+U and X2^g +, electronic states at 18.7 eV and 15.6 eV, respectively) sys-tems, corresponds to radiative transitions between covering the spectral range of 2000-7000 A, ambient nitrogen mole-cules. Also, some spectral lines of Ca II appear since the cal-cium is an impurity in the sample. Have been observed at different delay times (100-9000 ns), after the laser pulse, and
are displayed for several spectral ranges in Figures 1-5
(where is appreciated in detail how the plasma evolution). From the observation of the figures, it is possible to check that in at early delay times there is continuum radiation high, then appear more ionic lines (they have higher ioniza-tion energy than atomic ones), and also some atomic lines appear, that subsequently to at longer delay times also become more evident. As we have already mentioned above, in order to extract useful spectroscopic information from plasma, one needs to understand how the shapes of spectral lines evolve with time. In this work, when LTE conditions can be applied, the population of the linked states follow a Boltzmann-Maxwell distribution can be used as a first approximation to determine the temperature and electron number density of the plasma in the different delay times.{ie-20]
Figures 1-4 gives an overview of the plasma evolution. In
150 ns (b) 600
-"
-200 ns
z (O'O
)
^, ^,
0) CO
lllli.
lift/
= .o a oi m oi
1
I
W J W ^ W v v ' S>
SI
a.
962.
4
CO
«^W#«»vwSyW^Mrt>«**VVfc
3900 3910 3920 3930 3940 3950 3960 3970 3980 3990 Wavelength (A)
so I- 300 n s (d)
50
40
\^\K>¥mJ \fa<mh*^
HI
a. in
30
3890 3900 3910 3920 3930 3940 3950 3960 3970 3980 3990 4000
Wavelength (A)
400 ns
3900 3910 3920 3930 3940 3950 3960 3970 3980 3990 3900 3910 3920 3930 3940 3950 3960 3970 3980 3990
Wavelength (A) Wavelength (A)
Figure 2. Emission spectrum of laser-induced lead plasma, using thel0,640 A laser, pulse energy 290 mJ, and pulse width 7 ns in vacuum, at different delay times:
150 ns (a), 200 ns (b), 300 ns (c), and 400 ns (d), respectively. Observation of the time evolution of plasma in order to investigate the time evolution of excited plasma species showing predominantly the spectral lines of Pb III and Pb IV and band fragment of N2 + (0,0) of the spectral region from 3895 to 3995 A.
of possible self-absorption (although there is nothing to dis-tinguish a line, which is only moderately absorbed, from one line free from absorption; it is well known that self-absorption will have the effect of distorting and especially of broadening lines and will, therefore, produce an apparently large width) superposed on the continuous signal. We observe that continuum emission have intensity ^70 counts channel-1 as we have already mentioned, in front of the spectral lines that appear, see example the line more intense that it appears is 3736.06 A of Pb III with intensity <190 counts channel-1. Interference of molecular bands with spectral lines may prevent accurate line intensity measure-ments. Line 3739.93 A of Pb I has large upper state excited
energy, Ei = 5.974 eV (48,188.67 cm- 1), 9.163 eV
(73,901cm-1) ionization limit, that will experience a sharp decrease in population as the plasma cools, emerges over the band fragment of N2 (1,3), being difficult to measure.
Figure 1(b) shows the emission spectra obtained at 200 ns after the laser pulse; it is observed that continuous emission decreases, pass to intensity ^35 counts channel-1, in front of the spectral lines that appear. The two molecular bands of N2 decreases and that all the spectral lines increase in intensity. Also, it is observed that the spectral line 3706.02 A (6s (2S) 8s 3S ^ 6 s (2S) 7p 3P0) of Pb III and the spectral line 3718.03 A (6s2 (XS) 9s 2S1 / 2^ 6s2 (XS) 7p 2P1/2) of Pb II.
Figure 1(c), shows the emission spectra obtained at 300 ns after the laser pulse; it is observed that continuum emission decreases, pass to ^10 counts channel-1, in front of the spectral lines that appear, that is to say, the line profile becomes narrower with time. The two molecular bands of N2 they have practically disappeared, see example the N2 (1,3) emission (at 3755.4 A head of band 13 counts channel-1), on the continuum. Also, all the spectral lines of Pb III decrease in intensity, conversely the line intensities of
Pb I and Pb II increase. Figure 1(d) shows the spectra
obtained at 400 ns after the laser pulse; we observed that
continuum emission decreases, ^ 8 counts channel-1, in
front of the spectral lines that appear. The two molecular bands of N2 they have disappeared, the lines of Pb III con-tinue to decrease and those lines of Pb I to Pb II increase in intensity are thin and well resolved strong and sharp. Therefore, it is noticed that the continuous signal is weaken-ing quickly accordweaken-ing to the plasma and gettweaken-ing colder, on the contrary, the peaks of lines persist for longer times.
Q.
2800
2400
2000
1600
1200
800
400
0
150 ns
z
>«
-23
6
24
2
" •
-^! V 7 i i , i « 01
< j
42
4
VAJIAIJI
I , i
Q.
ID ID CM
s
Ml
i +
z !—
CO
v. 1 , 1
(b)
<u c re c Cfl
oun
t
*-*
sio
n
.2
fe
ctr
a
Q.
T - - i
12000 10000
4000 2000
Wavelength (A)
300 ns
a.
4210 4220 4230 4240 4250 4260 4270
Wavelength (A)
„ 5000
3000
200 ns
2000 1000
4210 4220 4230 4240 4250 4260 4270 4280 4290 4300 4210 4220 4230 4240 4250 4260 4270 4280 4290 4300
(d)
HI
Q.
in 16000
12000
8000
4000
0
400 ns
I . I . I
Wavelength (A)
1
4
P
b
I
I
I
9
2
P
b
I
I
424
4
l
,
6
Pbll
l
ID
i . i . i . i
4280 4290 4300 4210 4220 4230 4240 4250 4260 Wavelength (A)
4270 4280 4290 4300
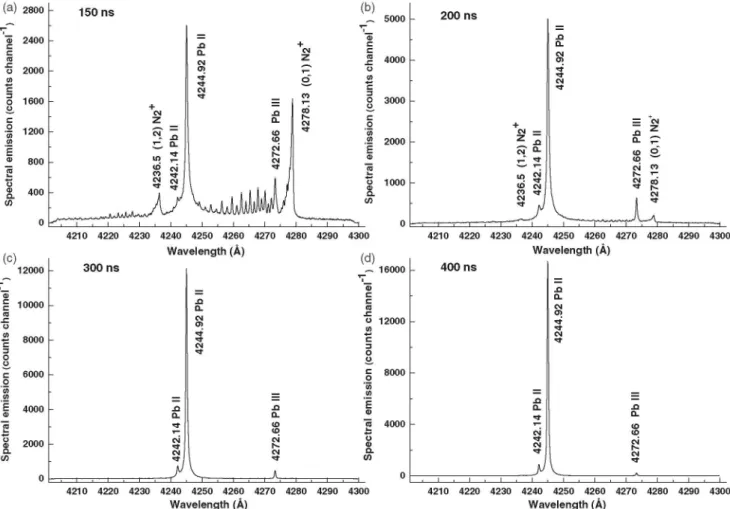
Figure 3. Emission spectrum of laser-induced lead plasma, using thel0,640 A laser, pulse energy 290 mJ, and pulse width 7 ns in vacuum, at different delay times: 150 ns (a), 200 ns (b), 300 ns (c), and 400 ns (d), respectively. Observation of the time evolution of plasma in order to investigate the time evolution of excited plasma species showing predominantly the spectral lines of Pb II and Pb III and band fragment of N2 + (1,2) and of N2 + (0,1) of the spectral region from 4200 to 4300 A.
spectral line of Pb III, the line 3951.92 A (6s (2S) 7p ^ - ^ s (2S) 6d XD2) and spectral line of Pb IV, the line 3962.48 A (5d9 6s 6p [16°]1/2^5d10 (1S) 6d 2D3/2), From the observa-tion of the figure, it is possible to see that ionic line Pb IV is evident. Observing this line is important since it allows us to measure its Stark width, also observed excited N2+molecules, watch (0,0) band head intensity of N2 + at 3914.4 A head of band, intensity ^1095 counts channel-1.
Figure 2(b) shows the spectra obtained at 200 ns after the laser pulse; it is observed that the emission of the con-tinuum, the intensity of the molecular band of N2 + decreas-ing, and the line of Pb IV also. Figure 2(c,d) shows the emission spectra obtained at 300 ns and 400 ns after the laser pulse, respectively. The molecular band of N2 + continues to decrease (intensities ^80 counts channel-1 and ^25 counts channel-1, respectively), that the spectral line 3951.92 A of Pb III, at 400 ns after the laser pulse, and the spectral line 3962.48 A of Pb IV they have disappeared and that the res-onant lines of Ca II (impurities) begin to appear.
In Figure 3, the emission spectrum of lead plasma are displayed for the spectral range of 4200-4300 A, obtained at four different delay times (150 ns (a), 200 ns (b), 300 ns (c), and 400 ns (d), respectively). Figure 3(a) shows the emission spectra obtained at 150 ns after the laser pulse, continuum radiation (intensity ^50 counts channel-1), it is observed a
two spectral lines of Pb II, the line 4242.14 A (6s2 (JS) 5f 2F5 / 2^ 6s2 (JS) 6d 2D5/2) and the line 4244.92 A (6s2 (JS) 5f 2F7 / 2^ 6s2 CS) 6d 2D5/2) and an spectral line of Pb III, the line 4272.66 A (6s (2S) 7p ^ - ^ s (2S) 7s X ) , also observed
two molecular band of N2 +, the N2 + (1,2) emission,
4236.5 A, head of band 366 counts channel-1, and the N2 + (0,1) emission (at 4278.13 A, head band 1624 counts channel-1). Figure 3(b) shows the emission spectra obtained at 200 ns after the laser pulse, it is observed that the molecu-lar bands decrease in intensity while the intensities the lines of Pb II and Pb III grow. Figure 3(c,d) shows the emission spectra obtained at 300 ns and 400 ns after the laser pulse, respectively, it is observed that the intensities of the lines of Pb II continue to grow while the line 4272.66 A of Pb III is decreasing.
In Figure 4, the emission spectrum of lead plasma are displayed for the spectral range of 2390-2490 A, obtained at four different delay times (150 ns (a), 200 ns (b), 300 ns (c), and 400 ns (d), respectively). Figure 4(a) shows the spectra obtained at 150 ns after the laser pulse, it is observed a strong continuum emission that persists to 300 ns where sev-eral lines of Pb I begin to appear with little intensity, the line 2401.94 A (6s2 6p (2P1/2) 7s ^ - ^ 6p2 3Pi) and the line 2476.77 A (6s2 6p (2P1/2) 8s 3P ^ 6p2 3Pi), see Figure 4(b).
(a) (b)
~
= 40
o
£
| 3 0
8
c
% 20 0)
1
a> | 10 o a>St
0 150 ns111 i i L n 111 o •< o CO cd i-. CM
ii J, I 1.1 I l k 11, l l W i l l i J
iUiiiyviif H
i i i i i i i i i i i i i i 1 •S 50
c
£ » 40 2 c
3 0 2 . 3 0 c o 5) CO •= 20 a> 75 *-O 10 a> a. in 0 300 ns ^ .Q a .< >* en ^ o CM II , Ik i l l i
'[MM
WWm W H,11f""!W,Pl,ff _ I I i l l , ill I, 1 1 , 1 "<n,
XI a. •< o ^ cd I-. * CM
i . ' ' •' V'r™i
^ o o CO cd I-. ^ CM ll I I I 111 II
l i l t t
"ffllfl
2385 2400 2415
(c) r~8o a>
I
70 _C » 60 c 0 50 o w = 40 "fit| 3 0
a> •5 20
4 - > O a> 10 Q. CO 0 400 ns - si a. ° < XJ
- en a
- s a
CM T
-:
M
CM
I ' I
2430 2445 2460 Wavelength (A) si Q. •< 00 cb CM
1 1 1 1 1 1
2475 2490
Si a. •< 0 * cd * CM O O (0 06 I-. ^ CM
1 1 1 1
2385 2400 2415 2430 2445 2460 2475 2490
(d) ,.—160
•
a>
c1 4 0
ra
s:
" 1 2 0 co 4-1 = 100 o o, C 80 o 5) .<2 60 E o o a> 20 Q. CO
W a v e l e n g t h (A)
600 ns
si
a. —
O) Q. ^ • < S5 "*
N o
si
_a.
00 • * pjCM
I I II
2385 2400 2415 2430 2445 o 2460
W a v e l e n g t h (A)
2475 2490 2385 2400 2415 2430 2445 ^ 2460
W a v e l e n g t h (A)
2475 2490
Figure 4 . Emission spectrum o f laser-induced lead plasma, using t h e l 0 , 6 4 0 A laser, pulse energy 290 mJ, a n d pulse w i d t h 7 ns in v a c u u m , at different delay times: 150 ns (a), 200 ns (b), 300 ns (c), a n d 400 ns (d), respectively. Observation o f t h e t i m e evolution o f plasma in order t o investigate t h e t i m e evolution o f excited
plasma species s h o w i n g p r e d o m i n a n t l y t h e spectral lines o f Pb I o f the spectral region f r o m 2390 t o 2490 A.
4(d), at 600 ns after the laser pulse, it is observed that spec-tral lines of Pb I, the line 2393.79 A (6s2 6p (2P1/2) 7d 3F3^ 6p2 3P2), the line 2401.94 A (6s2 6p (2P1/2) 7s ^ - ^ 6p2 ^ O , the line 2443.82 A (6s2 6p (2P1/2) 8s 3P0^ 6p2 3P2), the line 2446.18 A (6s2 6p (2P1/2) 8s 3 P ^ 6p2 3Pi), and the line 2476.77 A (6s2 6p (2P1/2) 8s 3 P ^ 6p2 3Pi) with low inten-sities due to poor spectral response of the experimental sys-tem used, in that spectral region.
It is noticed that the amount of energy radiated in form of the continuum emission is far greater than the energy radiated by the atomic/ionic spectral lines, at these short delay times and that during the expansion the energy emit-ted by the continuum gradually decreases. Ionic lines appear first, Pb III, and Pb IV because they have higher ionization energy. The intensity of the molecular bands decreases, and the intensities of the atomic/ionic lines present increase. Being the Pb III and Pb IV emission persistence the shortest
among the atomic/ionic species. In Figures 1-4, it is
observed that for short delay times (150-300 ns) as a conse-quence of the limitation in number of excited levels due to the high density effect, the population of the low energy lev-els is overestimated in comparison to that of the high energy levels along the optical path during the detection time, it is well known that after the pulse laser, the LIP is in
recombination stage.'3'27'291 It is also possible to observe that during the expansion, when the electron number dens-ity decreases, emission lines stark rise up from the con-tinuum radiation spectrum while the concon-tinuum exponentially decreases and that more lines appear. It is noticed that the lines obtained of neutral lead atoms are thin and well resolved strong and sharp, whereas those of the singly ionized lead ions are broad and variable-lived. It is noticed that the maximum intensity of the spectral lines is reached after a characteristic time, depending on the species and that the intensities of lines are decreasing at longer times after the pulse laser.
,_
o
c
c
ro
o
<n
4-1
c
3
O
o_
c
o
V)E
Q)
re
i_()
0)
a
EA)
120 100 80 60 40 20 0
140 120 100 80 BO 40 20 0
250 200 160 100 50 0
.a
a.
01
ui
i I i I i I i I i 1 _
3700 3710 3720 3730 3740 3750 3760 3770 3780 3790
CO 10 01
I 1 I 1 I 1_ Iw W * 4
_1_ I I I
3900 3910 3920 3930 3940 3950 3960 3970 3980 3990
4210
k
CO C\l
4220 4230 4240 4250
U<iM
4260
i*f*
4270
~*J\ ».*h>-4JHWlM *»*••*•
4280 4290 4300
Wavelength (A)
Figure 5. Emission spectrum of laser-induced lead plasma, using the10,640 A laser, pulse energy 290 mJ, and pulse width 7 ns in vacuum. Shown of typical spec-trum of lead plasma, obtained at 9000 ns delay time covering the spectral regions (a) of 3690-3790 A, (b) of 3895-3995 A, and (c) of 4200-4300 A. Observation of the time evolution of plasma in order to investigate the time evolution of excited plasma species.
lasting up to 9000 ns after laser pulse, where the plasma is already colder. In Figure 5, it is shown that the emission spectrum of lead plasma obtained at 9000 ns delay time cov-ering the spectral regions (a) of 3690-3790 A, (b) of 3895-3995 A, and (c) of 4200-4300 A. The line 3739.93 A of Pb I that begins to appear above continuum emission from 100 ns time delay and it lasts until 9000 ns and the two molecular bands of N2 not observed, seen in Figure 5(a). In
Figure 5(b,c), the two molecular bands of N2 + if they observed with low intensity if along with the resonant lines of Ca I and Ca II (calcium is an impurity of the sample used). The resonant lines of Ca II appear at 400 ns of delay (with very little intensity) and remain until the 9000 ns of delay while the line 4226.7 A of Ca I that appears from 800 ns remains until 9000 ns of delay, see Figure 5. The presence of impurities will influence the accuracy the measured tempera-ture in the corresponding delay times; this has not been the subject of study in this work. The spectral lines of Pb II reach their maximum intensity at 400 ns, disappearing at 2500 ns. It is importantly noticed that alone some lines of Pb I and Pb II lasts until 9000 ns. In 9000 ns after the laser pulse, the already colder plasma, the lines of the different species have large upper state excited energies that will experience a sharp decrease in population as the plasma cools. The observation of the two molecular bands of N2 +, with low intensity, nei-ther was not the subject of study in this work.
There are authors130311 who say that, for plasma to reach LTE, there is an important requirement, where atoms in the plasma only exist in significant populations for two
successive stages of ionization. In the spectra obtained in this work, see Figure 1(a) at 150 ns from the laser pulse, sev-eral spectral lines of Pb I, Pb II, and Pb III appear and in
Figure 2(a) also spectral lines of Pb III and Pb IV. This requirement is met from 400 ns after the laser pulse where there are only lines of Pb I and Pb II, we will analyze and study all these later. The lines ions or atomic are mainly emitted from the hot plasma core, while molecular band emission originates from the cold plasma periphery, where the atomic emission is reabsorbed. There are sev-eral studies on the formation of molecules in laser plasma,
see the previous works, 7,32~341 for example; and,
recently,51 studies suggested that a strong influence of chemical reactions on the angular distribution of species within the ablation plume and that in his analyses indicate that chemical reactions occur mostly in the plasma periph-ery where the temperature is low. J Harilal et al. com-ment that the generation of molecular excitation and
emission (N2, N2 +) occur through various mechanisms,
being one possible mechanism the heating of the ambient gas and corresponding excitation of molecular species by the shock wave propagating outward from the laser breakdown. Other mechanism is excitation of the surrounding medium via UV radiation produced by the spark. Also, it is assumed to be formed these molecules during spark cooling. Studies are beyond the scope of this work.
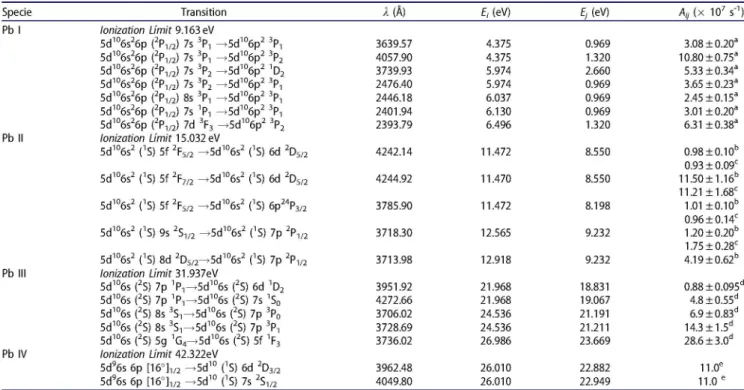
Table 1. Spectral lines parameters of Pb I, Pb II, Pb III, and Pb IV used in the determination of the excitation temperature including wavelengths. Specie
Pb I
Pb II
Pb III
Pb IV
Transition Ionization Limit 9.163eV
5d106s26p (2P1/2) 7s 3Pn -^5d1 06p2 3Pn 5d106s26p (2P1/2) 7s 3Pn ^ 5 d1 06 p2 3P2 5d106s26p (2P1/2) 7s 3P2 ^ 5 d1 06 p2 nD2 5d106s26p (2P1/2) 7s 3P2 ^ 5 d1 06 p2 3P-, 5d106s26p (2P1/2) 8s 3Pn -^5d1 06p2 3Pn 5d106s26p (2P1/2) 7s Y-, ^ 5 d1 06 p2 3Pn 5d106s26p (2P1/2) 7d 3F3 ^ 5 d1 06 p2 3P2 Ionization Limit 15.032 eV
5d106s2 CS) 5f 2F5/2 ^ 5 d1 06 s2 CS) 6d : 5d106s2 CS) 5f 2F7/2 ^ 5 d1 06 s2 CS) 6d :
2D5/2
2D5/2
5d106s2 CS) 5f 2F5/2 ^ 5 d1 06 s2 CS) 6p24P3/2 5d106s2 CS) 9s 2S1/2 ^5d1 06s2 ^S) 7p 5d106s2 CS) 8d 2D5 / 2^5d1 06s2 CS) 7p Ionization Limit 31.937eV
5d106s (2S) 7p ^ - ^ d ^ s (2S) 6d nD2 5d106s (2S) 7p ^ - ^ c f ^ s (2S) 7s 'So 5d106s (2S) 8s 3S1^5d1 06s (2S) 7p 3P0 5d106s (2S) 8s 3S1^5d1 06s (2S) 7p 3Pn 5d106s (2S) 5g 1G4^5d1 06s (2S) 5f nF3 Ionization Limit 42.322eV
5d96s 6p [16°]1/2 -^5d1 0 CS) 6d 2D3 / 2 5d96s 6p [16°]1/2 -^5d1 0 CS) 7s 2S1/2
2P M/2 Pl/2
1(A) 3639.57 4057.90 3739.93 2476.40 2446.18 2401.94 2393.79 4242.14 4244.92 3785.90 3718.30 3713.98 3951.92 4272.66 3706.02 3728.69 3736.02 3962.48 4049.80
£, (eV) 4.375 4.375 5.974 5.974 6.037 6.130 6.496 11.472 11.470 11.472 12.565 12.918 21.968 21.968 24.536 24.536 26.986 26.010 26.010
Ej (eV)
0.969 1.320 2.660 0.969 0.969 0.969 1.320 8.550 8.550 8.198 9.232 9.232 18.831 19.067 21.191 21.211 23.669 22.882 22.949
Aijix lO's"1)
3.08±0.20a 10.80±0.75a 5.33±0.34a 3.65±0.23a 2.45 ± 0.15a 3.01±0.20a 6.31±0.38a 0.98 ± 0.10" 0.93 ± 0.09" 11.50 ±1.16" 11.21 ±1.68" 1.01 ± 0.10" 0.96 ±0.14" 1.20±0.20b 1.75 ± 0.28" 4.19 ±0.62" 0.88±0.095d
4.8±0.55d 6.9 ± 0.83d 14.3±1.5d 28.6±3.0d 11.0e 11.0 e Kramida et al. NIST database,1431 lower (Ej) and upper (£/') energy levels, Moore,1421 and transition
from: (a) Alonso-Medina et al.,1131 (b) Alonso-Medina,1401 (c) Alonso-Medina,1391 (d) Alonso-Medina,
probability (Aif). All transition probabilities are collected 151 and (e) Alonso-Medina et al.1411.
been measured at said delay times. The line profile becomes narrower with time and, that from 300 to 400 ns following the laser pulse, the emission lines show the excited level population in a Boltzmann form, in agreement with about the LTE.
The molecules can be used to obtain electron temperature and electron number density of the plasmas at delay times of 100-200 ns, the first negative system of N2 + and second positive system of N2 considerably dominate the spectrum from 3300 to 4800 A, and there is extensive literature on its molecular parameters, has not been the aim of this work. In this work, we use lead spectral lines since the molecules are in the periphery of the plasma and would not be suitable for the characterization of the nucleus of the lead plasma. The presence of molecular species in the plasma depends on many factors as we have commented previously.
The self-absorption phenomenon can affect a emission lines in a spectrum and is larger around the peak of the emission the line intensity at the peak decreases while the full width at half maximum (FWHM) increases. A suitable choice of some spectral lines that are free from self-absorp-tion they allow us the calculaself-absorp-tion of both temperature and density of the plasma. The effect of self-absorption depends on the population of the lower level of the transition and therefore is in general particularly evident for lines emitted by the major elements in the plasma and for transition end-ing at the fundamental level. Self-absorption occurs when the outermost cold layers of the plasma absorb part of the radiation emitted by the innermost layers and its effect is accentuated, as we have indicated, in the resonant transi-tions of atoms and ions. A way to verify that the lines used are not self-absorbed is to choose lines that do not end at the fundamental level, since if you study transitions whose
lower level has a high population density, the observed lines can present self-absorption. All spectral lines used in this study have high energies in the excited upper level; values are presented in Table 1.
Another way to verify is, for example, using two emission lines from a species that have the same level of higher energy and check that the ratio of their intensities does not change, in the different time delays, and be the same as the ratio of the corresponding transition probabilities. That is the known method, two-line method, of checking line inten-sity ratios within multiplets which are expected to adhere to LS-coupling.[361 Technique is straight forward, very simple to apply, but it can be used only as an indicator whether self-absorption is present. This has been check in all possible cases, in this work, see as an example: (i) 13739.93 A pbi/ l2476.4oApbi=l-45 at 200 ns delay time, I3739.93Apbi/ l2476.4oApbi=l-48 at 300 ns delay time, I3739.93Apbi/ l2476.4oApbi=l-46 at 400 ns delay time; (ii)) I3785.99Apbn/ l4242.i4Apbii= 1-055 at 150ns delay time, I3785.99Apbn/ l4242.i4Apbii= 1-06 at 200 ns delay time, I3785.99Apbn/ l4242.i4Apbii= 1-07 at 300 ns delay time, I3785.99Apbn/ l4242.i4Apbii= 1-06 at 400 ns delay time and, (iii) l4272.6oApbm/l395i.92Apbm = 5.199 at 150 ns delay time, l4272.6oApbm/l395i.92Apbm = 5.187 at 200 ns delay time, l4272.6oApbm/l395i.92Apbm = 5.190 at 300 ns delay time.
The absence of self-absorption effect on emission line intensities has been checked using a method described by Thorne.[37] The de gree of self-absorption can be explained by the self-absorption coefficient maximum for each line,
k(k). With the obtained values of Ne in each plasma, we can
ratio between the observed intensity and the one emitted by optically thin plasma was calculated (the condition being that the optical depth is much lower than i):[37,38]
k(X) x D(cm) < 1 (l)
D is the physical length of the plasma, the value of the
optical depth k(X)D are not in excess of 0.1. The lines studied in this work self-adsorption was negligible, we can consider that the experiment was carried out in optically thin plasma. For example, for the experimental plasma thickness of 1 mm, the aforementioned criterion was exten-sively fulfilled since the line 3962.48 A of Pb IV,
k(X)D = 0.02, the line 3951.92 A of Pb III, k(X)D = 0.018, the
line 4244.92 A of Pb II, k(X)D = 0.019, and 4057.90 A of Pb I, k(X)D = 0.03, at 200 ns delay time. Recall that the spectral line 4057.90 A of Pb I corresponds to a transition whose lower level has a high population density.
Determination of the plasma temperatures and electron number densities
As mentioned previously, in order to get further details about the time evolution of the plasma obtained, in vacuum conditions, the temperature (T) and the electron number density (Ne) are very important parameters and their know-ledge very useful for their characterization time. Temperature measurements are necessary during its entire useful life. When LTE conditions can be applied, the popu-lation of the linked states follow a Boltzmann distribution, which can be used as a first approximation to determine the temperature of the plasma in the different delays. [16~201 The
excitation temperature was measured using the Boltzmann plot is described below, and the Saha's equation for deter-mining the ionization temperature. LTE plasmas are charac-terized by a single temperature the energy distribution of all species and degrees of freedom; in systems which are far from LTE, the use of increasingly higher excited levels ensures the assumption. Assuming the existence of LTE, electron number density, and temperature in LIP can be cal-culated by solving Saha's equation.
As is well known, in optically thin, the relative line inten-sities (IAij) of the lines emitted from a given state of
excita-tion can be used to calculate the temperature, if the transition probabilities (A,-,) are known, using the following expression:116*17*19*201
•»(i)=K^)-#- «
for a transition from an upper state i to a lower state j , IXy represents the measured integral line intensity in counts s_1,
Ajj is the transition probability, X is the wavelength of the
transition, Et is the excited level energy, and gt is the energy and statistical weight of level i, U(T) is the atomic species partition function, N is the total density of emitting atoms,
k is the Boltzmann constant, and T is the excitation
tem-perature in K. If we were to plot ln(7 y/gAy) vs. Eb for lines of known transition probability (Boltzmann plot), the result-ing straight line would have a slope — 1/kT and therefore the temperature can be obtained without having to know the total density of atoms or the atomic species partition function. For this purpose, the total intensity must be deter-mined for each spectral line.
Measurement of the intensities of a series of lines from different excitation states of the same species allows evalu-ation of the plasma temperature, provided that the Ay- and g{ are known. The temperature has been estimated, in each delay time, using different spectral lines of Pb I, Pb II, and Pb III, tabulated in Table 1, which, as already mentioned, is not absorbed. Using being better to use spectral lines with transitions states involving upper-level states that which lie close to the ionization energy level (ionization limit). The use of several different lines instead of just one pair leads to greater precision of the plasma temperature determination. So, the estimates values of excitation temperatures have been obtained from the relative intensities, I,-,-, obtained in the measurements in the different delays, and the A,-,- corre-sponding for this lines that have been taken from the bibli-ography. I5'13-39-41! xhe spectral lines were selected according to the following criteria: (i) the overlapping of spectral lines has to be avoided, (ii) it is very important to use lines high A,-,- values, (iii) the emission intensity must be large enough to ensure the observation with a sufficiently large signal-to-noise intensity ratio, (iv) self-absorption does not appear, and (v) that the lines must have a weak enough optical thickness to have a significant correlation between elemental concentration and line intensity. The accuracy of the tem-perature obtained is chiefly dependent upon the accuracy of the parameters used. The energies of the different levels are those of Moore'421 and the wavelengths corresponding are those of NIST database. 31 The ionic temperature gives a
better estimate of the electron temperature while the atomic temperature underestimates it. Some authors argue that atomic lines should not be used for LIP diagnostic as they are affected by recombination processes.91 Boltzmann plots for temperatures, obtained in different delay times (150-400 ns), are presented in Figures 6-9, where the errors were estimated from the standard deviation of the slopes obtained in the least squares fittings, the uncertainties that are taken into account are (a) the line profile fitting proced-ure (<1%), (b) the relative line intensity determination (<2%), and (c) the transition probabilities (5-10%), depend-ing on each line, see Table 1.
In Figure 6, at 150 ns delay time, the excitation tempera-ture has been determined by means of a Boltzmann plot for several spectral lines. Studying the spectrum in Figure 6(a),
-13.5--15.0
-16.5
•—i. -14.0
U)
Jr -14.5
Z=s -15.0
-15.5
-14.0
-14.5
-15.0
-15.5
_ 3951.92 A
(c) 4272.66 A Pb 150 ns
3728.69 A
T = (18 6 0 0 ± 4 0 0 ) K 3736.02 A
R =0.99756
— | 1 1 1 1 1 1 1 1 1 1 1 1 1 1 1 1 1 1 1 1 1 r
21.5 22.0 22.5 23.0 23.5 24.0 24.5 25.0 25.5 26.0 26.5 27.0 27.5
_ (b) 4244.92 A „ ^_4242.14A
3785.9 A _ _ ^ _ T = (17 7 0 0 ± 5 0 0 ) K
R =0.99407
1 1 ' 1 ' 1
P b l l 150 ns
_ ^ ^ 3713.98 A
1 1
11.5 12.0 12.5 13.0
'_ (a) 4057.29 A
3639.57A — _ ^ ^ ^
" 2 T = (16 8 0 0 ± 4 5 0 ) K
R =0.99658
1 I ' I ' I
P b l 150 ns
— ^ ^ ^ 3739.93 A
1 1 '
4.5 5.0
E: (eV) 5.5
Figure 6. Boltzmann plots for temperatures calculation of a laser-induced lead plasma using the 10,640 A laser, pulse energy 290 mJ, and pulse width 7 ns, in vacuum, obtained from spatially integrated measurements of the intensities of (a) Pb I lines, (b) Pb II lines, and (c) Pb III lines and delay time 150 ns.
14
15
16
17 18
- (c) 4272.66
7 3951.92 A
2
_ R =0.99564
' I '
A
^ 3 7 2 8 . 6 9 A
T = (17 4 0 0 ± 4 0 0 ) K
i ' i ' i '
Pblll 200 ns
- _ _ _ 3736.02 A
I ' I
-13.5
-14.0
-14.5
-15.0
-14.0
-14.5
-15.0
-15.5 T(b)
22 23 24 25 26 27
4244.92 A . 4242.14 A
3785.9 A
R =0.99943
3718.30 A
T = (16 080 ±200) K
P b l l 200ns
3713.98 A
11.5 12.0 12.5 13.0
" (a) 4057.29 A
" 3639.57A — — — _ _ _ _ ^
7 2 T = (15 000 ±150) K
- R =0.99981
' I ' I ' I
P b I 200 ns
— ^ ^ 3739.93 A 2476.40 A
1 1 '
4.5 5.0 5.5
E, (eV)
Figure 7. Boltzmann plots for temperatures calculation of a laser-induced lead plasma using the 10,640 A laser, pulse energy 290 mJ, and pulse width 7 ns, in vacuum, obtained from spatially integrated measurements of the intensities of (a) Pb I lines, (b) Pb II lines, and (c) Pb III lines and delay time 200 ns.
0.99407. In Figure 6(c), four lines 3951.92 A, 4272.66 A, 3728.69 A, and 3736.02 A of Pb III, obtaining (18,600 ±400) K for on small AE = 5.018 eV, all the data exhibited a linear regression fit, with a correlation coefficient than 0.99756. We observed that the excitation temperature obtained with the lines of Pb III is higher than those obtained with the lines of Pb II and is higher than that obtained with the lines of Pb I. The lines of Pb III are mainly emitted from the hot plasma core while the lines of Pb II and the lines of Pb I are emitted more towards from the cold plume periphery.
We do not have spectral lines of Pb IV to estimate the exci-tation temperature.
-14 -15
-16 -17 -18
-19
(C) m 4272.66 A
3951.92 A
3728.69 A
T = (14 9 0 0 ± 2 5 0 ) K
Pb III 300 ns
3736.02 A R =0.99903
3.0
3.5
4.0
4.5
22 23 24 • (h) 4244.92 A
- i « 4 2 4 2 . 1 4 A 3785.9 A * ^ ^ -Z- — ^ _
T = (14 7 0 0 ± 3 8 0 ) K • R =0.99565
1 I ' I
25
'
26 27
P b l l 300 ns
3718.30 A
^ ^ ^ ^ - ^ ^ 3713.98 A
I ' I
3.5
4.0
4.5
5.0
5 5
11.5 12.0
~ (a) ^1057.29 A
3639.57 A — — ^ _ _
T = (14 800 ±200) K 2
_ R =0.99946
1 1 ' 1 '
12.5 13.0 P b l 300 ns
" — — ~ ^ _ ^ 3739.93 A
^~TT~% -* 2401.94 A
2476.40 A
I ' I ' I
4.5 5.0 5.5 6.5
E, (eV)
Figure 8. Boltzmann plots for temperatures calculation of a laser-induced lead plasma using the 10,640 A laser, pulse energy 290 mJ, and pulse width 7 ns, in vac-uum, obtained from spatially integrated measurements of the intensities of (a) Pb I lines, (b) Pb II lines, and (c) Pb III lines and delay time 300 ns.
15
16
17
18
19
2 0
- ( c ) ,
- 4272.66 A
- 2 - R =0.99635
1
3951.92 A
T = (13 700 ±400) K
1 i ' i
3728.69 A
1 1 '
P b l l l 400 ns
^ ^ ^ 3736.02 A
1 ' 1 '
21 22 2 3 24 25 26 2 7
oT -13
d f -14
-14
-15
( b ) 4244.92 A 5^4242.14 A
3785.9 A - — — _ ^ _ ^
" R2= O . 9 9 6 1 3 T = ( 1 3 7 0 0 ± 3 5 0 ) K
1 I 1 I 1
-_____3718.30 A
I '
P b l l 400ns
i 3713.98 A
I '
11.5 12.0 12.5 13.0
( a ) _ 4057.29 A
3639.57 A
Pb I 400 ns
R =0.99743 T = (13 600 ±300) K
3739.93 A
2476.40 2446.18A
2401.94 A 2393.90 A T
4.5 5.0
E: (eV) 5.5 6.5
Figure 9. Boltzmann plots for temperatures calculation of a laser-induced lead plasma using the 10,640 A laser, pulse energy 290 mJ, and pulse width 7 ns, in vac-uum, obtained from spatially integrated measurements of the intensities of (a) Pb I lines, (b) Pb II lines, and (c) Pb III lines and delay time 400 ns.
for on small A E = 1.448 eV, all the data exhibited a linear regression fit, with a correlation coefficient than 0.99943. In
Figure 7(c), four lines 3951.92 A, 4272.66 A, 3728.69 A, and 3736.02 A of Pb III, obtaining (17,400 ±400) K for on small A£ = 5.018 eV, all the data exhibited a linear regression fit, with a correlation coefficient than 0.99564. It has also been observed that the excitation temperature obtained with the lines of Pb III is higher than those obtained with the lines of Pb II and is higher than that obtained with the lines of Pb I.
In stage 150-200 ns expansion, the amount of energy radiated in the form of the continuous spectrum is far greater than the energy radiated by the line spectrum. The atomic and ionic excitation temperatures are different in dif-ferent zones of the plasma. This indicates a change in tem-perature across the radical dimension. In some papers,'29,311
expansion. This is why the importance of considering none-quilibrium effects in the initial stage of LIP expansion.
In Figure 8, at 300 ns delay time, the excitation tempera-ture has been determined by means of a Boltzmann plot for several spectral lines. In Figure 8(a), the spectral lines 3639.57 A, 4057.29 A, 3739.93 A, 2476.40 A, and 2401.94 A of Pb I, obtaining (14,800 ±200) K for on small AE = 1.755 eV, all the data exhibited a linear regression fit, with a correl-ation coefficient than 0.99946. In Figure 8(b), the spectral lines 4242.14 A, 4244.92 A, 3785.9 A, 3718.30 A, and 3713.98 A of Pb II, obtaining (14,700 ±380) K for on small
AE= 1.448 eV, all the data exhibited a linear regression fit,
with a correlation coefficient than 0.99565. In Figure 8(c),
the spectral lines 3951.92 A, 4272.66 A, 3728.69 A, and 3736.02 A of Pb III, obtaining (14,900 ±250) K for on small
AE = 5.018 eV, all the data exhibited a linear regression fit,
with a correlation coefficient than 0.99903. The average tem-perature is about ^14 800 k.
In Figure 9, at 400 ns delay time, the excitation tempera-ture has been determined by means of a Boltzmann plot for several spectral lines. In Figure 9(a), the spectral lines 3639.57 A, 4057.29 A, 3739.93 A, 2476.40 A, 2446.18 A, 2401.94A, and 2393.90 A of Pb I, obtaining (13,600±300) K for on small AE = 2.121 eV, all the data exhibited a linear regression fit, with a correlation coefficient than 0.99743. In
Figure 9(b), the spectral lines 4242.14 A, 4244.92 A, 3785.9 A, 3718.30 A, and 3713.98 A of Pb II, obtaining (13,700 ±350) K for on small AE= 1.448 eV, all the data exhibited a linear regression fit, with a correlation coefficient than 0.99613.
Figure 9(c), the spectral lines 3951.92 A, 4272.66 A, 3728.69 A, and 3736.02 A of Pb III, obtaining (13,700 ±400) K for on small A£ = 5.018 eV, all the data exhibited a linear regression fit, with a correlation coefficient than 0.99635. The average temperature is about ^13,700 K.
During the expansion in stage 300-400 ns delay times, the energy emitted by the continuum gradually decreases, the coincidence of the excitation temperatures for the three species (Pb I, Pb II, and Pb III) supported, over this delay times, with the existence of LTE. At 400 ns delay time, only the resonant lines of Ca II appear (impurities), as mentioned above, with a very low intensity, affecting the temperature obtained within the estimated errors.
Figures 6-9 show that the temperature diminishes rapidly with time in the early phase of plasma life (150-400 ns). It then continues slows off (400-3000 ns) until it levels, which can be explained by the presence of a large difference entre the plasma temperature and ambient temperature.
Also, because emission lines from different ionization stages are present in the laser-induced lead plasma, a com-bination of the Saha ionization and Boltzman excitation dis-tributions can be used to measure the electron temperature, but you need to know the Ne plasma.
To measurement the electron number density, Ne, it has been done using the Stark broadening (StB) method as well as using the Saha-Boltzmann equation (SBE). The StB is based on the Stark effect phenomenon in plasmas, which is due to collisions of the emitting atoms or ions which elec-trons and ions. The electric field generated by these
fast-moving electrons or ions in the plasma perturbs the energy levels of the individual atoms or ions, thereby broadening the resultant emission lines. The LTE assumption is based on the fact that the characteristic collision time is much less than the characteristic time of radioactive decay. Therefore, it is valid to assume that the Stark broadening is the domin-ant broadening mechanism when the density of plasma is above 1015 cm- 3, in the LIP. The other mechanisms contri-buting to the line broadening, such as natural broadening, resonance broadening, Van der Waals broadening and Doppler effects are negligible at the range the electron densities in this study. 16'191
Hence, the Ne of the plasma was determined by compar-ing the Stark broadencompar-ing for some transitions with those of other authors. The experimental profiles were fitted by a Voigt profile. As aforementioned, the Voigt profile is the convolution of a Lorentzian curve and Gaussian curve; spec-tral lines have thus Lorentzian shape. The Gaussian in the measured line profile is due to the spectroscopic apparatus. In this way, convolution with the known instrumental pro-file can be taken into account, the spectral line intensity (area below profile) is obtained, the Lorentzian and Gaussian contributions to the full width at half maximum (FWHM) broadening can be separated, and lines with par-tial overlapping can be analyzed.
The theoretical FWHM of a Stark broadened line can be used for the determination of electron number density, Ne (cm- 3), using the following expression: ll6'18~201
AX1/2 = 2(D, exp
3.
101'
1 + 1.75A
W
6
)
1-1.2M- l / 3 \
(3)
where AX1/2 (in A units) is the FWHM of the transition con-sidered and obtained at the density Ne expressed in cm- 3. The coefficients c»exp and A, both independent of density and a weak function of temperature, are the electron the electron-impact hall width parameter and the ion-broaden-ing parameter, respectively. ND is the number of particles in the Debye sphere, which must be in excess of the lower limit ND = 2 of the Debye approximation for correlation effects, Wolf. For the electron densities present in this study, the quasi-static ion broadening, taken into account in the second term in the expression (3), is only approximately 5% of total width. In our measurements, we have assumed that A is negligible.'451
The Ne, of the plasmas investigated, has been extracted
by compared the Al1/2 of lines corresponding to species Pb I, Pb II, and Pb III obtained in this work with those coexp values from others authors, see Table 2.[6'15A6] We have