Journal Name 2016,x,x; doi:10.3390/ Article
1
Quantification of
2
maximum daily p
3
change in the Iber
4
Carlos Garijo1*and Luis Medie
5
Received: date; Accepted: date; Pu
6
Academic Editor: name
7
1 Universidad Politécnica de Mad
8
Environment, Madrid, 28040, Sp
9
2 Universidad Politécnica de Mad
10
Environment, Madrid, 28040, Sp
11
* Correspondence:[email protected]
12
Abstract: Climate model proj
13
precipitations in the future due
14
precipitation projections in the
15
through regionalised Global C
16
(RCM). In this work, 12 combi
17
8.5) supplied by the EURO
18
Precipitation quantiles for a s
19
Generalized Extreme Value (G
20
the future are compared with
21
model. An approach based o
22
uncertainty from the climate m
23
the sampling uncertainty in th
24
The higher the significance t
25
Consequently, a set of maps a
26
making process in subsequent
27
Keywords: Precipitation; Clim
28
PACS: J010129
30
1. Introduction31
Currently, there is a genera
32
and the ecosystems around it
33
extreme events, such as heat wav
34
seen in recent years [1]. Possible
35
weather patterns, amplifying the
36
How the climate will beha
37
Model (GCM) outputs. GCMs ar
38
us to know the possible evolutio
39
a set of forcing variables, such a
40
GCM, Regional Climate Models
41
climate behaviour at a higher sp
42
Since the idea of dynamica
43
applied throughout the world to
44
www
of the expected changes in an
ly precipitation quantiles und
Iberian Peninsula
diero2
; Published: date
adrid, Department of Civil Engineering: Hydraulics, Ene , Spain.;[email protected]
adrid, Department of Civil Engineering: Hydraulics, Ene , Spain.; [email protected]
m.es; Tel.: +34 910674376
rojections can be used to assess the expected beh due to climate change. In Europe, the EURO-CORDE the future under various representative concentratio
l Climate Model (GCM) outputs by a set of Region mbinations of GCM and RCM under two scenarios
RO-CORDEX programme are analysed in the a set of probabilities of non-exceedance are estim
(GEV) distribution and L-moments. Precipitation qu ith the precipitation quantiles in the control perio d on Monte Carlo simulations is developed, in o e model projections. Expected changes in the future
the control period. Thus, statistical significant cha e threshold, the fewer cells with significant chan ps are obtained for various thresholds, in order to ent climate change studies.
limate Change; EURO-CORDEX; Uncertainty; Iberia
neral concern about how climate will change in the it are vulnerable to any changes in the frequenc waves, heavy precipitation, droughts, or wind storm ible changes in the climate will manifest locally via
the frequency or the magnitude of extreme events. ehave in the future can be assessed through the use
s are simplified representations of the Earth’s climat ution of climate in the future, as well as to study the h as greenhouse emissions. To overcome the gross s ls (RCM), focus on some regions of the world, are u spatial resolution.
ical downscaling, several RCMs have been develop d to produce high-resolution climate information un
ww.mdpi.com/journal/xxxx
n annual
nder climate
Energy and
Energy and
behaviour of extreme RDEX project provides ation pathways (RCP), gional Climate Models rios (RCP 4.5 and RCP he Iberian Peninsula. stimated by using the n quantiles expected in eriod, for each climate in order to assess the ure are compared with hanges are identified. hanges are identified. to assist the decision
erian Peninsula;
the future. The society ency and intensity of orms, among others, as via changes in regional
.
use of Global Climate mate system that allow the effect of changes in ss spatial resolution of re used to simulate the
scenarios for a range of impacts studies [2]. The most recent RCMs, have a spatial resolution of 0.11°,
45
that has been proved as appropiatelly enough to both represent the orography and capture the
46
interaction of atmosphere flow and surface, making it ideal for regions with substantial orographic
47
features [3, 4].
48
Given its high potential impact, further studies were devoted to assess the future behavior of
49
extreme precipitations [1, 5-7]. However, most of them are conducted at an European scale, or
50
focused on specific areas of interest. In the Iberian Península, few studies can be found [8, 9]. A
51
general agreement about a decrease in average rainfalls [10] together with an increase in extreme
52
events is found from previous studies. However, the results do not agree neither on the extent of the
53
change nor the spatial distributions of such changes.
54
This paper offers a new approach to study the effect of climate change on extreme precipitations
55
in the Iberian Peninsula in the future. In addition, it seeks to add conclusive results, statistically
56
based, about the expected change in maximum daily precipitation. Future climate scenarios are
57
based on the Fifth IPCC Assessment Report (AR5) on climate change that considers four
58
Representative Concentration Pathways (RCP), depending on the total radiative forcing at 2100: 2.6,
59
4.5, 6.0 and 8.5. Findings of this study can be very useful for subsequent climate change studies,
60
showing relevant results to decision makers.
61
2. Base data
62
Data used in this study is supplied by the CORDEX project, from the regionalization of GCMs,
63
through a set of RCMs. Model realizations follow the guidelines of the AR5. The region of interest in
64
this study is Europe (EURO-CORDEX; [11]), as it is the only region that includes the entire Iberian
65
Peninsula.
66
Precipitation time series under climate change scenarios are available freely at any of the
67
European datanodes. Outputs of the RCMs are supplied by cells with different spatial resolution
68
and different RCPs. In this study, the finest spatial resolution (0.11° ~ 12.5 km) and daily time
69
resolution is selected, both for the control (1951-2005 or 1971-2005, depending on the model) and
70
future (2006-2100) periods. RCP 4.5 and RCP 8.5 emission scenarios are considered. 12 models from
71
the EURO-CORDEX project have been selected.
72
The study area is the Iberian Peninsula and the Balearic Islands, in the South of Europe. Thus,
73
the European mesh have been clipped to a 10 km radius from the coast (or in the case of northern
74
Spain, from the border) of the studied area. This new area includes 4293 cells of the total mesh of
75
Europe.
76
3. Methodology
77
3.1. Annual Maximum Series
78
Climate models supply daily precipitation series. Annual maximum series (AMS) of daily
79
precipitations have been extracted, both in control and future periods. Three time intervals in the
80
future period have been considered: 2011-2040, 2041-2070, and 2071-2095. Thus, two AMS of 30 years
81
and one of 25 yearsfrom the future period, as well as one of 54 or 34 years (depending on the model)
82
from the control period have been obtained.
83
Precipitation quantiles for a set of probabilities of non exceedance (termed as return periods in
84
years) can be estimated by fitting a frequency distribution to the AMS. Seven return periods (2, 5, 10,
85
50, 100, 500 and 1000 years) were selected as representative probabilities for civil engineering design
86
purposes as sewage systems, culverts or dams. Then, the precipitation depth for a given return
87
period has been determined by the Generalized Extreme Value (GEV) distribution function fitted to
88
the series through the L-moments method. The use of the three-parameter GEV function ensures to
89
capture the behaviour of the right tail of the distribution adequately.
90
From both sets of precipitation quantiles, in the control and future periods, the relative
91
differences (∆) between them have been obtained, calculated for each model, cell, emission scenario
and return period, following the equation 1. Consequently, possible systematic biases of the climate
93
models can be overcome.
94
∆ = ( ( (
( (1)
being ( and ( the precipitation quantile for the T-year return period in the control
95
and future periods, respectively.
96
After the process, a set of 12 relative differences, or deltas, for each climate model are obtained
97
at each period and emission scenario. The 50 (median), 68 and 90 percentiles were selected to show
98
the general change trend in maximum precipitations over the Iberian Peninsula. In order to present
99
the results visually, a smoothing procedure was adopted, consisting of interpolating linearly the
100
deltas from the initial grid to a new finner grid of 5 km.
101
3.2. Uncertainty Analysis
102
Quantile estimates from a distribution function for a given probability entail a range of
103
variability, or uncertainty, around the calculated value. Uncertainty analyses try to quantify such
104
range, which is useful to establish thresholds for which a possible change in the future can be
105
included inside “natural” variability or not.
106
To obtain this range, a set of 1000 random series with values between 0 and 1, assimilated to
107
probabilities, of three different lengths, two of 30 and one of 25 values, were generated for each cell
108
and model. The lengths of the periods in the future were considered, as the uncertainty in the
109
precipitation in the future is quantified. The probabilities were transformed into precipitation
110
valuesby using the GEV function fitted to the control period. Consequently, a new set of 1000 GEV
111
distribution functions were obtained, for each cell and model. The range of variability for each
112
return period was quantified.
113
If the precipitation quantile in the future were outside the two-sided threshold, the change is
114
considered significant. Therefore, such change can be considered due to climate change. In order to
115
identify the significance of the change, a threshold needs to be selected. In addition, the number of
116
models that confirm a significant change in the future needs to be determined. Thus, different
117
combinations of both thresholds were considered to see how the change in precipitacion varies over
118
the study area.
119
With the thresholds selected, the median of the changes defined by equation 1 for all models
120
shows the possible change in the future in those cells where the change is significant, and the
121
number of models is appropriate. The reason of chossing all the models is their equiprobability.
122
Despite the fact that just some of them have a significant change, none of them can be removed
123
because of their equal probability of occurrence.
124
4. Results
125
4.1. Future projections
126
Raw projections of annual maximum daily precipitations give a general view of what is the
127
general trend expected in the future. The median (percentile 50) offers an average change over the
128
models that explains the change that is expected to occur. Meanwhile, higher percentiles, specially
129
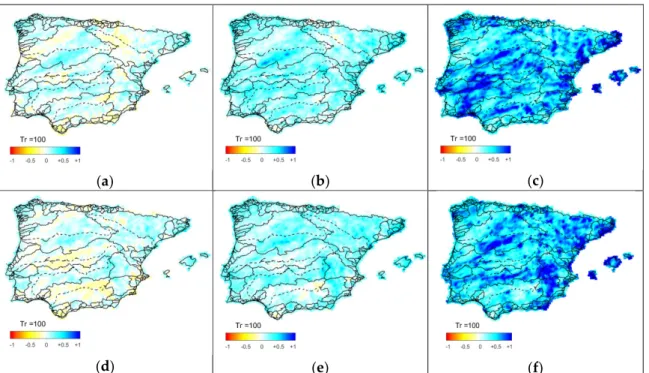
the 90th percentile, show the areas where there may occur larger changes. As an example, in Figure 1,
130
the change in the middle future period (2041-2070) for the 100-year return period precipitation is
131
(a) (b) (c)
(d) (e) (f)
Figure 1. Relative changes in the 100-year return period maximum daily precipitation for
133
percentiles of 50% (a-d), 68% (b-e) and 90% (c-f), for the future time interval 2041-2070, with the RCP
134
4.5 in the first row and RCP 8.5 in the second row. The bar in the lower left corner indicates the
135
relative difference between control and future intervals.
136
4.2. Assessment of the uncertainty thresholds
137
Searching for the appropriate significance thresholds, both the two-sided significance threshold
138
and the minimum number of models with change were analysed (Figure 2), plotting the average
139
percentage of cells per model vs the significance threshold (draw in the figure as one-side limit). The
140
100-year return period precipitation in the future period 2041-2070 was selected. The results for
141
other return periods and periods are also available. Both emission scenarios, RCP 4.5 in Figure 2.a
142
and RCP 8.5 in Figure 2.b, were considered. For each graph, several distributions that represent the
143
minimum number of models (N) with change can be seen.
144
(a) (b)
Figure 2. Distribution of the average percentage of cells per model vs threshold of significance for
145
the 100-year return period precipitation in the future time interval 2041-2070 for RCP 4.5 (a) and RCP
146
8.5 (b). Each curve represent a minimum number of models with significant change (from N≥1 to
147
N≥12). The significance threshold shown in the x-axis represents the one-side threshold. However,
148
4.3. Spatial distribution of significant changes
150
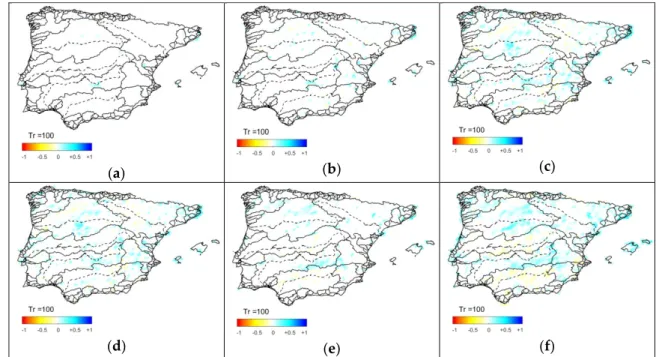
Spatial distribution of cells with significant change for various thresholds were outlined in
151
Figure 3, in order to explore further about the selection of the significant thresholds. A minimum
152
number of models with change equal to six (at least the half of the models) was selected, as showing
153
all the thresholds is impractical. Following the previous analyses, the 100-year return period
154
precipitation, in the future period 2041-2070 was selected. Three thresholds of interest were used(5,
155
10 and 20% two-sided significant thresholds). In order to present the results, the same smoothing
156
procedure used in Section 4.1 was adopted.
157
As expected, the higher the threshold, the more amount of cells are significant. Furthermore,
158
following results of Figure 2, RCP 8.5 have quite more significant cells than RCP 4.5, for all
159
thresholds. In general, despite some zones, both scenarios present similar areas of change, reaching
160
changes of about 50% in both directions. However, RCP 8.5 shows more areas with negative changes
161
than RCP 4.5, specially in the middle areas of Tagus and Guadalquivir river basins. Finally, it is
162
interesting to see how significant descreasing changes do not arise until the 20% threshold is
163
seleceted in both emission scenarios.
164
165
(a) (b) (c)
(d) (e) (f)
Figure 3. Spatial distribution of significant changes in the 100-year precipitation quantile with a
166
significant two-sided threshold of 5% (a,d), 10% (b,e) and 20% (c, f), with a minimum number of six
167
models with significant change in the future period 2041-2070, for RCP 4.5 in the first row and RCP
168
8.5 in the second row.
169
5. Discussion and Conclusions
170
5.1. Uncertainty thresholds
171
Results show the difficulty in selecting a threshold, both for significance values and minimum
172
number of models. Both scenarios behave in a similar way, and the equidistancy between the
173
distributions of the minimum number of models, make the election hard.
174
Regarding the minimum number of models (N), a general option may be to select at least the
175
half of the total number of models (in this case N≥6). This was the decision taken in this study. A
176
higher threshold, especially more than eight models, leads to a high significance threshold to obtain
177
change values.
178
The choice of the significant threshold depends on the scientific rigor required. A threshold of 1%
179
means there are no cells with change, so higher thresholds must be chosen. As Figure 3 shows, some
180
with change. This result shows a common problem of this type of studies, the ‘island effect’.
182
Individual cells without any other cell with change around it makes it difficult to trust that there is a
183
change in that local area, since changes should occur across a larger region, and not locally.
184
Consequently,caution should be exercise when obtaining conclusions about such cells.
185
5.2. Significant changes in models projections
186
A general assessment over all return periods could be confusing, as they show differing areas
187
with change. Therefore, the 100-year precipitation quantile in the future period 2041-2070 is
188
considered in the discussion. From Figure 3, some conclusions can be obtained. Areas with positive
189
change in both scenarios are the upper part of Guadiana river basin, the central part of Duoro river
190
basin and some specific areas of the Mediterranean coast. On the other hand, negative changes can
191
be found in RCP 8.5 in the Tagus river basin and southest Spain. This last trend agrees with findings
192
of [8]. Nevertheless, results of this paper show many more areas with positive change in that region.
193
References
194
1. Beniston, M.; Stephenson, D.B.; Christensen, O.B. et al. Future extreme events in European climate: an
195
exploration of regional climate model projections. Climate Change, 2007, 81, 71–95,
196
DOI:10.1007/s10584-006-9226-z
197
2. Mascaro, G.; Viola, F.; Deidda, R. Evaluation of precipitation from EURO-CORDEX regional climate
198
simulations in a small-scale Mediterranean site. J Geophys Res Atmos, 2018, 123, 1604–1625, DOI:
199
10.1002/2017JD027463
200
3. Prein, A.F.; Gobiet, A.;Truhetz, H. et al. Precipitation in the EURO-CORDEX 0.11° and 0.44°
201
simulations: high resolution, high benefits?.ClimDyn, 2016, 46, 383–412, DOI:
202
10.1007/s00382-015-2589-y
203
4. Casanueva, A.; Kotlarski, S.; Herrera, S. et al. Daily precipitation statistics in a EURO-CORDEX RCM
204
ensemble: added value of raw and bias-corrected high-resolution simulations. ClimDyn, 2016, 47,
205
719–737, DOI: 10.1007/s00382-015-2865-x
206
5. Frei, C.; Schöll, R.; Fukutome, S. et al. Future change of precipitation extremes in Europe:
207
Intercomparison of scenarios from regional climate models, J Geophys Res,2006, 111, D06105, DOI:
208
10.1029/2005JD005965
209
6. Fowler, H.J.; Ekström, M.; Blenkinsop, S. et al. Estimating change in extreme European precipitation
210
using a multimodel ensemble. J Geophys Res, 2007, 112, D18104, DOI: 10.1029/2007JD008619
211
7. Rajczak, J.; Pall, P.; Schär, C. Projections of extreme precipitation events in regional climate
212
simulations for Europe and the Alpine Region. JGeophys Res, 2010, 118, 3610–3626, DOI:
213
10.1002/jgrd.50297
214
8. Monjo, R.; Gaitán, E.; Pórtoles, J. et al. Changes in extreme precipitation over Spain using statistical
215
downscaling of CMIP5 projections. Int J Climatol, 2016, 36, 757–769, DOI: 10.1002/joc.4380
216
9. Herrera, S.; Fita, L.; Fernández, J. et al. Evaluation of the mean and extreme precipitation regimes
217
from the ENSEMBLES regional climate multimodel simulations over Spain. J Geophys Res, 2010,115,
218
D21117, DOI: 10.1029/2010JD013936
219
10. Giorgi, F.; Lionello, P. Climate change projections for the mediterranena region. Glob Planet Change,
220
2008, 63, 90–104, DOI: oi:10.1016/j.gloplacha.2007.09.005
221
11. Jacob, D.; Petersen, J.; Eggert, B. et al. EURO-CORDEX: new high-resolution climate change
222
projections for European impact research. Reg Environ Chang, 2014, 14, 563–578. DOI:
223
10.1007/s10113-013-0499-2
224
© 2016 by the authors; licensee MDPI, Basel, Switzerland. This article is an open access
225
article distributed under the terms and conditions of the Creative Commons by