Location of Bioelectricity Plants in the Madrid
Community Based on Triticale Crop: A
Multicriteria Methodology
Article in Mathematical Problems in Engineering · March 2015
Impact Factor: 0.76 · DOI: 10.1155/2015/483151
READS
18
4 authors, including:
Luis Romero
National Distance Education University
30PUBLICATIONS 9CITATIONS
SEE PROFILE
María Romero
National Distance Education University
18PUBLICATIONS 8CITATIONS
SEE PROFILE
Maria Luisa Cuadrado
Universidad Politécnica de Madrid
15PUBLICATIONS 77CITATIONS
SEE PROFILE
All in-text references underlined in blue are linked to publications on ResearchGate, letting you access and read them immediately.
Research Article
Location of Bioelectricity Plants in the Madrid Community
Based on Triticale Crop: A Multicriteria Methodology
L. Romero,
1M. S. Romero,
2M. L. Cuadrado,
3and J. Fernández
41Escuela T´ecnica Superior de Ingenieros Industriales, Universidad Nacional de Educaci´on a Distancia (UNED), 28040 Madrid, Spain
2Facultad de Ciencias Econ´omicas y Empresariales, Universidad Nacional de Educaci´on a Distancia (UNED), 28040 Madrid, Spain
3Escuela T´ecnica Superior de Ingenieros de Telecomunicaci´on, Universidad Polit´ecnica de Madrid (UPM), 28040 Madrid, Spain
4Escuela T´ecnica Superior de Ingenieros Agr´onomos, Universidad Polit´ecnica de Madrid (UPM), 28040 Madrid, Spain
Correspondence should be addressed to L. Romero; [email protected]
Received 9 January 2015; Revised 26 February 2015; Accepted 5 March 2015
Academic Editor: Gongnan Xie
Copyright © 2015 L. Romero et al. This is an open access article distributed under the Creative Commons Attribution License, which permits unrestricted use, distribution, and reproduction in any medium, provided the original work is properly cited.
This paper presents a work whose objective is, first, to quantify the potential of the triticale biomass existing in each of the agricultural regions in the Madrid Community through a crop simulation model based on regression techniques and multiple correlation. Second, a methodology for defining which area has the best conditions for the installation of electricity plants from biomass has been described and applied. The study used a methodology based on compromise programming in a discrete multicriteria decision method (MDM) context. To make a ranking, the following criteria were taken into account: biomass potential, electric power infrastructure, road networks, protected spaces, and urban nuclei surfaces. The results indicate that, in the case of the Madrid Community, the Campi˜na region is the most suitable for setting up plants powered by biomass. A minimum of 17,339.9 tons of triticale will be needed to satisfy the requirements of a 2.2 MW power plant. The minimum range of action for obtaining the biomass necessary in Campi˜na region would be 6.6 km around the municipality of Algete, based on Geographic Information Systems. The total biomass which could be made available in considering this range in this region would be 18,430.68 t.
1. Introduction
The future of world energy depends on the progressive substitution of fossil fuels for renewable energy. Therefore, the issue of how to achieve an efficient and rational increase as far as possible in that energy is a topic of enormous interest.
The development of renewable energy from biomass, which has received support from the different administra-tions, is currently being expanded and is feasible from a technical and economic point of view. To be specific, in the Madrid Community, there is a high potential for biomass, related to the agricultural surface available, mainly in the regions in the south of the Community [1].
Although there is a wide range of possibilities of new crops producing biomass, given their tradition in Spain, cereals are some of the most appropriate ones for obtaining biomass for heat or heat and electricity production [2]. All winter cereal species are susceptible to being used in energy production, mainly wheat, barley, triticale, oat, and rye. Although some are more favorable than others for energy
use, triticale, oat, and rye are the species with the lowest harvest indexes (grain biomass/total biomass), which makes them more apt for using their integral biomass for producing energy. Of the three, triticale is the species with the best biomass productivity indexes.
Simulation models constitute a tool which makes use of information obtained through previous experiments, and they permit the projection of physical and economic results, taking into account all the factors interacting in a certain environment. Compared to the variability and complexity of the current production systems, simulation models have been presented as an alternative to be employed in future scenarios [3]. The most complex models enable one to carry out a yield sensitivity analysis based on different factors, combining different types of soil, climate, cultivation, and management. Most of the model applications are related to management aspects such as fertilization or irrigation strategies, sowing dates, or crops with a different cycle, which have to be assessed in accordance with a historical series of climate data. Volume 2015, Article ID 483151, 11 pages
A regression analysis is a statistical technique for the modeling and investigation of the relationship between two or more variables, and it has been used for a reasonable amount of time for the estimation of the production of
differ-ent crops [4,5]. A simple linear regression expresses the
rela-tionship between a dependent and an independent variable in terms of the slope and the intersection of the line which best fits the variables, whereas, in the multiple regression, the possible relationship between several independent variables and another dependent variable is studied. For the estimation of cereal yield, the dependent variable would be the biomass production and the independent ones the climatological data (such as temperature, radiation, or precipitation), soil, fertilization, irrigation, and so forth variables.
Pertaining to the establishment of bioelectricity plants based on triticale biomass in the Madrid Community, a multicriteria decision method has been used to determine the best region. The best location in this area has been established using Geographic Information Systems, which were acquired by inputting some geographical restrictions.
Geographic Information Systems (GIS) have been used to determine what there is in a certain location, find suitable land for a specific purpose, establish the temporal differences in a particular place, and carry out statistical distributions and modeling to make an analysis of the territory using
decision-making processes [6, 7]. Among the latter, multicriteria
decision methods (MDMs) are powerful mathematical tools, which can be used as models for the evaluation and combina-tion of variables. They are based on the analysis, discussion, and ranking of alternatives with the aim of offering solutions to problems [8]. The alternatives analyzed by the MDMs can be infinite when they are defined by a set of feasible solutions of a continuous mathematical nature (continuous multicriteria methods), or finite, normally in not a very high number (discrete multicriteria methods).
This work has studied, by means of GIS and MDM, the potential production of triticale biomass in the Madrid Community and the possibility of using it for the electricity production in each of the six agricultural regions.
2. Methodology
The purpose of this work was, first, to quantify the triticale biomass potential in each of the six agricultural regions of the Madrid Community and, second, to define which of them offers the best conditions for the installation of electricity plants powered by biomass. It was also aimed at determining the most suitable location for a bioelectricity plant in the area with best conditions.
A work methodology, whose flow diagram is shown in
Figure1, has been designed to cover the following stages.
(1) Determining the surface potentially usable for the triticale crop.
(2) Generating a biomass production model for the triti-cale crop.
(3) Quantifying the available potential yield of triticale biomass.
Available surface
Triticale model
Triticale potencial production
Multicriteria analysis
Sig analysis
Bioelectricity plant location
Figure 1: Flow diagram for the position of biomass plants.
(4) Making a multicriteria analysis to define the region with the best conditions for the installation of bioelec-tricity plants.
(5) Performing a GIS analysis for the determination of the most suitable location for a bioelectricity plant in the region considered.
2.1. Surface Available. It was aimed at assessing the
agricul-tural surface which could potentially be devoted to cultivating triticale for the production of biomass in each of the regions in the study area, establishing a scenario which represents a percentage of the employment of the rainfed fallow surface.
2.2. Model for Triticale Biomass Production. The assessment
of the potential production of triticale biomass in the agricul-tural regions available in each municipality was carried out through a production model or function which relates the climate variables and the known production of cereal crops. This model represents the expected potential production in each region.
To set up this model, regression and multiple correlation techniques which quantify the statistical association between two or more variables were used.
To develop the biomass production model, first a grain production model was generated on the basis of trials or estimations carried out in the Madrid Community, and, subsequently, the biomass/grain ratio was calculated in accor-dance with a pilot experiment carried out in the ETSIA Practice Fields.
2.2.1. Grain Production Model. To develop this model, a
relationship between the mean grain production data from the trials and the climatological variables measured in the area of each trial (mean temperature and total rainfall in the period) was established. Only climatological variables were employed due to triticale having a small root system, and to considering that fallow land is apt for growing cereals.
Values from trials on triticale grain yield used were com-piled in “Encuesta de Superficies y Rendimientos” (ESYRCE) of MAGRAMA during the 2008-2009, 2009-2010, 2010-2011, and 2011-2012 cropping seasons.
were mean temperature and total rainfall from October to June during the corresponding cropping years from the weather stations with data closest to the sampled trials of triticale grain yield.
For the particular case of this work, multiple regression logarithmic curves for the development of the models (with the aim of controlling the production and so that it did not shoot up for extreme climatological values) were employed; the equations were considered to have a good correlation
when the determination index (𝑅2) was found in the interval
between 0.8 and 1 [9]. The tool used for the regression obtainment was Microsoft Excel 2010.
First, it was necessary to normalize the climatological data in order to be able to enter dimensionless values in the model. As a base for the normalization of the temperature the value 9.9 was taken, and for the rainfall, 496.7. Those values corresponded to the municipality average in the Madrid Community for a series of 30 years (1971–2000) from October to June and were supplied by the AEMET.
Average estimation data grouped per cropping season and weather station were used. To enter the data in the model, it was considered that it was the rainfall rather than the temperature that exerted a double influence.
2.2.2. Obtainment of Biomass/Grain Ratio. To perform the
experiment, four varieties of triticale were selected: Amarillo, Trujillo, Collegial, and Bienvenu.
It was aimed at obtaining the total biomass/grain of the different triticale varieties submitted to two different rainfall regimes. For this purpose, 24 containers were prepared, 12 for each type of irrigation, and, within each irrigation group, 3 replications for each variety were carried out.
The experiment was performed in containers measuring
60×42×40 (cm) so that the surface of each one was 0.252 m2.
2.3. Potential Triticale Biomass Production. Starting from
the surface available and the triticale biomass production model, it was possible to quantify the biomass potential at a municipality level in the study area based on the triticale crop. The electrical output that is desired at each plant is 2.2 MW. According to the Natural Electric SA company, using a natural circulation boiler tube, with a mobile grille of alter-native movement, a working pressure in the boiler of 42 bars and a maximum continuous steam production of 11,000 kg/h, and a twin turbine running with a double radial stage and an axial stage and, finally, an electric generator of 2.630 kVA, 6.6 kV, and IP 44R, the expected performance could be 8,000 hours per year with an efficiency that varies between 21 and 22%. Therefore, the gross electricity production will be 17,600 MWh yearly (the net production will be somewhat less due to auxiliary charges).
The amount of biomass required will depend on the lowest calorific power (LCP) upon arrival at the plant, which will be measured by its moisture content. The biomass should not be placed in the boiler at over 30% moisture, although, for this work, only dry triticale biomass is considered. Efficiency ranges from 21 to 22%, so the intermediate value (21.5%) has been used for the calculations.
The procedure for calculating the biomass necessary (𝑀)
was the following (𝑀being expressed in tons of m.s., LCP in
kcal/kg and𝑃in Mwh):
P=LCP∗M∗0.215
860 →M=17600∗ 860
LCP∗0.215.
(1)
In the case of dry triticale biomass, a LCP of 4,060 kcal/kg was considered [10], so that a minimum of 17,339.9 tons will be needed to satisfy the requirements of each of the power plants.
Only the potentially usable biomass from those munici-palities whose centroids are included within the established radius of action will be computed. This is because, for its collection, some storage centers adjacent to the urban nuclei of each of them have been planned. The optimal area for the location of the power plants will be the surface within the suitable areas corresponding to the municipality, whose sur-roundings will be considered as being their range of action.
2.4. Multicriteria Analysis for the Determination of the Region
with the Best Conditions for Bioelectricity. In this stage, a
multicriteria analysis will be carried out to determine which region enjoys the best conditions for the installation of
bioelectricity plants. For this purpose, a group of𝑛regions
was considered and each one evaluated according to 𝑚
acceptability criteria.
The proposed methodology, based on compromise pro-gramming in a discrete multicriteria decision-making con-text, will involve defining an index of acceptability that aggre-gates the different acceptability criteria attached to each of the considered agrarian regions. Therefore, the n potential alter-natives can be ranked according to their overall acceptability. It should be noted that, in order for the proposed methodology to be of interest, the aggregate acceptability index should satisfy some common-sense properties, such as the following.
(a) Since the number of agrarian regions and indicators of acceptability in many real world situations can be high, the index calculation procedure should be simple.
(b) The interpretation of the index should be clear and straightforward.
(c) The index should represent a good balance between very wide-ranking criteria.
The first step in determining the aggregated acceptability indicator, given that the acceptability indicators are mostly measured in different units, is to normalize the different evaluations reached by the districts considered. A simple and pragmatic normalisation procedure successfully used in another context [11] is as follows:
𝑃𝑖𝑗=𝑃𝑃𝑖𝑗∗− 𝑃∗𝑗
𝑗 − 𝑃∗𝑗, 𝑖 = 1, 2, . . . , 𝑛, 𝑗 = 1, 2, . . . , 𝑚, (2)
where𝑃𝑖𝑗 = evaluation reached by the𝑖th agricultural area
acceptability criterion (𝑗 = 1, 2, . . . , 𝑚). 𝑃∗
𝑗 = ideal value
of the 𝑗th acceptability criterion. This value is given by
the maximum evaluation if the criterion is of the “more is better” type (e.g., the biomass potential) or by the minimum evaluation if the criterion is of the “less is better” type (e.g., the
protected natural spaces surface).𝑃∗𝑗= the anti-ideal value
of the𝑗th acceptability criterion. This value is given by the
minimum evaluation if the criterion is of the “more is better” type or by the maximum evaluation if the criterion is of the
“less is better” type.𝑃𝑖𝑗= normalized evaluation reached by
the𝑖th region when it is evaluated with respect to the 𝑗th
acceptability criterion.
It is worth noting that, with the normalization used, the normalized values are dimensionless, positive, and limited between 0 (when the district reaches the worst value) and 1 (when the district reaches the best value), respectively. Also,
for this normalization system, 1 and 0 are elements of Rm,
namely,𝑚components vectors defined by
1= (1, 1, . . . , 1)𝑇, 0= (0, 0, . . . , 0)𝑇, (3)
where the ideal vector is equal to 1 and the anti-ideal one is equal to 0, which is very convenient for understanding any possible aggregation.
Computing the vector of the acceptability criteria weights
𝑤 = (𝑤1, 𝑤2, . . . , 𝑤𝑚)𝑇 ∈ Rm. It is proposed to obtain this
by applying columns’ aggregation method, to the squared
matrix𝐴: (𝑎𝑖𝑗), of the order𝑚, positive (𝑎𝑖𝑗 ∈ R/𝑎𝑖𝑗 > 0),
of diagonal elements one (𝑎𝑖𝑖 = 1), reciprocal (𝑎𝑖𝑗, 𝑎𝑗𝑖 = 1)
and generally inconsistent (𝑎𝑖𝑗 ̸= 𝑎𝑖𝑘, 𝑎𝑘𝑗), which is obtained
when comparing pairwise, employing the Saaty numerical
scale [12–17], the𝑚acceptability criteria considered.
Taking this into account and considering the algebraic properties of the matrices of the pairwise comparison to be “consistent,” it is proposed to obtain an estimate of the weights
vector w by applying the following calculation scheme [18,19].
(a) Normalization of the pairwise comparison matrix𝐴
dividing each of its components by the sum of the elements of the column to which it belongs. By doing
this, matrix𝐴𝑁is obtained, in which the sum of the
elements of each column is equal to one.
(b) Calculation of the components of the vector which approximates the weights vector w as the arithmetical mean of the elements situated in each row of the
normalized matrix𝐴𝑁.
(c) Validation of the consistency, through the so-called consistency ratio (R.C.).
To carry out the latter, taking into account that, if the
pairwise comparison matrix𝐴of order𝑚of positive diagonal
elements one and reciprocal is not consistent, it holds that
its dominant eigenvalue𝜆max ≥ 𝑚is equal if, and only if,𝐴
is consistent, a coefficient (C.I. = consistency index) will be defined given by
C.I. = 𝜆max𝑚 − 1− 𝑚, (4)
where
𝜆max =𝑘1
𝑘 ∑ 𝑗=1
𝑗th component of𝐴wvector
𝑗th component of w vector (5)
which will be employed to measure the degree of consistency of the value judgments emitted by the decision-maker when constructing the pairwise comparison matrix of the accept-ability criteria. The nearer to zero the C.I. value, the better the global consistency of the matrix; in fact, if the matrix is consistent, it will be verified that C.I. = 0.
Calibrating the coefficient C.I. making use of the coef-ficient C.I.A. (= random consistency index), obtained by simulation with random matrices of the same order, gives the so-called consistency ratio:
R.C. = C.I.AC.I. . (6)
Verifying that, if R.C. ≤0.1, the degree of consistency
of the pairwise comparison matrix is acceptable, but if
R.C. >0.1, some serious inconsistencies may arise and it is
recommendable to revise the value judgments emitted by the decision-maker when constructing the matrix.
Knowing the values𝑃𝑖𝑗and𝑤𝑗,𝑖 = 1, 2, . . . , 𝑛,𝑗 = 1, 2,
. . . , 𝑚, to establish the aggregate acceptability index𝐼𝑖𝐴,𝑖 = 1,
2, . . . , 𝑛, of each of the 𝑛agrarian regions considered, it is
necessary to define in Rma function “distance between the
vector of normalized values” reached by the𝑖th region P𝑖𝑗=
(𝑃𝑖1, 𝑃𝑖2, . . . , 𝑃𝑖𝑚)𝑇 and the ideal vector 1 = (1, 1, . . . , 1)𝑇.
With this aim in mind, the following distance functions are introduced:
𝐿𝑝(1,P𝑖𝑗) = [
[ 𝑚 ∑ 𝑗=1
𝑤𝑝𝑗 (1 − 𝑃𝑖𝑗)𝑝]
] 1/𝑝
, 1 ≤ 𝑝 < ∞
=max[
[
𝑤𝑗(1 − 𝑃𝑖𝑗)
1≤𝑗≤𝑚 ] ]
, 𝑝 = ∞.
(7)
The first expression defined adds the normalized and weighted proximity degrees of all the acceptability criteria
considered at their ideal value, proving that, as metric 𝑝
increases, more importance is given to the larger deviations, whereas the second expression is limited to finding the maximum normalized and weighted degree of proximity of all the acceptability criteria at its ideal value.
Specifying metric 𝑝 in (7), the aggregate acceptability
index value for the𝑖th agrarian region will be given by the
following expression:
𝐼𝑖𝐴= 𝐿𝑝(1,P𝑖𝑗) . (8)
This conductual axiom, introduced in the decision theory of Zelany in 1974 [20], is a behavior postulate firmly rooted in psychology, which permits taking into account the prefer-ences of the decision-making center and ranks hierarchically the different possible alternatives.
The application of Zeleny axiom to the whole of the
aggregate acceptability index𝐼𝑖𝐴,𝑖 = 1, 2, . . . , 𝑛, obtained by
applying(8)to each of the agrarian regions considered, will
permit the obtainment of their hierarchical selection order. Acting in this way, the first district in the hierarchy will be the one with the lowest aggregate acceptability indicator (i.e., the district which minimizes the distance between the vectors
P𝑖𝑗and 1 defined previously).
To calculate in a computationally simple way𝐼𝑖𝐴, defined
by the generally nonlinear formula(8)for any value of the
metric𝑝, it is proposed to use the following convex linear
combination [21,22]:
(1 − 𝜆) 𝐿𝑝(1,P𝑖𝑗)]
𝑝=∞+ 𝜆𝐿𝑝(1,P𝑖𝑗)]𝑝=1 (9)
for values of𝜆 ∈ [0.1].
Specifying the value of𝜆in(9)and considering(7)give
𝐼𝑖𝐴= (1 − 𝜆){{
{
max[
[
𝑤𝑗(1 − 𝑃𝑖𝑗)
1≤𝑗≤𝑚 ] ] } } }
+ 𝜆∑𝑚
𝑗=1
𝑤𝑗(1 − 𝑃𝑖𝑗) .
(10)
In expression(10), analogically to𝑝in(8),𝜆is a control
parameter, which not only permits one to obtain different hierarchical rankings of the districts but, most importantly, enables the manifestation of different preference structures from the decision-making center with respect to their rank-ing.
“The most acceptable region” for𝜆 = 1is the one with
the best aggregate characteristics, namely, the district which maximizes the weighted sum of the accomplishment of the acceptability criteria. This additive solution is “the best” in aggregate terms but it may be unacceptable in practical ones. Actually, a large aggregate average may be compatible with a poor evaluation of any one of the criteria, which may make the region in question ineligible in selection terms.
“The most acceptable region” for𝜆 = 0 is the one for
which the deviation of the criterion most displaced from its ideal value is minimized. Therefore, the region which maximizes the equilibrium between the achievements of the different acceptability criteria considered is “the best one.”
Taking into account these considerations, in the applica-tion of the methodology proposed, it is recommended to give
𝜆a value belonging to the open interval(0, 1), which obtains
good aggregate and balanced characteristics for the region in carrying out all the acceptability criteria considered.
2.5. GIS Analysis for the Localization of the Agroindustry. The development of the last stage of the methodology will determine the optimal site for a small biomass power plant (2.2 MW) in each of the agrarian regions making up the study area, provided that the necessary biomass potential exists there.
This process, carried out by using Geographic Informa-tion Systems, consists of two steps.
(1) A diagnosis of the suitable areas for the location of bioelectricity plants based on a series of preestab-lished criteria.
(2) The determination of the municipality within each agrarian region around which a low range of action is necessary for the obtainment of the total biomass required to supply a 2.2 MW plant.
3. Application of the Proposal Methodology to
the Madrid Community
3.1. Potentially Available Surface. It is to calculate the
poten-tially usable surface, a scenario in which 50% of the rainfed fallow land is considered to triticale cultivation.
3.2. Setting-Up of the Triticale Biomass Production Model. This means the generation of a model resulting from the combination of the biomass/grain ratio and a grain yield model based on climatological data.
3.2.1. Grain Production Model. This consists basically of
correlating rainfall and temperature data with trial values of known triticale grain yields.
For its development, mean values of triticale grain yield were used. These are compiled in “Encuesta sobre Superfi-cies y Rendimientos” (ESYRCE) of the MAGRAMA during the cropping seasons 2008-2009, 2009-2010, 2010-2011 and 2011-2012, and rainfall and temperature data from different weather stations located in the Madrid Community and which have been provided by “Agencia Estatal de Meteo-rolog´ıa” (AEMET).
Table1details the grain yield estimated in kg/ha and the
location of the trials.
To obtain the models, multiple regression logarithmic curves were used and it was established that, for the equations
to be valid, the determination index (𝑅2), which shows the
percentage of the variability of the data, had to be higher than 0.8 in each case.
After analyzing the triticale grain yield data with respect to its normalized climate variables, the yield model in tons per hectare was obtained:
Triticale grain yield (t/ha)
=2.4495∗ln(TN+2∗PN) +2.6103. (11)
The determination index (𝑅2) for grain yield model was
of 0.9804, so that the characteristics desired were fulfilled. To calculate the triticale grain yield at a municipality level, the normalized average of a climatological series of 30 years (1971–2000) provided by the AEMET was used.
3.2.2. Biomass/Grain Ratio. To calculate the biomass
Table 1: Average grain yield in kg/ha of triticale trials carried out in the Madrid Community associated with the closest weather stations
and mean temperature (𝑇𝑎) in∘C and accumulated rainfall (𝑃) in mm from Octuber to June in each of the seasons considered. Source:
MAGRAMA/AEMET.
Season Average yield (kg/ha) Weather station 𝑇𝑎(∘C) 𝑃(mm)
2008-2009 1,941 MADRID/GETAFE 12.4 263.8
2009-2010 2,350 VALDEMORILLO 10.7 403.7
2009-2010 2,689 MADRID/GETAFE 12.3 454.9
2009-2010 2,600 VILLAMANRIQUE TAJO (BODEGONES) 11.4 455.3
2010-2011 2,100 VILLAMANRIQUE TAJO (BODEGONES) 11.1 311.1
2010-2011 2,250 MADtRID/GETAFE 12.6 337.6
2010-2011 2,385 VILLAVICIOSA DE ODON 11.4 402
Table 2: Average yields of grain and dry biomass (g/m2) and
biomass/grain ratio of each triticale variety for irrigation of 348.8 mm/year.
Variety Total grain
(g/m2)
Dry biomass
(g/m2)
Biomass/grain ratio
Amarillo 232.88 510.00 2.19
Trujillo 197.07 500.55 2.54
Colegial 140.10 361.45 2.58
Bienvenu 267.94 533.20 1.99
Average 209.50 476.30 2.27
Table 3: Average yields of grain and dry biomass (g/m2) and
biomass/grain ratio of each variety of triticale for irrigation of 462.1 mm/year.
Variety Total grain
(g/m2)
Dry biomass
(g/m2)
Biomass/grain ratio
Amarillo 230.08 756.95 3.29
Trujillo 266.31 774.95 2.91
Colegial 153.83 481.50 3.13
Bienvenu 330.37 842.45 2.55
Average 245.15 713.96 2.91
With the third replication of each triticale variety for each irrigation type, a second harvest was carried out at the end of the dry grain state. The aim of this second harvest was to determine the grain yield and establish the biomass/grain ratio of each of the varieties. The results for each type of
irrigation are indicated in Tables2and3.
The average biomass/grain ratio for triticale was of 2.595. According to the trials carried out in the Madrid Commu-nity by the Agroenergy Group of Polytechnic University of Madrid in the municipalities of Quijorna and Daganzo de Arriba and in the practice fields of the ETSIA during the cropping seasons 2009-2010 and 2010-2011, collected in the PSE On Cultivos [23], the average biomass/grain ratio for the triticale varieties was of 2.633. Thus, the value obtained in the experiment, despite only having been developed during one cropping season, was considered as being acceptable for entering in the triticale biomass production model.
3.2.3. Biomass Production Model. By associating the average
biomass/grain ratio obtained in the experiment with the grain yield model, the model for biomass production in tons per hectare of triticale (where TN = normalized mean tempera-ture and NP = normalized accumulated precipitation) can be determined:
Triticale biomass production (t/ha)
=2.595∗ [2.4495∗ln(TN+2∗PN) +2.6103] . (12)
3.3. Potential Triticale Biomass Production. Starting from
the surface available and the triticale biomass production model, biomass potential at a municipality level in the Madrid Community can be quantified on the basis of the triticale crop.
It is planned to store the biomass in collection centers adjacent to the urban nuclei of each municipality, from where it can all be transported faster and more efficiently.
3.4. Multicriteria Analysis for the Determination of the Agrar-ian Region with the Best Conditions for Installing the Power
Plants. It is aimed at defining the agrarian region with the
best characteristics for the installation of electricity plants powered by biomass. For this purpose, the different alterna-tives and criteria have to be defined.
Alternatives: these will be the six agrarian regions of the
Madrid Community ( ´Area Metropolitana, Campi˜na,
Gua-darrama, Lozoya-Somosierra, Sur Occidental, and Vegas),
shown in Figure2.
Criteria, described from greater to lesser importance, 3 of which are favorable (the maximum value is of interest), 4 are limiting (the minimum value is awarded), and one is exclusionary [24]:
(i) Biomass Potential (Tm/Km2). This is the most important
criterion. Imposing limitations whereby a plant must be situated near the extraction area of the raw material mean that, similarly, in turn, both the surfaces where it is possible to place the facilities and that potential will increase. Further-more, a greater potential would permit the power generation of a hypothetical plant to be enhanced. This is a favorable criterion.
(ii) Electricity Infrastructure (Number of Substations/Km2).
Toledo Madrid
Segovia
Guadalajara Soria
Cuenca Valladolid
Vegas Sur Occidental
Lozoya Somosierra
Guadarrama
Area Metropolitana de Madrid
N
(km)
0 5 10 20 30 40
vila
́
A
Campi añ
Figure 2: Location of the agrarian regions of the Madrid Commu-nity.
when distributing the power generated by the plant. The better the electricity network available, the lower the costs of investing in infrastructure for that distribution will be, which facilitates the siting of the plant. This is a favorable criterion.
(iii) Road Network (Km/Km2). A good communications
infrastructure signifies a reduction in the costs of the energy and increases the surface accessible for the collection of the raw material, thus enabling the use of a larger amount. This is a favorable criterion.
(iv) Water Availability. This criterion will not, in principle,
establish dominance relationships between the different alter-natives since the water required by this type of installation practically functions in a closed circuit, so that a greater availability than the minimum required is of no advantage. This criterion will therefore generally be exclusionary: if any of these alternatives does not present a feasible way of obtaining the necessary volume of water it will automatically be eliminated. After analyzing this fact in each of the agrarian regions, none of them have been excluded for that reason.
(v) Protected Natural Spaces (% of Protected Surface).Another
way of introducing the environmental component into the study is by penalizing those alternatives which are of an important environmental wealth, so that the impact of
installations such as those described will be as low as possible. This criterion is a limiting one.
(vi) Urban Nuclei (% of Urban Surface).The surface occupied
by urban nuclei will not be considered as being apt for the installation of biomass power plants. This is a limiting criterion.
(vii) Plants Installed (Number of Stations/Km2). The presence
of some type of plant powered by biomass in any of the agricultural regions could diminish the amount of biofuel available for a newly built one. This circumstance may be used to penalize the regions with any initiative already in force. However, if there are no such installations, this criterion will not establish any dominance relationships. This would be a limiting criterion.
(viii) Slope of the Land.To set up the plant, the area must not
have a very steep slope. This is a limiting criterion.
Since the multicriteria analysis will be made in agricul-tural regions, it is reasonable to predict that in each of them there is some land with a suitable slope for the installation of the plant, so that the slope criterion will not be taken into account. Neither the water availability criterion nor that of the plants installed will establish any dominance relationships, so that finally 5 criteria will be used to carry out the study:
(i) biomass potential (BIOMASS),
(ii) number of substations per agrarian district (SUBSTA-TIONS),
(iii) road network (ROADS),
(iv) % natural protected spaces (NPS), (v) % urban nuclei surface (NUCLEI).
To apply the methodology proposed, each of the criteria has to be quantified in the regions with the aim of enabling the ranking of the different alternatives. To carry out this process, digital mapping treatment through Geographic Information Systems will be resorted to.
3.5. GIS Analysis for the Location of a Bioelectricity Plant in the
Best Agrarian Region of Madrid Community. To determine
the best site for a small (2.2 MW) biomass plant in the region with best assessment, a process is followed in two stages.
(1) Diagnosis of suitable areas in the Community of Madrid for the setting-up of biomass plants based on the following conditions.
(a) Presence of an electric power substation at a radius of under 10 km.
(b) Impossibility of installing a biomass power plant at a radius of under 2 km around the different urban nuclei.
(c) Impossibility of installing it at a radius of under 2 km around the protected natural spaces exist-ing in the Madrid Community.
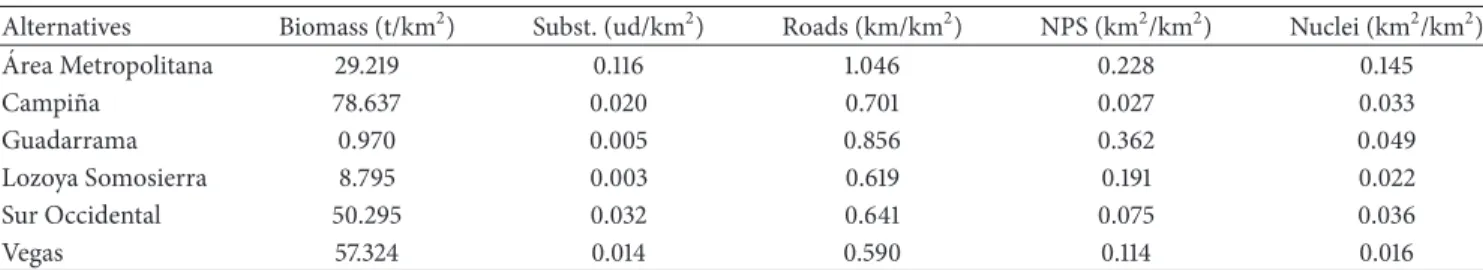
Table 4: Values (𝑃𝑖𝑗) per unit of surface of the acceptability criteria reached by each of the agrarian regions of the Madrid Community.
Alternatives Biomass (t/km2) Subst. (ud/km2) Roads (km/km2) NPS (km2/km2) Nuclei (km2/km2)
´
Area Metropolitana 29.219 0.116 1.046 0.228 0.145
Campi˜na 78.637 0.020 0.701 0.027 0.033
Guadarrama 0.970 0.005 0.856 0.362 0.049
Lozoya Somosierra 8.795 0.003 0.619 0.191 0.022
Sur Occidental 50.295 0.032 0.641 0.075 0.036
Vegas 57.324 0.014 0.590 0.114 0.016
Table 5: Normalized values of the acceptability criteria (𝑃𝑖𝑗) reached
by each of the agrarian regions in the Madrid Community.
Alternatives Biomass Subst. Roads NPS Nuclei
´ Area
Metropolitana 0.364 1.000 1.000 0.399 0.000
Campi˜na 1.000 0.157 0.244 1.000 0.864
Guadarrama 0.000 0.022 0.584 0.000 0.739
Lozoya
Somosierra 0.101 0.000 0.064 0.511 0.954
Sur Occidental 0.635 0.255 0.111 0.855 0.840
Vegas 0.726 0.098 0.000 0.740 1.000
(e) The plant’s distance from the road network cannot be over 1.5 km.
(2) Determination of the lowest range of action for obtaining the total biomass necessary to supply a plant of 2.2 MW in the region considered.
Once suitable areas for installing the bioelectricity plants in the Madrid Community have been localized, the munic-ipality around which a lower range of action is needed to obtain all types of the biomass necessary to supply the plant should be determined in the region considered.
Only the potentially usable biomass from those munici-palities whose centroids are included in the range of action will be computed, since for its collection storage centers adjacent to the urban nuclei of each of them are planned.
The optimal area for the location of the plants will be the surface within the suitable areas corresponding to the municipality around which the range of action will be fixed.
4. Results
4.1. Hierarchization of the Regions. Applying the
methodol-ogy proposed, the following results are obtained.
The six agricultural regions will be ranked according to the value reached by their aggregate acceptability indicator. With regard to the potential biomass criterion, values associ-ated with the utilization of 50% of the rainfed fallow land for each of the regions are employed.
Table4shows the evaluation𝑃𝑖𝑗,𝑖 = 1, 2, . . . , 6,𝑗 = 1, 2,
. . . , 5, reached by each of the regions when they are evaluated following each of the five acceptability criteria considered.
Table 5shows the normalized evaluation 𝑃𝑖𝑗, 𝑖 = 1, 2,
. . . , 6,𝑗 = 1, 2, . . . , 5, reached by each of the six regions when
they are evaluated according to each of the five acceptability criteria considered. It should be remembered that, in this context, zero denotes “the worst” value (the anti-ideal one) whereas 1 denotes the “best” value (the ideal one).
Also, it is assumed that matrix𝐴(of positive elements,
diagonals one, reciprocal and inconsistent) of the pairwise comparison of the acceptability criteria considered is
( ( ( ( ( ( ( ( (
(
1 3 4 5 6 1
3 1 2 3 4
1 4
1
2 1 2 3
1 5
1 3
1
2 1 2
1 6
1 4
1 3
1
2 1
) ) ) ) ) ) ) ) )
)
, (13)
whereas the normalized matrix𝐴𝑁is
( (
(
.5128 .5902 .5106 .4348 .3750 .1709 .1967 .2553 .2609 .2500 .1282 .0984 .1277 .1739 .1875 .1026 .0656 .0638 .0870 .1250 .0855 .0492 .0426 .0435 .0625
) )
)
. (14)
Calculating the average of each row of matrix 𝐴𝑁,
an estimation is obtained of the weights vector w whose components are as follows:
(i)𝑤1(BI) = 0.4847,
(ii)𝑤2(SB) = 0.2268,
(iii)𝑤3(RO) = 0.1431,
(iv)𝑤4(NPS) = 0.0888,
(v)𝑤5(NU) = 0.0566.
The consistency index of matrix 𝐴is 0.0248, while the
random consistency index of a matrix of order 5 is 1.115, so that it holds that the consistency ratio
R.C. = C.I.
C.I.A =
0.0248
1.115 = 0.0222 < 0, 1. (15)
With these data, by applying the Zeleny axiom to the
Table 6: Values of the aggregate acceptability index (𝐼𝑖𝐴) for𝜆= 0.5 reached for each of the regions and their hierarchical rating.
Alternatives 𝐼𝑖𝐴 Order
Campi˜na 0.2493 1
Sur Occidental 0.3320 2
Vegas 0.3541 3
´
Area Metropolitana 0.3634 4
Lozoya Somosierra 0.6393 5
Guadarrama 0.6771 6
different values of𝜆, the different rankings of the considered
alternatives showing different preference structures from the decision-making center can be accomplished.
In this study, the calculation of the aggregate acceptability index and the hierarchical ordering of the regions was done
for𝜆 = 0.5(Table6), which is the average value between the
maximum aggregate evaluation (𝜆 = 1) and the maximum balanced evaluation (𝜆 = 0).
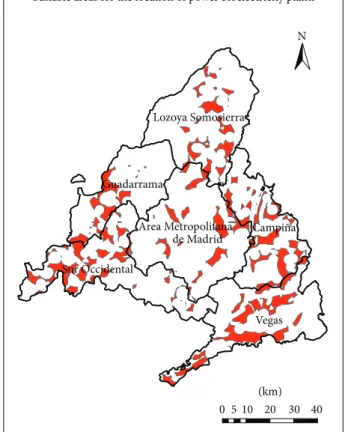
4.2. Location of Plants by GIS. Figure3shows the final surface
available in the agrarian regions of the Madrid Community for the location of plants powered by biomass, based on the criteria established.
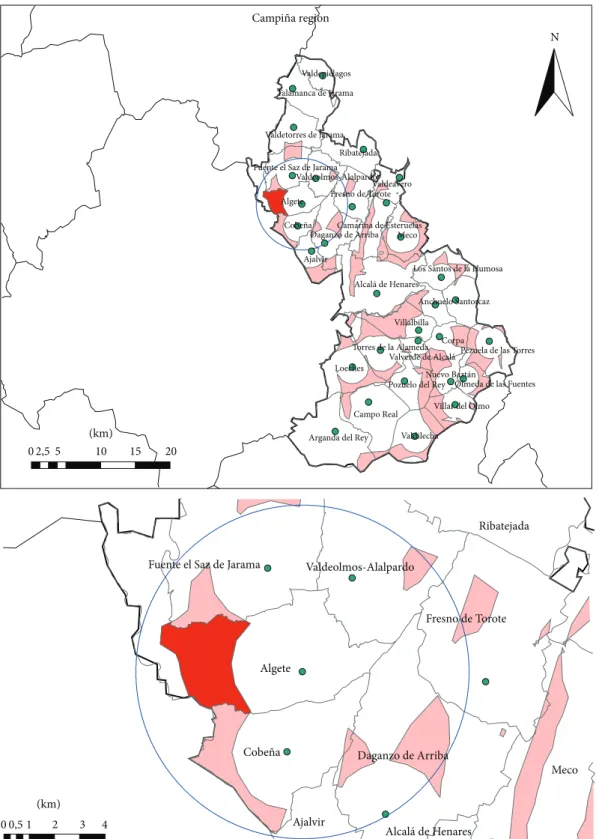
In this section, the results of the biomass plant installation in the region with the best evaluation in the multicriteria analysis are given: Campi˜na.
The minimum range of action for obtaining the necessary biomass would be 6.6 km around the municipality of Algete and would comprise the centroids of the municipalities of Cobe˜na, Daganzo de Arriba, Fuente el Saz de Jarama, Valdeolmos-Alalpardo, and Algete itself. The potentially usable biomass using 50% of the rainfed fallow land in the
Campi˜na region would be allocated as follows (Figure4):
(i) Algete: 3,937.50 t.
(ii) Cobe˜na: 2,694.93 t.
(iii) Daganzo de Arriba: 4,515.26 t. (iv) Fuente el Saz de Jarama: 4,137.57 t.
(v) Valdeolmos-Alalpardo: 3,145.41 t.
The total biomass which could be made available in considering this range would therefore be 18,430.68 t.
5. Conclusions
The triticale productivity model developed in this work is a good example of the yields obtained in the trials carried out in different areas of the Madrid Community.
On making a hierarchical ranking of the agrarian regions
of the Madrid Community for𝜆 = 0.5(seeking a balance
between the maximum equilibrated and aggregate evalu-ation), the Campi˜na region is the most suitable for the installation of electricity plants powered by triticale biomass on the basis of the criteria of biomass potential, electricity infrastructure, road networks, protected spaces, and urban
Vegas Sur Occidental
Lozoya Somosierra
Guadarrama
Area Metropolitana de Madrid
Suitable areas for the location of power bioelectricity plants
(km)
0 5 10 20 30 40
N
Campi añ
Figure 3: Suitable areas for the location of bioelectricity plants in the Madrid Community.
nuclei surface. Lozoya-Somosierra and Guadarrama are the worst considered.
The methodology developed could be perfectly applied to other areas at the same latitude and with similar climatology. To satisfy the requirements of a bioelectricity plant of 2.2 MW, a minimum of 17,339.9 t of triticale would be necessary. The results obtained when determining the most suitable location of this type of plant in Campi˜na region are municipality of Algete and a range of action of 6.6 km for the obtainment of necessary biomass (18,430.68 t).
If a larger power plant had been chosen, the action radius would increase considerably and this would lead to logistical problems and also a fee reduction per kWh produced.
Web Pages
Consider the following:
(i) Agencia Estatal de Meteorolog´ıa http://www.aemet
.es/es/portada.
(ii) Aplicaci´on SIGA. Ministerio de Medio Ambiente y
Medio Rural y Marino http://www.mapa.es/es/sig/
pags/siga/intro.htm.
(iii) Centro de Investigaciones energ´eticas,
medioambien-tales y tecnol´ogicashttp://www.ciemat.es/.
(iv) European Commissionhttp://ec.europa.eu/research/
Meco Algete
Loeches
Campo Real
Arganda del Rey Alcalá de Henares
Corpa
Valdilecha Villalbilla Ribatejada
Cobeña
Ajalvir
Daganzo de Arriba
Anchuelo Santorcaz
Torres de la Alameda Pezuela de las Torres
Villar del Olmo Pozuelo del Rey Fresno de Torote
Talamanca de Jarama
Valdeavero Valdetorres de Jarama
Camarma de Esteruelas
Nuevo Baztán Los Santos de la Humosa Fuente el Saz de Jarama
Valdepiélagos
Valdeolmos-Alalpardo
Valverde de Alcalá
Olmeda de las Fuentes
Algete
Cobeña Daganzo de Arriba
Fresno de Torote Ribatejada
Ajalvir
Valdeolmos-Alalpardo Fuente el Saz de Jarama
Alcalá de Henares
Meco Campiña region
02,5 5 10 15 20
(km)
00,51 2 3 4
(km)
N
(v) Instituto para la Diversificaci´on y Ahorro de la
Energ´ıahttp://www.idae.es/.
(vi) On Cultivoshttp://www.oncultivos.es/.
Conflict of Interests
The authors declare that there is no conflict of interests regarding the publication of this paper.
Acknowledgments
The authors would like to thank the Agroenergy Group of UPM and the Construction and Fabrication Engineering Department of UNED the support provided for the prepa-ration of this work.
References
[1] Fundaci´on de la Energ´ıa de la Comunidad de Madrid,Balance
Energ´etico de la Comunidad de Madrid en el a˜no 2010, 2012. [2] Instituto para la Diversificaci´on y Ahorro de la Energ´ıa (IDAE),
Biomasa: Cultivos energ´eticos, IDAE, 2007.
[3] A. Rocha, F. E. Bert, M. M. Skansi et al., “Pron´ostico de rendimiento de los cultivos de granos en la regi´on pampeana a trav´es del uso de modelos de simulaci´on agron´omica,” Modelo de Simulaci´on Ceres, UBA, Buenos Aires, Argentina, 2012.
[4] N. Picard, L. Saint-Andr´e, and M. Henry, Manual de
con-strucci´on de ecuaciones alom´etricas para estimar el volumen y la biomasa de los ´arboles, CIRAD/FAO, 2012.
[5] M. H. Kutner, C. Nachtsheim, and J. Neter, Applied Linear
Regression Models, Lavoisier, 4th edition, 2004.
[6] M. ´Alvarez, “ ´Ultimos avances en Sistemas de Informaci´on
Geogr´afica,” in Ciclo de Videoconferencias del Gabinete de
Teleeducaci´on, UPM, 2004.
[7] E. Mart´ınez, M. ´Alvarez, ´A. Arquero, and M. Romero, “Apoyo
a la selecci´on de emplazamientos ´optimos de edificios. Local-izaci´on de un edificio mediante el Proceso Anal´ıtico Jer´arquico
(AHP),”Informes de la Construcci´on, vol. 62, no. 519, pp. 35–45,
2010.
[8] C. Romero,An´alisis de Las Decisiones Multicriterio, Isdefe, 1996.
[9] D. C. Montgomery, E. A. Peck, and G. G. Vining,Introduction
to Linear Regression Analysis, Wiley Series in Probability and Statistics, John Wiley & Sons, 5th edition, 2012.
[10] J. Fern´andez,Energ´ıa de la biomasa. Energ´ıas renovables para
todos, Iberdrola, 2008.
[11] L. D´ıaz-Balteiro and C. Romero, “In search of a natural systems
sustainability index,”Ecological Economics, vol. 49, no. 3, pp.
401–405, 2004.
[12] T. L. Saaty,The Analytic Hierarchy Process, McGraw-Hill
Inter-national, New York, NY, USA, 1980.
[13] T. L. Saaty and L. G. Vargas, “Comparison of eigenvalue, loga-rithmic least squares and least squares methods in estimating
ratios,”Mathematical Modelling, vol. 5, no. 5, pp. 309–324, 1984.
[14] T. L. Saaty, “Axiomatic foundation of the analytic hierarchy
process,”Management Science, vol. 32, no. 7, pp. 841–855, 1986.
[15] T. L. Saaty, “Highlights and critical points in the theory and
application of the analytic hierarchy process,”European Journal
of Operational Research, vol. 74, no. 3, pp. 426–447, 1994.
[16] T. L. Saaty and G. Hu, “Ranking by eigenvector versus other
methods in the analytic hierarchy process,”Applied
Mathemat-ics Letters, vol. 11, no. 4, pp. 121–125, 1998.
[17] T. L. Saaty, “Decision-making with the AHP: why is the
prin-cipal eigenvector necessary,”European Journal of Operational
Research, vol. 145, no. 1, pp. 85–91, 2003.
[18] J. Gonz´alez-Pach´on and C. Romero, “Analysis of pairwise
com-parison matrices,” inWiley Enciclopedia of Operations Research
and Management Science, pp. 1–9, 2011.
[19] J. Gonz´alez-Pach´on, L. Diaz-Balteiro, and C. Romero, “How to combine inconsistent ordinal and cardinal preferences: a
satisficing modelling approach,”Computers & Industrial
Engi-neering, vol. 67, no. 1, pp. 168–172, 2014.
[20] M. Zelany, “A concept of compromise solutions and the method
of the displaced ideal,”Computers and Operations Research, vol.
1, no. 3-4, pp. 479–496, 1974.
[21] F. J. Andr´e and C. Romero, “Computing compromise solutions: on the connections between compromise programming and
composite programming,”Applied Mathematics and
Computa-tion, vol. 195, no. 1, pp. 1–10, 2008.
[22] M. A. Mart´ın, M. L. Cuadrado, and C. Romero, “Computing efficient financial strategies: an extended compromise
program-ming approach,”Applied Mathematics and Computation, vol.
217, no. 19, pp. 7831–7837, 2011.
[23] PSE OnCultivos,Proyecto Singular y Estrat´egico para el
desar-rollo, demostraci´on y evaluaci´on de la viabilidad de la producci´on de energ´ıa en Espa˜na a partir de biomasa de cultivos energ´eticos, CIEMAT, 2011.
[24] F. Hidalgo,An´alisis multicriterio para la ´optima ubicaci´on de una
Submit your manuscripts at
http://www.hindawi.com
Hindawi Publishing Corporation
http://www.hindawi.com Volume 2014
Mathematics
Journal ofHindawi Publishing Corporation
http://www.hindawi.com Volume 2014
Mathematical Problems in Engineering
Hindawi Publishing Corporation http://www.hindawi.com
Differential Equations
International Journal of
Volume 2014
Hindawi Publishing Corporation
http://www.hindawi.com Volume 2014 Hindawi Publishing Corporationhttp://www.hindawi.com Volume 2014
Hindawi Publishing Corporation
http://www.hindawi.com Volume 2014
Mathematical PhysicsAdvances in
Complex Analysis
Journal of Hindawi Publishing Corporationhttp://www.hindawi.com Volume 2014
Optimization
Journal of Hindawi Publishing Corporationhttp://www.hindawi.com Volume 2014
Combinatorics
Hindawi Publishing Corporation
http://www.hindawi.com Volume 2014
International Journal of
Hindawi Publishing Corporation
http://www.hindawi.com Volume 2014
Journal of
Hindawi Publishing Corporation
http://www.hindawi.com Volume 2014
Function Spaces
Abstract and Applied Analysis Hindawi Publishing Corporation
http://www.hindawi.com Volume 2014
International Journal of Mathematics and Mathematical Sciences
Hindawi Publishing Corporation http://www.hindawi.com Volume 2014
The Scientific
World Journal
Hindawi Publishing Corporation
http://www.hindawi.com Volume 2014
Hindawi Publishing Corporation
http://www.hindawi.com Volume 2014
Discrete Dynamics in Nature and Society
Hindawi Publishing Corporation
http://www.hindawi.com Volume 2014
Hindawi Publishing Corporation
http://www.hindawi.com Volume 2014
Discrete Mathematics
Journal ofHindawi Publishing Corporation