Users’
perceptions
and
willingness
to
pay
in
interurban
toll
roads:
identifying
differences
across
regions
from
a
nationwide
survey
in
Spain
JuanGómez AnestisPapanikolaou Jose´ ManuelVassallo
Abstract Users’ acceptability is considered one of the key drivers for the successful
implementationoftransportpolicymeasures. Thisisespeciallycrucialinthecaseoftoll
roadssincetheyarefinancedthroughdrivers’contributions.Previousliteratureinthisfield
has mainly focused on measuring users’ attitudes towards urban congestion pricing
strategies.Howeverlimitedresearchhasbeendevelopedconcerninginterurbantollroads.
Previousresearchshowsthatsocioeconomicvariablesarenotconclusivetoexplainusers’
perceptionstowardstolls.Bycontrast,otherdriverssuch asregionaldifferences seemto
playa more importantrole, especiallywhenchargingconditions within the same nation
greatly vary across regions. This paperanalyzes regionaldifferences in users’ attitudes
within an asymmetrical distributionof the tollroad networkacross regions. Basedon a
nationwide surveyconductedtoroad usersininterurbantoll roadsinSpain,wedevelop
both abinomiallogitandacensoredregression(tobit)modeltoexploredrivers’
percep-tionsandwillingnesstopay.Theresearchconcludesthatusersfromregionswithamore
extensivetollednetworkgenerallyshowamorenegativeattitudetowardscharges,butnot
necessarily a lower willingness to pay. The paperalso points out that an asymmetrical
distributionof toll roadsacross regionsmay resultin negative perceptionsamongthose
Keywords Users’perceptionsWillingnesstopayTollroadsLogitmodelTobit
model Spain
Introduction
Budgetaryrestrictionsfacedbynationalgovernmentsinthelastdecadeshaveledthemto
limit their expenditure in publicpolicy priorities, such as road infrastructure, and seek
alternative funding mechanisms. As a result, tolls and road user fees have increasingly
become a common option to collect stable resources for funding road projects (Matas and
Raymond2003),bothintheUnitedStatesandmanyEuropeancountries.Roadcharging
represents a powerful means to raise funds, but mayalso change travel conditions and
users’choicesinthe transportnetwork.Inthisrespect,itis generallyagreedthat users’
acceptabilityisoneofthekeydriverstoachieveasuccessfultransportpolicy(Kockelman
et al. 2009), especially when it comes to road pricing strategies. Policy makers must seek to
recommendoptionsthatnotonlyhavestrongpublicsupport,butarealsodesirableinterms
of equity, ability to generate stable revenues, capacity to encourage environmentally
responsiblechoices,etc.(DillandWeinstein2007).
Despitetheincreasingliteratureonattitudestowardstollsandacceptabilityofroaduser
charges, several research gaps can be identified. Firstly, there is limited previous research
focusing on interurban contexts, what contrasts with the broad literature on urban areas.
Secondly, stated-preference surveys on free roads are often employed, with a limited
usefulnesssincepotentialusersareaskedaboutchoicestheymayhavenotexperiencedor
arenoteasyforthemtoimagine(OdeckandKjerkreit2010).
Existing literature on users’ perceptions towards tolls has traditionally analyzed the
influence of socioeconomic factors (age, income, trip purpose, etc.), but has not
gen-erally got to conclusiveandcoincident results abouttheir influence on attitudes (Yusuf
et al.2014). Additionally,someauthors(Rienstraet al.1999; SchadeandSchlag2000)
have pointed out that socioeconomic factors may have a somewhat lesser impact on
acceptability than do attitudinal factors. In certain occasions, the latter may be rather
determined by features scarcely analyzed in the literature, such as the quality of the
alternative freeroad,ifavailable, andregionaldifferenceson tollroadswithinthe same
nation. In this respect, regional approaches to road transport have mainly focused on
very few specific topics such as road safety (Tolon-Becerra et al. 2013; Eksler et al.
2008).
Spain can be considered a representative case of an interurban highway network
asymmetrically distributed across regions. While a significant percentage of the high
capacitynetwork is tolledin certain territories,other areas are provided with free high
qualityroads.Thisheterogeneityhasgeneratednegativesentimentstowardsroadcharging
inthose regionsespecially enduringthe burdenoftolls. Thisfactmakes Spainan
inter-estingcasetoanalyzepotentialdifferencesintollroadusers’attitudesacrossregions.
The aim of this paper is to establish a first approach to explore regional differences on
road users’perceptionstowardstollroads. Particularly,itseekstoidentifypotential
dif-ferencesonusers’attitudesandwillingnesstopay(WTP)asaresultofanasymmetrical
distribution of toll roads across regions. Furthermore, the relationship between users’
perceptionsandtheirdeclaredWTPisaddressed.Basedonanationwidesurveyconducted
in interurban toll roads in Spain, we develop both a binomial logit and a censored
regression (tobit) model to explore users’ perceptions and WTP. This research has some
with those ones developed for Norway in Odeck and Brathen (2008; Odeck and Kjerkreit
2010)— conducted in interurban toll roads already in operation. The network considered,
with a total of 2264 km, is also among the longest interurban toll road systems ever surveyed in the literature. Furthermore, the model specification we use includes some explanatory variables barely analyzed to measure users’ perceptions towards toll roads, such as the quality of the free parallel road. This paper focuses just on perceptions and attitudes among road drivers. Consequently, potential influences coming from the existence of alternative modes (rail, air) have not been considered. Finally, the research covers an interesting case in the international context, given the marked heterogeneity of toll roads across regions in Spain.
This paper is organized as follows. After this introductory chapter, ‘‘Literature review’’
section summarizes the state of knowledge regarding users’ perceptions towards tolls, and provides some brief insight about the history and main characteristics of the Spanish
interurban toll network. ‘‘The Spanish toll road network’’ section outlines the methodology
of this research. ‘‘Methodology’’ section makes a description of the survey conducted to
road users. ‘‘The data: a nationwide survey in Spanish toll roads’’ section presents and
discusses the results. Finally, ‘‘Choice modeling results and discussion’’ section sets out the
main conclusions and points out further research.
Table 1 Overview of the influence of different socioeconomic parameters on attitudes towards tolls
Author (year) Podgorski and
Kockelman (2006)
Dill and Weinstein
(2007)
Odeck and Brathen
(2008)
Odeck and Kjerkreit
(2010)
Chen and
Wen (2014)
Context Texas residents California
residents
Road users in Norway
Road users in Norway
Road users in Taiwan Explanatory
variables included
Trip length N.s.s. N.s.s. – N.s.s. –
Travel frequency
– – – – –
Age N.s.s. ?? N.s.s. ??
Gender S.s. S.s. N.s.s.
Education ?? ??
Employment S.s.
Income N.s.s. N.s.s. ??
Political leaning
S.s.
Level of information
?? ??
Type of vehicle S.s.
Travel purpose N.s.s. S.s.
Who pays the toll
N.s.s.
??Statistical positive influence; – statistical negative influence
Literature
review
Previousstudies onattitudes towardstollshave mainlyfocusedon urbancontexts, with
special attention to the implementation of congestion charging systems in city centers
(FurstandDieplinger2014;Gehlertetal.2011; KottenhoffandFreij2009;Gauntetal.
2007). By contrast, the literature analyzing users’ perceptions on interurban areas is limited
and primarily deals with American High Occupancy/Toll (HOT) lanes, such as Zmud et al.
(2007)andGolob(2001).Theterms‘perceptions’and‘attitudes’havebothbeenusedin
the literatureasalmost synonymstoaddressusers’ viewtowardstolls. Thesetermsare
differenttousers’behavior,whichreflectsthechoiceactuallyfollowedbytherespondents.
The acceptability of toll road pricing constitutes a complex matter that can be
approached in a number of ways (Di Ciommo et al. 2013). Previous research studies in this
field have analyzed the influence of socioeconomic factors (age, income, trip purpose, etc.)
onusers’perceptionstowardstolls.Theresultsofthesestudiesareusefultotargetspecific
usermarketsegmentsaswellaspredictfuturebehaviorofcitizens.Nevertheless,theyhave
notgenerallyledtoconclusiveandcoincidentresultsabouttheinfluenceofthesevariables
on users’ attitudes (Odeck and Kjerkreit 2010; Gehlert et al. 2011), as can be seen in
Table 1.
In this respect, some authors (Rienstra et al. 1999; Schade and Schlag 2000) have
pointed out that socioeconomic factors mayhave a somewhat lesser impact on
accept-abilitythandoattitudinalfactors.Thelattermaybedeterminedbyaspectssuchastheuse
of toll revenues (Schuitema and Steg 2008; Jaensiriak et al. 2005), the perceived fairness of
charges (Bonsall et al. 2007; Schade and Baum 2007), existing community values or
politicalleanings(Yusufetal.2014).Allthesefactorscanleadtoregionaldifferenceson
users’perceptionstowardstolls,especiallywhenchargingconditionsgreatlyvaryacross
territorieswithinthe samenation.
Previousresearch studiesaddressingregionaldifferenceson roadtransportarescarce
and mainly limited to analyze specific topics such as road safety (Tolon-Becerra et al.
2013; Eksler et al. 2008; Lassarre and Thomas 2005). Regarding acceptability towards
road charges, only differences between residents in urban and rural areas have been
addressed.AccordingtoPodgorskiandKockelman(2006),ruralareasinTexasaremore
supportivefortollingwhencomparedtourbancontexts,likelybecauseresidentsmightbe
thinking of tolls not applied to roads in their areas. Also focusing in Texas, Kockelman
et al. (2009) identified regional differences in terms of supporting different proposed
congestionpricing policies.Inthe sameline,the studybyDill andWeinstein(2007) in
Californiafoundmoresupportfortollinginruralorsmallerurbanareas.Ascanbenoticed,
these papers did not specifically focus on users’ attitudes but on public perceptions in
general.
For the case of Europe, the research on users’ acceptability in the Norwegian toll
network by Odeck and Brathen (2008and Odeck and Kjerkreit 2010) can be considered the
most relevant study, and also the only study addressing users’ attitudes towards tolls
nationwide.Theseauthorsunderlinedtheimportanceofthelevelofinformationsupplied
touserspriortothe implementationofroadcharging.WithregardtoSpain,noprevious
studies have been undertaken specifically to investigate users’ perceptions towards toll
roads.
On the other hand, literatureregardingWTP in toll roads is extensive andtypically
focusesonmanagedlanes.Acomprehensivereviewoftheexistingresearchcanbefound
characteristics influencing the value of time (VOT) (Rose and Hensher2014; Burris et al.
2012; Amador et al.2005). However, to our knowledge no effort has been made to analyze
potential differences in WTP across regions. In Spain, Asensio and Matas (2008) and
A´ lvarez et al. (2007) calculated the VOT in specific road corridors made up of a toll
motorway and a free parallel road, but they did not make a nationwide analysis. This paper aims to contribute to the existing literature in the following aspects. First,
along with the studies conducted by Odeck and Kjerkreit (2010) in Norway, to our
knowledge, this is one of the few nationwide surveys that analyze users’ attitudes in interurban toll roads already in operation. Second, it constitutes a first insight concerning regional differences on users’ attitudes and WTP caused by an asymmetrical road transport policy. Finally, we include variables barely used in previous studies to explain users’ perceptions towards tolls, such as the quality of the free alternative road.
The Spanish toll road network
With a total of 16,582 km, Spain has currently one of the longest high capacity road networks within Europe. Given the scarcity of quality roads in the nation until the mid-1960s, a great effort was made over the last decades to build an extensive road network to promote economic growth and territorial cohesion among regions. As of 2013 toll road concessions were 18.2 % of the high capacity network currently in operation (Ministerio
de Fomento2014), what also makes Spain one of the longest national tolled networks in
the world.
Since the early 1970s, more than 3000 km of toll highway concessions have been put in
operation (Matas et al.2012). Nevertheless, Spanish toll roads are far from constituting a
homogeneous network throughout the country. They were built in different periods, and are
asymmetrically distributed over the territory. According to Vassallo et al. (2012), three
different periods can be identified in the development of the road network in Spain:
• First period (1962–1975): Despite the aim of the government to provide the nation with
a modern high capacity network, the budgetary resources were not enough to finance the program through public funds. In order to develop these high investment road projects, several toll highways were granted by the government to private concession-aires. The toll highways built during this period were mainly located in the most industrialized regions such as Catalonia, the Basque Country, Valencia, etc.
• Second period (1975–1995): The petroleum crisis in the 1970s destabilized the Spanish
economy and postponed further extensions of the high capacity network. Later, the socialist government elected in 1982, which was politically opposed to road charging, promoted new road projects in the country fully financed through the public budget. The program built free highways, many of them connecting Madrid with the most important Spanish cities. The new program aimed at alleviating the deficit of road infrastructure in less developed regions, not served in the previous period.
• Third period (1996–2008): The need to contain the public deficit, as a prerequisite for
Consequently, the current situation in Spain is a tolled network asymmetrically located
throughout the country. As can be seen in Table2and Fig.1, great contrasts can be found
in the Spanish high capacity network. While regions such as Catalonia, Valencia or Galicia have an extensive tolled network (above 300 km), other territories such as Extremadura, Cantabria or Asturias have few, or even no, tolled kilometers. As we mentioned above, this
is a result of the historical evolution of road policy in the country (see Fig.1). At the
beginning of the 1980s, high capacity roads in Spain were scarce and mainly comprised tolled sections concentrated in few regions. It was not until the 1990s and early 2000s that the high capacity network significantly increased and spread over most of the territory, generally financed through the public budget.
The current national toll network comprises two different types of toll roads. Firstly, few of the toll sections are tunnels, where a fixed toll is charged for crossing them. In terms of unitary values, toll rates for light vehicles in this type of infrastructure are quite expensive, lying from 0.143 Euro/km (Eje Aeropuerto tunnel) to 0.49 Euro/km (Artxanda tunnels). However, the vast majority of the toll network surveyed is made up of interurban road stretches (99.6 % of tolled km), where users are charged per km driven. Toll rates within this group are lower —they range between 0.07 and 0.10 Euro/km for light vehi-cles–, and fairly homogeneous over the territory. Furthermore, tolls in Spain vary across
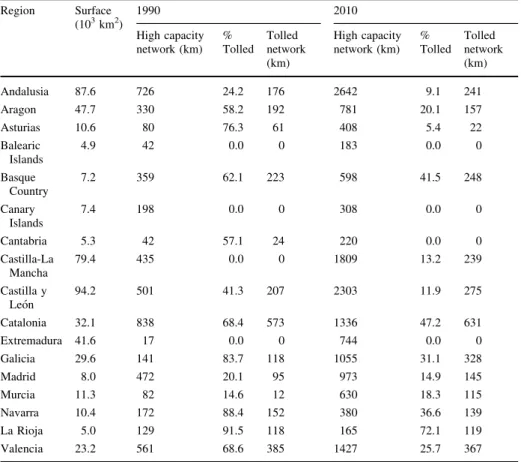
Table 2 Evolution of the interurban high capacity and toll road network in Spanish regions (1990–2010)
Region Surface
(103km2)
1990 2010
High capacity network (km)
% Tolled
Tolled network (km)
High capacity network (km)
% Tolled
Tolled network (km)
Andalusia 87.6 726 24.2 176 2642 9.1 241
Aragon 47.7 330 58.2 192 781 20.1 157
Asturias 10.6 80 76.3 61 408 5.4 22
Balearic Islands
4.9 42 0.0 0 183 0.0 0
Basque Country
7.2 359 62.1 223 598 41.5 248
Canary Islands
7.4 198 0.0 0 308 0.0 0
Cantabria 5.3 42 57.1 24 220 0.0 0
Castilla-La Mancha
79.4 435 0.0 0 1809 13.2 239
Castilla y Leo´n
94.2 501 41.3 207 2303 11.9 275
Catalonia 32.1 838 68.4 573 1336 47.2 631
Extremadura 41.6 17 0.0 0 744 0.0 0
Galicia 29.6 141 83.7 118 1055 31.1 328
Madrid 8.0 472 20.1 95 973 14.9 145
Murcia 11.3 82 14.6 12 630 18.3 115
Navarra 10.4 172 88.4 152 380 36.6 139
La Rioja 5.0 129 91.5 118 165 72.1 119
vehicle types, with toll rates applied to heavy vehicles being around 50 % higher than to light vehicles.
The regional asymmetry of the tolled network has been one of the reasons why people in certain regions have a sentiment of unfairness for enduring the burden of tolls. While drivers in Catalonia or Valencia have been paying tolls for decades, regions such as Castilla y Leo´n, Castilla-La Mancha or Andalusia have been provided with many free high
capacity roads in the last 20 years (see Table2). Territorial inequity in this respect is an
issue repeatedly claimed and proposed in the political agenda by nationalist parties in regions such as Catalonia. Furthermore, social movements and associations have recently appeared at the regional level to coordinate protests and actions towards tolls, claiming for undergoing charging unfairness compared to the rest of Spaniards. This is the case of the
so-calledNo vull pagar(in Catalan, ‘‘not wanting to pay’’) movement, present in the region
of Catalonia and, to a lesser extent, in Valencia. Since 2012, this movement has occa-sionally organized protests in existing toll roads, encouraging drivers to cross tollgates without paying the toll and collapsing toll plazas for hours.
Methodology
In order to measure users’ perceptions and WTP in interurban toll roads, we develop both a binomial logit and a censored regression model. The main characteristics of each statistical specification are summarized below. The predictors to calibrate these models were obtained from a survey that will be described in the following section.
Binary choice models to measure users’perceptions
The study employs binary choice models in order to measure the effect of certain socio-economic factors and regional characteristics on users’ attitudes and choices towards the
use of toll roads. Particularly, respondents were asked in the survey (see ‘‘Methodology’’
section) whether they considered tolls as an appropriate mechanism to fund roads. This answer represented the dependent variable of the binary choice specification.
behavior. Rational choice models assume that a person chooses the alternative with the
higher utility (Ben-Akiva and Lerman1995; Train2003) among all the options available.
The utility of each choice can be determined by a number of parameters related to both personal attributes of the individual (X) and characteristics of the alternative itself (S),
which are described below (see ‘‘Methodology’’section). Then the utility in the model is
approached as follows:
Uik ¼fðXik;SikÞ ð1Þ
where Uikis the utility gained by individual k for choosing alternative i. Uikis considered a
random variable and therefore consists of a sum of observed variables Vik—systematic or
representative component of the utility— and random componentseik:
Uik¼Vikþeik¼bkXikþeik ð2Þ
where is Xika vector of measurable characteristics that define utility, such as age, income,
trip frequency, etc.; andbkis a vector of parameters to be estimated (Louviere et al.2006).
Economic theory assumes that the individual k will choose the option with the highest
utility (Uik[Ujk). In the general form of a binary choice model, the probability that
respondent k will choose alternative i is expressed as (Ben-Akiva et al. 1985):
Pi¼
eVik P
jeVij
ð3Þ
Then, the binary logistic regression predicts the logit of the odds ratio, Li, given
mul-tiple explanatory variables Xi(Peng and So2002):
Li¼ln
Pi
1Pi
¼aþb1X1þb2X2. . .þbkXk ð4Þ
As a result of this linearization process, the interpretation of the bi coefficients is
different compared to the ones from lineal regression models. In this case, the slope
coefficient suggest that for a unit increase in a certain explanatory variable Xk, the
weightedlogoftheoddsinfavorofacertainalternative(Y=1)increasesbyebk.More
appealingly, for a unit increase in a certain explanatory variable Xk, the odds ratio in favor
of happening Y = 1 increases by ebk.
Logit models adopt several distributional assumptions that differ with the usual
regression models. Apart from the independence of the error termsand lack of
multi-collinearity problems in the sample, this specification assumes linearityof independent
variables and logs of the odds ratio. Furthermore, the model resort to nonlinear estimating
procedures using the method of maximum likelihood (Gujarati and Porter 2004), so a quite
largesamplesizeis required.
Tobitspecificationto measureusers’willingnesstopay(WTP)
Censored regression (tobit) models are employed in situations where the information on
thedependentvariableisavailableonlyforsomeobservations(GujaratiandPorter2004).
This is the caseof oursurvey, whereusers wereasked about hypothetical situationsin
order to assess their WTP for specific scenarios (see ‘‘Methodology’’ section). In this
respect, we found two types of users: those willing to use toll roads by paying a certain
constraints or personal beliefs. In case we wanted to calculate a regression including the whole sample, we would find that no information would be available related to the WTP (from now on WTP) for the second group of users, so we have a censored sample.
In order to deal with the data from respondents not willing to use toll roads, we adopted
a censored regression (tobit) model. According to Nolan (2002), the formulation of the
underlying model would be:
Yi¼bXiþei ð5Þ
where Y* is a continuous latent variable, Xi is a matrix of explanatory variables,bis a
vector of coefficients to be estimated, andeiis a vector of normally distributed error terms.
On the other hand, the observed variable (Yi) is defined by:
Yi¼Yi if Yi[0
Yi¼0 if Yi.0
ð6Þ
It is important to highlight that thebcoefficients represent the effect of Xion the latent
variable Y*, but not on the observed variable Y, which is the difference with the linear
regression model. As can be seen, the explanatory variables (Xi) in the tobit model affect
both the decision of individuals to choose/not to choose a specific alternative, as well as the
intensity of their choice (Tsekeris and Dimitriou2008). In contrast with logit models, tobit
specifications adopt the same distributional assumptions as standard regression models so coefficients of these models should be interpreted in the usual way.
The combination of logit and tobit models for analyzing users’ perceptions and WTP, respectively, constitutes a noteworthy methodological point of this research. In strict terms, it should be acknowledged that distinguishing attitudes from actual behavior and WTP can be better estimated through revealed preference (RP) Surveys. Nevertheless, a comparison between perceptions and stated-preference choices from real users of the toll network can also be a valuable approach to address such an issue. This procedure will allow a better understanding of the modeling results, which will lead to more efficient policy recommendations.
The data: a nationwide survey in Spanish toll roads
The data used in this research was collected from a nationwide survey developed in several Spanish interurban toll roads in 2010. It was addressed to users of interurban toll roads, both frequent and occasional ones, though also comprised potential users living close to the existing tolled infrastructure. The survey was conducted between October and November, 7-days a week with the aim to get a representative sample in terms of trip purpose. Depending on the type of user and the characteristics of the toll road, the data was collected from either phone questionnaires or personal interviews at service areas or petrol stations. We stratified the sample in order to achieve sufficient representation at the regional level.
Further details about this survey can be found in Gomez and Vassallo (2014).
The paper is primarily aimed at identifying regional differences with regard to two main questions: users’ perceptions towards toll roads and their WTP in interurban contexts. The
questionnaire, divided into two main parts (see details in Appendix 1), was especially
the choice model described above. For the case of potential users, trip purpose was not asked since this subgroup in the sample never used toll roads before. Further comments about the explanatory variables in the questionnaire are included below.
The second part of the survey was related to drivers’ attitudes regarding toll roads. In order to estimate general acceptability towards tolls, users were asked whether they con-sidered tolls as an appropriate way to finance road infrastructure, in a similar way as in
Odeck and Brathen (2008). This has been an approach previously adopted in the literature
to account for users’ perceptions towards road charges.1Their answers at this point formed
the dependent variable for the binary choice model detailed in subsection 3.1. Additionally, they reported their perceptions towards current toll rates. In this respect, it is important to note that it is a requirement that every toll concession in Spain has a free parallel road available in the corridor.
Finally, the questionnaire concluded with a simple stated-preference choice to measure users’ WTP in different scenarios. Respondents were presented a corridor made up of a free road and a parallel toll highway which allows the driver to save travel time (TT). For a given 60- and 180-min trip in the free road, drivers were asked in open answer about the
amount they would be willing to pay for specific TT savings (TTsav) in the case of using the
toll road. Therefore, respondents directly reported their WTP in different scenarios, what is particularly interesting in the case of frequent and occasional users. This information became the dependent variable for the tobit model described in subsection 3.2.
As this paper is mainly focused on identifying regional differences in users’ attitudes,
respondents in the sample were surveyed in a balanced way (see Table3below) from some
of the regions with the largest toll road network. The survey focused on regions with mature toll roads, where user charging was implemented decades ago, and those ones with a more modern toll network. We also included some variability regarding the quality of the
free parallel road (see Appendix2). Catalonia, Madrid, Valencia, the Basque Country and
Galicia were the cases ultimately selected for this research. Other regions with a significant length tolled (Andalusia, Castilla-La Mancha, Castilla y Leo´n) were not included because toll roads are not spread in a homogeneous way throughout the territory, but are con-centrated on specific areas. This makes the analysis more difficult in these cases, since users’ perceptions towards tolls may widely vary over the same region. A constant specific variable for each region was included in the model in order to identify potential regional differences and capture the influence of region-specific factors, such as the presence of an anti-toll atmosphere in certain territories.
The network included in the survey comprises all the interurban toll roads starting and/ or ending in the 5 regions selected. With a total of 2264 km, this sample can be considered representative of the Spanish toll network, as it includes around 75 % of total tolled km in the country. We would like to note that it is an extensive network when compared to other
toll systems previously analyzed, both interurban toll networks (Odeck and Kjerkreit2010;
Zmud et al.2007) or toll point facilities, such as bridges or tunnels (Yusuf et al. 2014;
Gordon and Peters2011).
The quality of the free parallel road available may constitute a significant explanatory factor to determine users’ perceptions, since it increases the ability to avoid tolls. For the
network surveyed, great asymmetry can be observed regarding this point (see Appendix2).
Tolled sections competing with free highways are numerous in regions such as Madrid, while in the Basque Country or Catalonia the alternative route is generally formed by a
1
conventional (two-lane) road, with poor characteristics. The research also measures the influence of additional variables on users’ attitudes, such as unitary toll rates applied (taking into account the type of vehicle driven by the user) and the type of tolled infras-tructure (interurban road/tunnel), since each one follows a different charging scheme. This research does not consider the potential influence of alternative transport modes (rail, air) on users’ attitudes, since the survey is addressed to people who mostly travel by car.
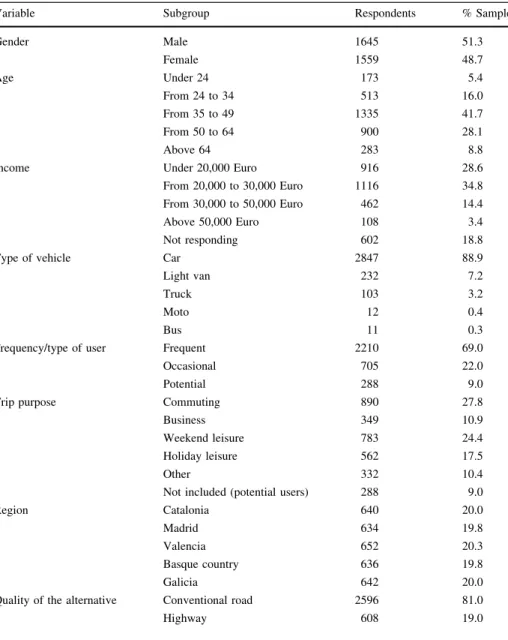
Table3 summarizes the main characteristics of the sample used for the two analyses
conducted in this research: users’ perceptions and WTP. A balanced proportion of men and women can be observed, as well as the distribution of respondents across regions. Table 3 Summary of characteristics in the sample
Variable Subgroup Respondents % Sample
Gender Male 1645 51.3
Female 1559 48.7
Age Under 24 173 5.4
From 24 to 34 513 16.0
From 35 to 49 1335 41.7
From 50 to 64 900 28.1
Above 64 283 8.8
Income Under 20,000 Euro 916 28.6
From 20,000 to 30,000 Euro 1116 34.8
From 30,000 to 50,000 Euro 462 14.4
Above 50,000 Euro 108 3.4
Not responding 602 18.8
Type of vehicle Car 2847 88.9
Light van 232 7.2
Truck 103 3.2
Moto 12 0.4
Bus 11 0.3
Frequency/type of user Frequent 2210 69.0
Occasional 705 22.0
Potential 288 9.0
Trip purpose Commuting 890 27.8
Business 349 10.9
Weekend leisure 783 24.4
Holiday leisure 562 17.5
Other 332 10.4
Not included (potential users) 288 9.0
Region Catalonia 640 20.0
Madrid 634 19.8
Valencia 652 20.3
Basque country 636 19.8
Galicia 642 20.0
Quality of the alternative Conventional road 2596 81.0
Furthermore, we identify a higher presence of people aged between 35 and 49, whose income typically lies below Euro 30,000, and a vast majority of cars (88.9 %) regarding the type of vehicle used. It is noticeable the high proportion of respondents (18.8 %) not reporting their income. Commuting (27.8 %) and weekend leisure (24.4 %) are the most common trip purposes in the sample, with a high proportion of respondents (69.0 %) making more than 8 trips per month (frequent users). These variables mainly comprise the explanatory parameters considered for this research, apart from some minor additions commented below.
Choice modeling results and discussion
This section reports the main findings from the analysis. Subsection 5.1 presents the results of modeling users’ perceptions towards toll roads through a binomial logit specification. Estimates of the tobit model measuring drivers’ WTP are displayed in Subsection 5.2.
Users’ perceptions towards interurban toll roads
Before showing the estimates calculated through the binomial logit specification described
in ‘‘The Spanish toll road network’’ section, some preliminary results are presented (see
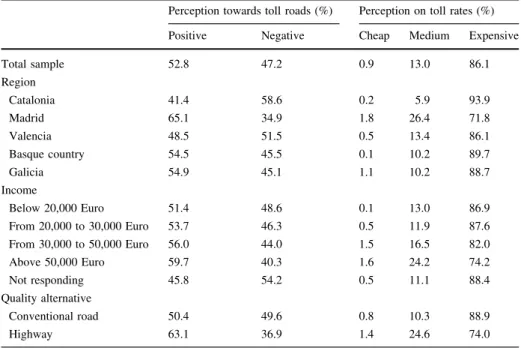
Table4) for certain explanatory variables. Concerning the general perception on toll roads,
the majority of respondents (52.8 %) were positive towards the application of tolls to finance road infrastructure. Nevertheless, this attitude does not seem to be homogeneous throughout the country when we disaggregate the results by regions.
Table 4 Users’ perceptions towards toll roads and toll rates
Perception towards toll roads (%) Perception on toll rates (%)
Positive Negative Cheap Medium Expensive
Total sample 52.8 47.2 0.9 13.0 86.1
Region
Catalonia 41.4 58.6 0.2 5.9 93.9
Madrid 65.1 34.9 1.8 26.4 71.8
Valencia 48.5 51.5 0.5 13.4 86.1
Basque country 54.5 45.5 0.1 10.2 89.7
Galicia 54.9 45.1 1.1 10.2 88.7
Income
Below 20,000 Euro 51.4 48.6 0.1 13.0 86.9
From 20,000 to 30,000 Euro 53.7 46.3 0.5 11.9 87.6
From 30,000 to 50,000 Euro 56.0 44.0 1.5 16.5 82.0
Above 50,000 Euro 59.7 40.3 1.6 24.2 74.2
Not responding 45.8 54.2 0.5 11.1 88.4
Quality alternative
Conventional road 50.4 49.6 0.8 10.3 88.9
Highway 63.1 36.9 1.4 24.6 74.0
As can be seen, users’ acceptability in Catalonia is low (41.4 %), while in Madrid is particularly high (65.1 %) when compared to other regions in the sample. Furthermore, drivers’ attitudes towards toll roads appear to be more positive as income increases. We can also observe that the level of acceptability is higher for those drivers using a toll road competing with a high quality alternative.
Regarding users’ perceptions on toll rates, not modeled afterwards, we find that the majority of users (86.1 %) considered that toll rates applied are too high. Catalonia is the region with the most negative perception towards the level of toll rates (93.9 %), while Madrid is again the least negative (71.8 %). Given the fairly homogeneous toll rates applied throughout the country, the reason behind regional differences may be the asymmetrical density of toll roads and existence/absence of high quality free alternatives when compared to other territories. The network in some regions forces drivers, in a certain way, to use toll roads to save TT.
It can also be observed that, the higher the income (particularly above 50,000 Euro), the less negative users’ attitudes towards toll rates. This is in line with other previous results
referred to in the literature (Odeck and Kjerkreit2010). Finally, focusing on the influence
of the alternative road, we notice that users are less negative to toll rates when the free parallel road happens to be a highway.
In order to check the validity of these preliminary findings, a binomial logit specifi-cation has been calibrated. The model estimates the probability of being positive towards toll roads —that is, to consider tolls as an appropriate mechanism to fund roads— and measures the influence of different explanatory variables on this attitude. Before setting up the logit model, some tests for checking multicollinearity between the explanatory vari-ables modeled were applied, showing no significant interactions.
The majority of explanatory variables in the model are categorical, so a base case needs to be chosen as a reference to better identify potential differences in users’ perceptions (see
Table5). With regard to the region parameter, we have selected the Basque Country as the
base case, since it seems to represent an intermediate position in terms of users’ attitudes,
given the preliminary results in Table4. Then, it allows us to approach whether users’
perceptions in the rest of the regions, either positive (Madrid) or negative (Catalonia, Valencia), are statistically significant when compared to the base case.
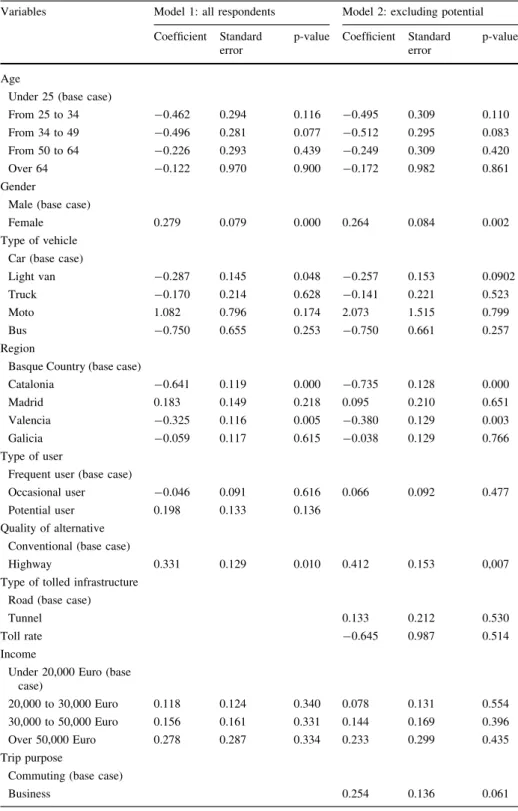
In order to properly calculate the influence of each variable on users’ perceptions, two different models have been calibrated. The first one (Model 1) includes the whole sample, and is mainly aimed at calculating how attitudes may vary depending on the type of user: potential, occasional and frequent. However, Model 1 is not able to estimate all the explanatory variables, since data related to e.g. trip purpose are not available for potential users. Consequently, a second logistic specification (Model 2) has been calculated for actual users —frequent and occasional ones— of the tolled network: In this case, it is possible to include two additional explanatory variables: toll rates and type of tolled infrastructure.
Table5 includes empirical results from both models. As can be seen, coefficients
remain fairly constant for those parameters simultaneously included in models 1 and 2. The
results confirm that, as pointed out in the literature (Rienstra et al.1999; Schade and Schlag
2000), users’ acceptability is often more influenced by attitudinal factors than by individual
socioeconomic characteristics. Despite a more positive perception observed in the case of females, no statistically significant differences can be found throughout the subgroups established in terms of age, type of vehicle or income.
A less negative attitude towards toll roads is found with age, but the relationship is not
Table 5 Users’ perceptions towards interurban toll roads: estimation results
Variables Model 1: all respondents Model 2: excluding potential
Coefficient Standard
error
p-value Coefficient Standard
error
p-value
Age
Under 25 (base case)
From 25 to 34 -0.462 0.294 0.116 -0.495 0.309 0.110
From 34 to 49 -0.496 0.281 0.077 -0.512 0.295 0.083
From 50 to 64 -0.226 0.293 0.439 -0.249 0.309 0.420
Over 64 -0.122 0.970 0.900 -0.172 0.982 0.861
Gender
Male (base case)
Female 0.279 0.079 0.000 0.264 0.084 0.002
Type of vehicle Car (base case)
Light van -0.287 0.145 0.048 -0.257 0.153 0.0902
Truck -0.170 0.214 0.628 -0.141 0.221 0.523
Moto 1.082 0.796 0.174 2.073 1.515 0.799
Bus -0.750 0.655 0.253 -0.750 0.661 0.257
Region
Basque Country (base case)
Catalonia -0.641 0.119 0.000 -0.735 0.128 0.000
Madrid 0.183 0.149 0.218 0.095 0.210 0.651
Valencia -0.325 0.116 0.005 -0.380 0.129 0.003
Galicia -0.059 0.117 0.615 -0.038 0.129 0.766
Type of user
Frequent user (base case)
Occasional user -0.046 0.091 0.616 0.066 0.092 0.477
Potential user 0.198 0.133 0.136
Quality of alternative Conventional (base case)
Highway 0.331 0.129 0.010 0.412 0.153 0,007
Type of tolled infrastructure Road (base case)
Tunnel 0.133 0.212 0.530
Toll rate -0.645 0.987 0.514
Income
Under 20,000 Euro (base case)
20,000 to 30,000 Euro 0.118 0.124 0.340 0.078 0.131 0.554
30,000 to 50,000 Euro 0.156 0.161 0.331 0.144 0.169 0.396
Over 50,000 Euro 0.278 0.287 0.334 0.233 0.299 0.435
Trip purpose
Commuting (base case)
the intervals established. Regarding the type of vehicle, no statistically different attitudes are found between truck and car users, despite the different percentage that tolls may represent in the total generalized cost for each case.
We can also see that the perception becomes more positive as the income increases, but a statistically significant influence cannot be concluded from this analysis, as in Dill and
Weinstein (2007) and Odeck and Brathen (2008), among others. Frequency of trips does
neither have an impact on users’ perceptions towards toll roads, even though a more positive attitude, not statistically significant, is observed for potential users. This result, in
line with Jaensiriak et al. (2005), may be caused by their expectancy of not using toll roads
in the future and, consequently, not being affected by road pricing.
Regarding actual users of toll roads (Model 2), no differences are identified in terms of trip purpose when compared to the base case (commuting). The more positive perception for business trips, not far from being statistically significant, may be caused by the fact that in some cases the employer pays for this kind of trips. Finally, interurban trips related to leisure activities also show a higher level of acceptability, likely due to the less frequency of these trips.
In contrast with the limited influence of socioeconomic variables, users’ perceptions towards toll roads in Spain seem to be more affected by attitudinal factors related to the specific context of each region. Even excluding the influence of the quality of the alter-native road, we can observe that users from Valencia, and especially from Catalonia, significantly show a more negative perception towards toll roads. As mentioned above, this opinion can be explained at the light of the historical evolution of the road network in Spain and the anti-toll atmosphere in certain regions, which is amplified by nationalist parties. While regions such as Catalonia and Valencia took advantage of the early implementation of toll roads in the early 1970s, the subsequent development of free highways in the rest of the country in later years has made the former regions to feel unfairly treated. The current asymmetry of the Spanish toll network, whereby some users have to pay tolls while other ones can drive for free in high quality roads, seems to be the reason behind the negative perception in Catalonia and Valencia.
Despite having a high density of toll roads, no meaningful results are found in the case of Galicia, since this region shows a quite similar perception than users from the Basque Country. On the other hand, people in Madrid have a more positive attitude when com-pared to the base case. Although this result is not statistically significant, it appears to be strongly connected with the fact that toll roads in this region generally have a free quality Table 5 continued
Variables Model 1: all respondents Model 2: excluding potential
Coefficient Standard
error
p-value Coefficient Standard
error
p-value
Weekend leisure 0.164 0.109 0.134
Holiday leisure 0.084 0.121 0.487
Other -0.046 0.146 0.751
Constant 0.881 0.256 0.001 0.545 0.248 0.028
-2 log likelihood -4094 -2805
q2 0.066 0.087
Table 6 Users’ willingness to pay: estimation results
Variables Model 1: all respondents Model 2: excluding potential
Coefficient Standard
error
p-value Coefficient Standard
error
p-value
Age
Under 25 (base case)
From 25 to 34 -0.305 0.239 0.201 -0.310 0.254 0.222
From 34 to 49 -0.687 0.220 0.001 -0.754 0.235 0.001
From 50 to 64 -1.457 0.225 0.000 -1.697 0.240 0.000
Over 64 -1.853 0.299 0.000 -2.204 0.321 0.000
Gender
Male (base case)
Female -0.889 0.105 0.000 -1.010 0.114 0.000
Type of vehicle Car (base case)
Light van -0.715 0.200 0.000 -0.663 0.212 0.001
Truck 0.025 0.288 0.930 0.255 0.301 0.396
Moto 0.029 0.784 0.969 0.524 0.849 0.537
Bus 0.321 0.922 0.727 0.283 0.936 0.762
Region
Basque Country (base case)
Catalonia -0.118 0.166 0.478 -0.254 0.175 0.146
Madrid 1.342 0.201 0.000 1.314 0.213 0.000
Valencia 0.744 0.161 0.000 0.726 0.171 0.000
Galicia 0.250 0.161 0.120 0.216 0.171 0.205
Type of user
Frequent user (base case)
Occasional user -0.112 0.122 0.359 -0.202 0.125 0.106
Potential user -0.750 0.187 0.000
Quality of alternative Conventional (base case)
Highway -0.495 0.174 0.004 -0.524 0.184 0.004
Income
Under 20,000 Euro (base case)
20,000 to 30,000 Euro 0.191 0.167 0.254 0.213 0.178 0.232
30,000 to 50,000 Euro -0.024 0.218 0.911 0.068 0.230 0.765
Over 50,000 Euro 1.347 0.374 0.000 1.547 0.385 0.000
Trip purpose
Commute (base case)
Business 0.524 0.181 0.003
Weekend leisure 0.662 0.145 0.000
Holiday leisure 0.867 0.164 0.000
Other 0.795 0.195 0.000
alternative. Unlike other regions, toll roads in Madrid are not perceived by the users as a burden, but an additional option to choose when the free parallel highway gets congested. Finally, we can observe that users of toll roads competing with free highways show a more positive attitude —statistically significant— towards tolls. It seems reasonable given the fact that, in these situations, users dismiss the opportunity to drive by a free quality road, probably seeking further benefits offered by toll roads, such as TT reliability or congestion avoidance. No statistical influence is found for other explanatory variables, such as toll rates, probably because they remain fairly homogeneous throughout the net-work surveyed.
Regarding the goodness of fit of the estimated results, the models present a rho-squared coefficient of 0.066 and 0.088, respectively, which may be considered acceptable for logit
specifications according to Henser and Johnson (1981). Furthermore, the signs of the
regression coefficients and their statistical and practical significance are in line with the expected results. This is actually important for binary regression models according to
Gujarati and Porter (2004).
Users’ willingness to pay (WTP)
Next, we analyze the second source of data obtained from the survey, referring to users’ WTP according to the stated-preference choice they were presented. As previously done, we point out some preliminary findings before displaying the results estimated through a censored regression (tobit) specification.
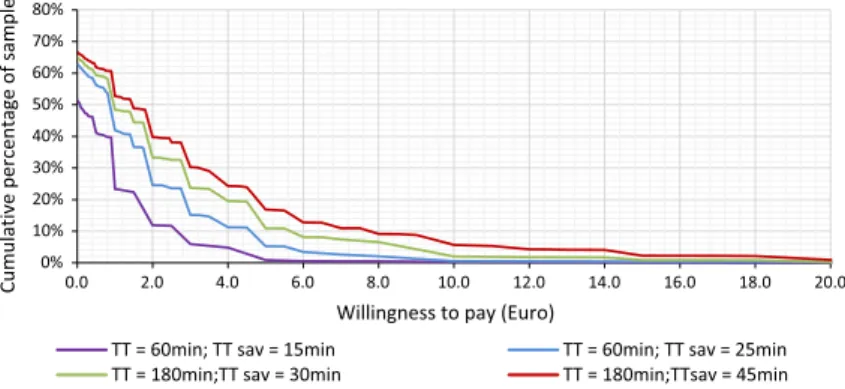
For the whole sample (all respondents), Fig.2shows the distribution of users’ WTP
depending on different TT when driving in the free road, as well as TT savings (TTsav)
offered by the parallel toll road. We present the cumulative percentage of respondents in the sample (y-axis) willing to pay the toll rate reported in the x-axis. The curves show a descending trend, since a lower percentage of the sample is willing to pay as the toll rate increases.
As seems reasonable, WTP tends to increase as TT and TT savings do. However, some results can be quite curious. The majority of the people surveyed with a positive perception towards tolls (52.8 %) do not seem to be in line with a high, or even moderate, WTP. As
can be seen in the figure, for short trips (TT=60 min) around 40–50 % of respondents are
not willing to pay at all for saving time, and around 60–80 % are not willing to pay more than 1 euro. What seems to be even more surprising is that only around 50 % of respondents are willing to pay more than 1 Euro for saving TT in interurban long trips
(TT=180 min). Although these results are not purely based on a revealed-preference
Table 6 continued
Variables Model 1: all respondents Model 2: excluding potential
Coefficient Standard
error
p-value Coefficient Standard
error
p-value
Travel time saving (TTsav) 0.185 0.022 0.000 0.186 0.023 0.000
TT * TTsav -0.001 0.000 0.000 0.001 0.000 0.000
Constant -3.211 0.567 0.000 -3.415 0.604 0.000
-2 log likelihood -21,108 -19,468
0% 10% 20% 30% 40% 50% 60% 70% 80%
0.0 2.0 4.0 6.0 8.0 10.0 12.0 14.0 16.0 18.0 20.0
Cumulative percentage of sample
Willingness to pay (Euro)
TT = 60min; TT sav = 15min TT = 60min; TT sav = 25min TT = 180min;TT sav = 30min TT = 180min;TTsav = 45min
Fig.2 Willingnesstopaydistributioninthesampledependingonthetraveltimeandtraveltimesavings
analysis—butonastated-preferencemodeltoactualusersoftollroads–,theyshowthe
lackofconnectionthatsomehowexistsbetween users’attitudesandrealbehaviorinthe
fieldofroadcharging(Fiferetal.2014;Burrisetal.2012).
Further relationships in the sample have been explored. WTP is generally lower for
potential users when compared to actual users of toll roads (both frequent and occasional),
especiallyin thecaseofshorttrips.Regarding the levelofincome,respondentsearning
above50,000EuroseemtohaveahigherWTP,particularlyforlongtrips,whiletherestof
thesamplepresentafairlyhomogeneousbehavior.
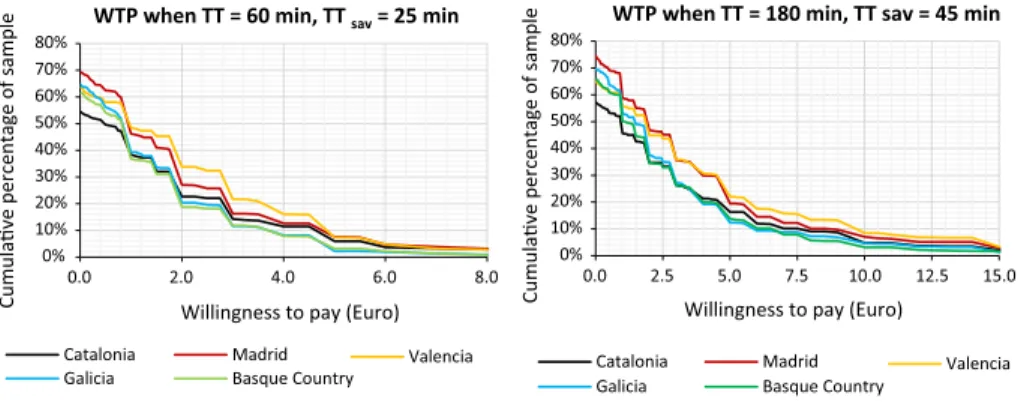
Figure 3 displays the distribution of WTP in the sample depending on the region
selected. Findings are not conclusive, but some trends may be identified. If we exclude the
results forlow tolls (left-hand sideof the figures), a quitehomogeneous distributionis
perceived inCatalonia, theBasqueCountryandGalicia.Bycontrast,WTPseemstobe
somewhathigher inthe caseofMadridandValencia.
Again,thevalidityofthesepreliminaryfindingsisfurtherexploredthroughacensored
regression (tobit) model (see Table 6). When compared to the previous logit specification
(see Subsection5.1) the explanatory variables toll rateandtypeof tolledinfrastructure
havebeen removedsince theywerenotspecifically determinedin the stated-preference
choice designed. On the other hand, the variable qualityof the alternative here is not
referringtothequalityofthefreeroadinthestated-preferencecase,buttothetripmadeby
the respondent when she/he was surveyed. This allows us to explore whether statistical
differences in users’ WTP can be identified depending on the characteristics of the toll road
she/heused.Furthermore,threeadditionalexplanatoryvariableswereaddedtothechoice
model:TTinacertainscenario(TT),TT savingofferedbythetollroad(TTsav),andthe
interactionbetween thesetwoparameters (TT*TTsav).AsithappenedinSubsection 5.1,
two different models have been calculated due to the lack of data available for potential
users with regard to trip purpose.
FromtheresultsofthetobitmodelinTable6,sometrendscanbeidentified.Itmustbe
noted that, again, coefficient estimates remain fairly constant in models 1 and 2. As
Table6 shows,WTP tendsto increaseasTT andTT savingsprovidedbythe toll road
(TTsav)do.Theresultsshowthatusersarewillingtopay,ceterisparibus,around0.02Euro
for using the toll road as the TT increases 1 min, and around 0.18 Euro as the TTsavrises
1 min. Despite being statistically significant, the interaction term (TT*TTsav) showed a
veryweakinfluenceonWTP,becausethevalueofthecoefficientestimatedwasveryclose
With regard to the socioeconomic variables included in the model, we can observe that WTP significantly tends to decrease with age, particularly for respondents aged above 50. As well as this, women are willing to pay between 0.8 and 1.0 Euro less than men. This behavior is inconsistent with women’s more positive attitude towards tolls identified in the
logit specification (see Table5). No statistical differences can be identified regarding the
type of vehicle.
Unlike results for users’ perceptions towards toll roads, WTP sometimes vary with income and type of user. Respondents belonging to the interval with the highest income
(\50,000 Euro) are statistically more willing to pay when compared to the base case, in
line with previous research (Zmud et al.2007; van den Berg2014; Borjesson et al.2012),
according to which the VOT increases with income. With regard to the type of user,
potential ones significantly show a lower WTP (-0.7 Euro) when compared to actual users
(frequent and occasional). Again, this contrasts with the higher acceptability by these types of users, probably because they do not expect to use toll roads very often. Additionally, WTP remarkably increases when the trip purpose is different from commuting. In the case of business trips, it should be caused by the fact that it is not always the employee, but in some cases the employer, who pays for the toll. Regarding leisure trips, the higher WTP may be influenced by the lower frequency of these kinds of trips, as pointed out by Cantos
and A´ lvarez (2009).
Finally, we discuss the results concerning potential differences in users’ WTP depending on the region and the quality of the free alternative. In this respect, a higher
WTP is observed for respondents from Madrid (?1.3 Euro) and Valencia (?0.7 Euro),
when compared to the base case. By contrast, respondents from the Basque Country, Galicia and Catalonia do not show statistically significant differences. If we compare these results with the estimates obtained for users’ perceptions, two different cases come up. First, some regions such as Madrid and Catalonia have a comparatively high (low) WTP, which is in line with a general positive (negative) perception towards toll roads. By contrast, it is quite surprising that the WTP reported in Galicia and Valencia follows the opposite direction as the general perception towards tolls in these regions. Again, these results reinforce the idea that perceptions reported and WTP do not necessarily come together. They also show that a road transport policy asymmetrically developed over time does not need to clearly influence users’ WTP, as it happens in the case of Valencia.
Finally, we can observe that those users driving in a toll road competing with a free
highway are significantly more reluctant to pay (-0.5 Euro) compared to toll roads in
0% 10% 20% 30% 40% 50% 60% 70% 80%
Cumulave percentage of
sample
Willingness to pay (Euro)
WTP when TT = 60 min, TT sav = 25 min
Catalonia Madrid Valencia
Galicia Basque Country
0% 10% 20% 30% 40% 50% 60% 70% 80%
0.0 2.0 4.0 6.0 8.0 0.0 2.5 5.0 7.5 10.0 12.5 15.0
Cumulave percentage of sample
Willingness to pay (Euro)
WTP when TT = 180 min, TT sav = 45 min
Catalonia Madrid Valencia
Galicia Basque Country
whichthealternativeisaconventionalroad.Thisresultmakessensebecausetheusersof
thetollroadcompetingwithafreehighwaydonotvaluethatmuchthebenefitsofferedby
the toll road given that the free alternative already provides high quality services. By
contrast, the poor characteristics of conventional roads make drivers to be more willing to
payforusingtollroads.
Conclusions
and
further
research
Inthispaperwehavedevelopedbothabinomiallogitandatobitmodeltoexploreusers’
attitudesandWTPoninterurbantollroads.Theanalysisyieldedsomeinterestingconclusions.
The first conclusion is that a positive perception towards tolls is not always related to a
higher WTP, but often to the low expectancy of using the tolled infrastructure. In this respect,
itshouldbepointedoutthat,whileacceptabilitymayonlyreflectanoverallsentimentof
fairnesstowardstolls,WTPseemstobemorecloselyrelatedtotheusers’ownexperienceand
expectedbehavior.Thisideamayprovideusefulinsightsforfutureresearchobjectives.
The second conclusion is that users’ perceptions and WTP seem to be, in certain cases, only slightly determined by personal socioeconomic characteristics. This paper has made it clear that
othervariablesbarelyexploredintheliterature,suchasregionaldifferencesorthequalityofthe
freealternativeroute,mayplayamoreimportantroleregardingtollroadsperceptions.
Thethirdconclusionshowsthatthoseregionscomparativelysufferingahigherburden
of tolls or subjected to anti-toll campaigns generally have a more negative perception
towards toll roads, but not necessarily a lower WTP. This is especially clear in cases such
asSpain,withaheterogeneoustollimplementationprocessacrossregions.
Finally, the fourth conclusion, stronglyrelated to the third one, concerns the
conse-quencesofcontinuallydevelopinganasymmetricalroadtransportpolicywithinthesame
nation.Acoordinatedand—aspossible—homogeneousimplementationofroadtransport
policies within a nation is advisable in order to avoid that some regions perceive to be
treated unfairly. A more balanced implementation across regions of pricing strategies and
roadaccessibilityprovisioncancontributetobetterdistributetheburdenofroadfinancing,
aswellastoavoidnegativeperceptionsincertainterritories.Nevertheless,thisfactneeds
tobe complementedwith furtheralternative analysis.Particularly,theconsequencesthat
changes in the current pricing policy may have on regional development and territorial
cohesion within the same country are additional aspects to be taken into account.
Fromthe results ofthispaper, some aspectscan be pointedout forfurtherresearch.
First,the influenceof attitudinalvariables onusers’ choicesandperceptionsneedtobe
explored more deeply, likely through a structural equation approach. Furthermore,
dif-ferences onacceptabilitytowardsroad chargingacross groupsofrespondents,i.e.across
regions, should be analyzed in greater detail by adopting more suitable econometric
specificationssuchasmultilevelmodels.Theinfluenceofalternativetransportmodesmay
alsobeconsideredwhenanalyzingusers’perceptionsonroadinterurbantrips.
Addition-ally,furthereffortsareneededtoestimatedifferencesbetweenattitudesreportedbyusers
andtheir revealed behavior. Finally,a cross-comparison ofusers’ perceptionsin urban/
metropolitan and interurban toll roads would be useful to identify the issues to be improved
regarding road charging policies in each context.
Acknowledgments TheauthorswishtothanktheSpanishMinistryofEconomyandCompetitiveness
(MINECO),whichhasfundedtheproject‘‘EUSupportMechanismstopromotePublicPrivatePartnerships
Appendix 1
See Table7.
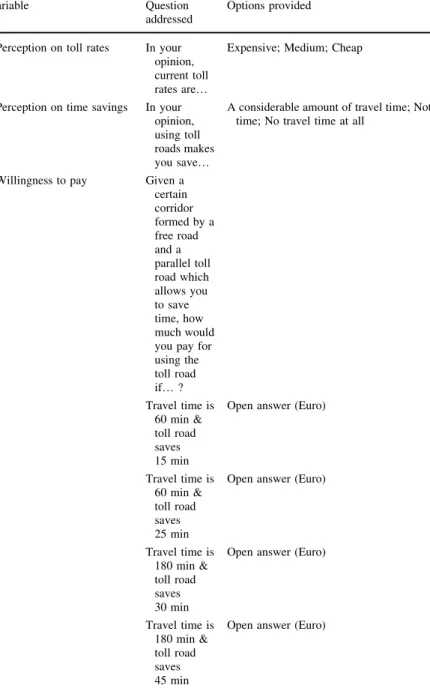
Table 7 Variables measured and questions addressed in the survey
Variable Question
addressed
Options provided
Socioeconomic characteristics
Gender Male; Female
Age Where do you
place your age in the following intervals?
Under 25; From 25 to 34; From 35 to 49; From 50 to 64; Above 64
Income Where do you
put your personal income in the following intervals?
Under 20,000; From 20,000 to 30,000; From 30,000 to 50,000; Above 50,000
Type of vehicle Car; Light van; Truck; Moto; Bus
Region Catalonia; Madrid; Valencia; Basque Country; Galicia
Frequency/type of user How often do
you use toll roads, considering the following intervals?
More than 8 trips per month (frequent user); Less than 8 trips per month (occasional user); Never used it before (potential user)
Trip purpose (only for frequent and occasional users)
What is the most common trip purpose when you use toll roads?
Commuting; Business/Work related activities; Weekend leisure; Holiday leisure; Other
Characteristic of the toll road Quality of the free
alternative
Conventional road; Highway
Toll rate Expressed in Euro/km
Tunnel Tunnel; interurban road
Attitudes towards tolls Perception towards toll
roads
Do you think that tolls are an appropriate mechanism to fund roads?
Table 7 continued
Variable Question
addressed
Options provided
Perception on toll rates In your
opinion, current toll
rates are…
Expensive; Medium; Cheap
Perception on time savings In your
opinion, using toll roads makes
you save…
A considerable amount of travel time; Not so much travel time; No travel time at all
Willingness to pay Given a
certain corridor formed by a free road and a parallel toll road which allows you to save time, how much would you pay for using the toll road
if…?
Travel time is 60 min & toll road saves 15 min
Open answer (Euro)
Travel time is 60 min & toll road saves 25 min
Open answer (Euro)
Travel time is 180 min & toll road saves 30 min
Open answer (Euro)
Travel time is 180 min & toll road saves 45 min
Appendix 2
Table8.
Table 8 Main characteristics of the toll roads included in the sample
Region Toll road Year
of start
Length (km)
Toll rate, light vehicle (Euro/km)
Regions crossed by the toll road
High capacity alternative road
Catalonia Montmelo´–La
Jonquera
1972 135.6 0.089 Catalonia Partly (3.0 %)
Montmelo´–Papiol 1978 26.6 0.092 Catalonia No
Barcelona–Tarragona 1975 96.6 0.089 Catalonia Partly (9.7 %)
Zaragoza– Mediterra´neo
1976 215.5 0.095 Catalonia,
Aragon
Partly (6.6 %)
Barcelona–Montmelo´ 1972 14.2 0.100 Catalonia Yes
Montgat–Palafolls 1969 43.1 0.087 Catalonia No
Castelldefels–El Vendrell
1992 56.3 0.163 Catalonia No
San Cugat–Manresa 1990 43.1 0.147 Catalonia No
Vallvidriera Tunnels 1992 16.7 0.206 Catalonia No
Cadı´ Tunnel 1986 29.7 0.392 Catalonia No
Tarragona-Valencia 1978 225.3 0.096 Catalonia,
Valencia
Partly (19.8 %)
Madrid Madrid–Guadalajara 2003 64.1 0.099 Madrid,
Cast.-La Mancha Yes
Madrid–Arganda 2003 33.1 0.096 Madrid Yes
Madrid–Ocan˜a 2003 53.0 0.104 Madrid,
Cast.-La Mancha Yes
Madrid–Navalcarnero 2003 29.0 0.109 Madrid Yes
Eje Aeropuerto 2005 8.8 0.143 Madrid Yes
Villalba–Adanero 1977 69.6 0.144 Madrid,
Castilla y Leo´n
No
Madrid–Toledo 2006 60.0 0.092 Madrid,
Cast.-La Mancha Yes
Valencia Tarragona–Valencia 1978 225.3 0.096 Valencia,
Catalonia
Partly (19.8 %)
Valencia–Alicante 1976 148.5 0.097 Valencia Partly (9.2 %)
Circunvalacio´n Alicante
2007 28.5 0.101 Valencia Yes
Alicante–Cartagena 2001 76.6 0.061 Valencia,
Murcia
References
A´ lvarez, O´., Cantos, P., Garcı´a, L.: The value of time and transport policies in a parallel road network.
Transp. Policy14, 366–376 (2007)
Amador, F.J., Gonzalez, R.M., Ortuzar, J.D.: Preference heterogeneity and willingness to pay for travel time
savings. Transportation32(6), 627647 (2005)
Asensio, J., Matas, A.: Commuters’ valuation of travel time variability. Transp. Res. Part E44, 1074–1085
(2008)
Ben-Akiva, M.E., Lerman, S.R.: Discrete Choice Analysis: theory and Application to Travel Demand. MIT Press, Cambridge (1995)
van den Berg, V.: Coarse tolling with heterogeneous preferences. Transp Res Part B64, 1–23 (2014)
Bonsall, P., Shires, J., Maule, J., Matthews, B., Beale, J.: Responses to complex pricing signals: theory,
evidence and implications for road pricing. Transp. Res. Part A41, 672–683 (2007)
Borjesson, M., Fosgerau, M., Algers, S.: On the income elasticity of the value of travel time. Transp Res Part
A46, 368–377 (2012)
Burris, M., Nelson, S., Kelly, P., Gupta, P., Cho, Y.: Willingness to pay for high-occupancy toll lanes.
Empirical analysis from I-15 and I-394. Transp. Res. Rec.2297, 47–55 (2012)
Cantos, P., A´ lvarez, O´.: El valor del tiempo con congestio´n: El caso de la Radial-3. Rev. de Econ. Apl.51,
55–80 (2009)
Chen, D.J., Wen, Y.H.: Effects of freeway mileage-based toll scheme on the short-range driver’s route
choice behavior. J. Urban Plan. Dev.140, 04013012 (2014)
Di Ciommo, F., Monzo´n, A., Fernandez-Heredia, A.: Improving the analysis of road pricing acceptability
surveys by using hybrid models. Transp. Res. Part A49, 302–316 (2013)
Dill, J., Weinstein, A.: How to pay for transportation? A survey of public preferences in California. Transp.
Policy14, 346–356 (2007)
Eksler, V., Lassarre, S., Thomas, I.: Regional analysis of road mortality in Europe. Public Health122(9),
826–837 (2008)
Table 8 continued
Region Toll road Year
of start
Length (km)
Toll rate, light vehicle (Euro/km)
Regions crossed by the toll road
High capacity alternative road
Basque Country
Artxanda Tunnels 2003 3.0 0.492 Basque
Country
No
Bilbao–Ermua 1976 36.2 0.087 Basque
Country
Partly (5.3 %)
Ermua–Behobia 1976 87.6 0.107 Basque
Country
No
Maltzaga–Arrasate 2003 35.6 0.107 Basque
Country
No
Bilbao–Zaragoza 1978 294.4 0.092 Basque
Country, La Rioja, Aragon
Partly (18.0 %)
Galicia Ferrol–Front.
Portuguesa
1979 218.9 0.089 Galicia Partly (14.4 %)
Santiago–Alto Sto. Domingo
2003 56.6 0.094 Galicia No
La Corun˜a–Carballo 1998 32.6 0.068 Galicia No
Fifer, S., Rose, J., Greaves, S.: Hypothetical bias in stated choice experiments: is it a problem? And if so,
how do we deal with it? Transp. Res. Part A61, 164–177 (2014)
Furst, E.W.M., Dieplinger, M.: The acceptability of road pricing in Vienna: the preference patterns of car
drivers. Transportation41(4), 765–784 (2014)
Gaunt, M., Rye, T., Allen, S.: Public acceptability of road user charging: the case of Edinburgh and the 2005
referendum. Transp. Rev.27, 85–102 (2007)
Gehlert, T., Kramer, C., Nielsen, O.A., Schlag, B.: Socioeconomic differences in public acceptability and
car use adaptation towards urban road pricing. Transp. Policy18, 685–694 (2011)
Golob, T.F.: Joint models of attitudes and behavior in evaluation of the San Diego I-15 congestion pricing
project. Transp. Res. Part A35, 495–514 (2001)
Gomez, J., Vassallo, J.M.: Percepcio´n de los usuarios potenciales, ocasionales y frecuentes a las autopistas de peaje espan˜olas. Working Paper. Universidad Polite´cnica de Madrid (2014)
Gordon, C., Peters, J.: Measuring toll burdens applying lorenz curves to a detailed data set of users of
metropolitan transportation administration bridges in New York City. Transp. Res. Rec.2221, 96–103
(2011)
Gujarati, D., Porter, D.C.: Basic Econometrics, 4th edn. The Mc Graw-Hill Companies, New York (2004) Henser, D.A., Johnson, L.W.: Applied Discrete Choice Modeling. Croom Helm, London (1981) Jaensiriak, S., Wardman, M., May, D.: Explaining variations in public acceptability of road pricing schemes.
J. Transp. Econ. Policy39, 127–153 (2005)
Kockelman, K.M., Podgorski, K.V., Bina, M., Gadda, S.: Public perceptions of pricing existing roads and
other transportation policies: the Texas perspective. J. Transp. Res. Forum48, 19–38 (2009)
Kottenhoff, K., Freij, K.B.: The role of public transport for feasibility and acceptability of congestion
charging—the case of Stockholm. Transp. Res. Part A43, 297–305 (2009)
Lassarre, S., Thomas, I.: Exploring road mortality in Europe: national versus regional realities. J. R. Stat.
Soc. Ser. A168, 127–144 (2005)
Li, Z., Hensher, D.A., Rose, J.M.: Willingness to pay for travel time reliability in passenger transport: a
review and some empirical evidence. Transp. Res. Part E46, 384–403 (2010)
Louviere, J.J., Hensher, D.A., Swait, J.D.: Stated Choice Methods: Analysis and Applications.Cambridge University Press, Cambridge (2006)
Matas, A., Raymond, J.L., Ruiz, A.: Traffic forecasts under uncertainty and capacity constraints.
Trans-portation39, 1–17 (2012)
Matas, A., Raymond, J.L.: Demand elasticity on tolled motorways. J Transp. Stat.6(2/3), 91–105 (2003)
de Fomento, Ministerio: Anuario Estadı´stico 2013. Centro de Publicaciones, Secretarı´a General Te´cnica (2014)
Nolan, A.: The determinants of urban households’ transport decisions: a microeconometric study using irish
data. R. Econ. Soc. Annu. Conf.2002, 1–42 (2002)
Odeck, J., Kjerkreit, A.: Evidence on users’ attitudes towards road user charges–A cross sectional survey of
six Norwegian toll schemes. Transp. Policy17, 349–358 (2010)
Odeck, J., Brathen, S.: Travel demand elasticities and users attitudes: a case study of Norwegian toll
projects. Transp. Res. Part A42, 77–94 (2008)
Peng, C.Y., So, T.S.H.: Logistic regression analysis: a premier. Underst. Stat.1, 31–70 (2002)
Podgorski, K.V., Kockelman, K.M.: Public perceptions of toll roads: a survey of the Texas perspective.
Transp. Res. Part A40, 888–902 (2006)
Rienstra, S.A., Rietveld, P., Verhoef, E.T.: The social support for policy measures in passenger transport. a
statistical analysis for The Netherlands. Transp. Res. Part D4, 181–200 (1999)
Rose, J.M., Hensher, D.A.: Tollroads are only part of the overall trip: the error of our ways in past
willingness to pay. Transportation41(4), 819–837 (2014)
Schade, J., Baum, M.: Reactance of acceptance? Reactions towards the introduction of road pricing. Transp.
Res. Part A41, 41–48 (2007)
Schade, J., Schlag, B.: Acceptability of Urban Transport Pricing. Research Report 72, Government Institute for Economic Research, Helsinki (2000)
Schuitema, G., Steg, L.: The role of revenue use in the acceptability of transport pricing policies. Transp.
Res. Part F11, 221–231 (2008)
Tolon-Becerra, A., Lastra-Bravo, X., Flores-Parra, I.: National and regional analysis of road accidents in
Spain. Traffic Inj. Prev.14(5), 486–495 (2013)
Train, K.: Discrete Choice Methods with Simulation. Cambridge University Press, Cambridge (2003) Tsekeris, T., Dimitriou, L.: Modeling participation and consumption in the greek interurban public
trans-portation market. J. Public Transp.11, 85–104 (2008)
Vassallo, J.M., Ortega, A., Baeza, M.A´ .: Impact of the economic recession on toll highway concessions in
Yusuf, J.E., O’Connell, L., Anuar, K.A.: For whom the tunnel be tolled: a four-factor model for explaining
willingness-to-pay tolls. Transp. Res. Part A59, 13–21 (2014)
Zmud, J., Bradley, M., Douma, F.: Attitudes and willingness to pay for tolled facilities—a panel survey
evaluation. Transp. Res. Rec.1996, 85 (2007)
Juan Gomezis a Ph.D. Candidate at the Civil Engineering School (UPM). His research activities focus on transport economics, road charging, electronic toll collection and transport modelling. He has published in prestigious journals and participated in consultancy projects in the transport area.
Anestis Papanikolaouis a data scientist (Barcelona Graduate School of Economics) and Ph.D. Candidate at the School of Rural and Surveying Engineering (AUTH). His research interests are in the intersection of transport economics, data mining/machine learning and network theory.