Using hybrid latent class model for City- HUBs’ users behaviour analysis
Floridea Di Ciommo
Senior Research Associate, Universidad Politecnica de Madrid- TRANSyT, Spain
Andrés Monzón
Professor,Universidad Politecnica de Madrid- TRANSyT, Spain
Rocío de Oña
Post-Doc, Universidad de Granada, Spain
Juan de Oña
Associated Professor, Universidad de Granada, Spain
Sara Hernandez
PhD Candidate, Universidad Politecnica de Madrid- TRANSyT, Spain
ABSTRACT
Data from an attitudinal survey and stated preference ranking experiment conducted in two urban European interchanges (i.e. City-HUBs) in Madrid (Spain) and Thessaloniki (Greece) show that the importance that City-HUBs users attach to the intermodal infrastructure varies strongly as a function of their perceptions of time spent in the interchange (i.e.intermodal transfer and waiting time). A principal components analysis allocates respondents (i.e. city-HUB users) to two classes with substantially different perceptions of time saving when they make a transfer and of time using during their waiting time.
The four main drivers of user behaviour related to time saving are: access to the urban interchange, transfer and movement perception inside the interchange, accessibility to travel information and wayfinding HUB information. The main drivers related to time using include comfort and convenience, image of the interchange and safety and security. Therefore for an urban HUB characterized by a physical infrastructure (i.e. Moncloa) the main user behaviour driver is identified with safety and security, explaining more than 35% of the variability of their behaviour; while in a more dispersed interchange as like as the Thessaloniki urban HUB it is the comfort and convenience.
Both factors are related with the use of time inside the interchange. Users identifie the improvement of city-HUBs with the quality of time spent inside, even when the interchange is more dispersed as like as in the Thessaloniki case study. The analysis of results through an hybrid model combining users perceptions and stated preferences stresses the relevance of time using factors. The hybrid model results contribute to identify key factors for elaborating guidelines for an European city-HUB.
1. INTRODUCTION & BACKGROUND
Experience has shown that the introduction of interchange stations increase the use of public transport (Di Ciommo et. al, 2009, Brons et al. 2009). The European Commission has started on a path towards the upgrading of urban interchanges for increasing the public transport use (CEC, 2001). A key role for increasing the use of Public transport and soft modes and the reduction of private mechanized trips is related to users perceptions and preferences in respect to time saving and time using during the intermodal trip (Crozet and Joly, 2001).
Despite the general agreement that time saving is a key factor for increasing public and the intermodal trips, proposed solutions such as the reduction of transfer time are sometimes impossible to adopt because of land use constraints (City-HUB D4.1, 2013). Various other studies using a pure utility approach show that transfert time is perceived as negative and as like as a disutility (Macki et al, 2004).The novelty of this article is to have intrinsically constructed the survey using the relevant drivers of user behavior related to time saving perception and to time using and then proposing a SP ranking experiment including three quantitative levels of time saving related to transfer facilities and other three levels of services and shops located inside of the interchange related to time using. The survey includes as well socio-economic variables and habit parts and it was conducted in two paradigmatic European urban interchanges: Madrid-Moncloa and Tessaloniki rail station, (City-HUB, D3.2 2013).
The paper is divided into six sections. The second section –– after the introduction- provides an introduction of the theme and an overview of the state of research and methods to assess the time perception during the intermodal change. It investigates the determinants of users’ behaviour, and shows how the perceptions and attitudes identified by using the principal components factors helps to identify the relevant drivers relating to time saving and time using perception. The third section describes the research methodology used for the survey. Section 4 presents the methodology analysis adopted for showing the results. Section 5 defines the modeling framework. Section 6 draws conclusions, finalizing with some recommendations on the upgrading of urban interchange station taking into account the time perception of users.
2. METHODS FOR EVALUATING CITY-HUB USER PERCEPTION
The relevance of two different dimensions of time saving and time using is a complex matter that can be analyzed in a number of ways, such as for example, from a psychological and sociological standpoint (Chowdhury and Ceder, 2013).
the second derives from direct observations used to construct the hypothesis of an empirical model (Di Ciommo et. al, 2013). Both approaches are based on two types of surveys. The first one is oriented to measure attitudes and perceptions using point scale questions. The second type uses stated or revealed preferences questionnaires to assess the levels of time saving and using at which people are sensible before or after the transport measure implementation. Once we have collected data, there are three different methods to analyze the survey results; first a psychological analysis based on consistency tests (Groot & Steg, 2006). Then, two methods based on principal components factors and choice models. The latters including attitudes, perceptions and preferences seem to be a more powerful tool for integrating the economic variables with a deep attitudinal and perception construct, that is latent variable (Ben-Akiva et al, 2012). This paper approaches the question of the interchanges organization and their management by examining the collected primary data and integrating socio-economic and psychological considerations about the time using and time saving in an interchange.
2.2 Users preferences links with perception of time saving and time using in an interchange.
This section is oriented to define the possible preferences of travelers about their use of the interchange. In particular, each traveler could have different preferences about her/his time saving or time using at the interchange. Some people could prefer to save at most their travel/transfer time while others could prefer to realize some activities during their trip for better using the transfer time. The interchange structure will be quite different if travelers prefer to save their travel time or indeed better use their transfer time.
The following tables present the drivers of user behavior related to time saving (table 1) or time using perception (table 2), defining the indicators and checking the users attitudes and perceptions.
Several European studies confirm that the time saving in the interchange is a key factor and the adoption of an intermodal trip by users is closely linked to the perception of time during the transfer (Hine, J. and J. Scott, 2000, Chowdhury, S. and Ceder, A., 2013, Guo and Wilson, 2011), but less studies are focusing on the interchange station characteristics impacts on travel behavior. Some local authority (i.e. Regional authority of Amsterdam) is working on the evaluation of the impacts of the interchange station services and safety on the modal choice of users. (City-HUB, D 2.3, 2013). They elaborated a number of criteria for improving an interchange specially related with the interchange pleasant stay (i.e.time using) and less to the transfer (i.e.time saving).
1. Smooth transfer 2. Clarity, orientation
3. Accessibility and practicability
4. Wayfinding (signs, intuitive guidance, time tables) 5. Ticket system (Chipwise)
6. Linking facilities in pre- and after transport 7. Pleasant stay
10.Social safety
11.Waiting environment 12.Other facilities
Source: Stads Regio Amsterdam, 2013
In particular, the debate focuses mainly on the following subjects relating to the users' perception of time saving and related drivers of user behaviour (table 1), while users perception of time using during the intermodal transfer and the related drivers of behavior seem less explored (table 2) :
Drivers of user behaviour
Measure/indicator Users attitudes and perceptions
TIME
Waiting time including transfer time, queue time and
time spent in some other activities (shopping, bank)
Check the time perception and attitudes against the use of
waiting time ACCESS TO TRAVEL INFORMATION Ticket machine, Interchange information desk
The accessibility of travel information (schedules, routes…) at interchange station
WAYFINDING INFORMATION
Geographical Information
Plan site use
MOVEMENT Pedestrian comfort in interchange
Perception of access/egress/movements
inside
ACCESSIBILITY
Distance to the interchange, facilities
for bicycles, cars, pedestrians, cost
The access to this station by walking, cycling, car. Access for people with disabilities or special needs
Table 1 Drivers relating to time saving perception
Drivers of user behaviour Measure/indicator Users´ attitudes and perceptions
COMFORT AND CONVENIENCE
Variety of facilities at the interchange (rest, shops, bank and other
services)
Basically related with waiting time
and its use, Perception of doing “right”
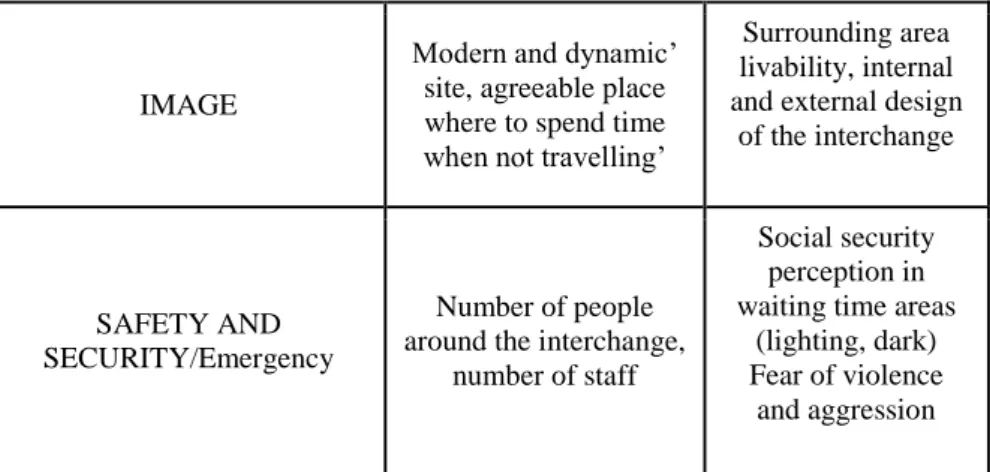
Table 2 Drivers relating to perception of time using
The time perception during the interchange becomes a complex matter that can be approached in a number of ways. Generally speaking, it is difficult to reach a clear understanding about the users perceptions and the related travel behaviour about the use of time in an interchange. However the results of this paper highlight the importance of this subjective perception for shifting to an intermodal trip, having a pleasant and more comfortable intermodal trip.
3. RESEARCH METHODOLOGY AND SURVEY DEVELOPMENT
Before conducting the survey, three focus groups were organized with City-HUB stakeholders; these allowed improving the questionnaire design, understand the perception of the exchange station and determine the profile definitions of interchange users (Aizer and Curie, 2002). The focus groups were also used to design incentives to attract individuals to participate in the survey. In total, one hundred smartphones were distributed and the response rates were high (98% of the initial sample agreed to participate after contacted). Once people were convinced to participate in the survey, they made a significant effort to properly complete it using the equipment.
The questionnaire consisted of four modules: the first contained questions regarding users time perceptions; the second consisted of travel habits questions; the third asks for the socio-economic characteristics and the fourth offered various options which could be ranked in terms of stated preferences. Respondents were guaranteed that their responses would be anonymous. They were warned that time required to fill out the questionnaire was 15 minutes. One I-pad was raffled as like as incentive for responding for each case study.
The main goal of this Travellers’ attitudinal survey was to capture the users’ views and preferences of different aspects and elements of an interchange and to identify their perceptions of time saving and time using for defining a smart and efficient interchange. Moreover, the survey aimed to verify the main drivers for intermodal travel behaviour, identify attitudes towards current interchange services, and seek the behaviour and travel patterns of users groups with different needs (i.e. women, elderly, etc.).
IMAGE
Modern and dynamic’ site, agreeable place where to spend time when not travelling’
Surrounding area livability, internal and external design
of the interchange
SAFETY AND SECURITY/Emergency
Number of people around the interchange,
number of staff
Social security perception in waiting time areas
(lighting, dark) Fear of violence
1st part Travellers´ attitudinal survey: oriented to check time using and time saving drivers behavior.
This part of the survey aimed to understand travellers´ views and preferences of different aspects and elements of an interchange, as well as their satisfaction level. This part of survey contained 37 items relating to behavior drivers of using an interchange (see Table 1), grouped into eight categories (or main dimensions) that are drivers of users behaviour related to time saving (i.e. Travel information, Way-findings information, Time and movement, Access) and to time using (i.e. Comfort and Convenience, Image and Attractiveness, Safety and Security and Emergency situations). Each respondent was asked their level of preferences with each of the 37 items using the Likert scale from 1 (strongly unsatisfied) to 5 (strongly satisfied). The items represent the measures or indicators of drivers behavior related to time saving and time using (see table 1, 2 and 3).
Main dimension (time saving) Items
1. Travel information 1. Availability and ease of use of travel information at the interchange 2. Availability of travel information before your trip
3. Accuracy and reliability of travel information displays 4. Ticket purchase (ticket offices, automatic machines, etc.) 2. Way-findings information 5. Signposting to different facilities and services (retail, toilets, etc.)
6. Signposting to transfer between transport modes 7. Information and assistance provided by staff
3. Time & Movement 8. Transfer distances between different transport modes
9. Co-ordination between different operators or services of transport 10. Use of your time (transferring & waiting) at the interchange 11. Distance between the facilities and services (retail, toilets, etc.) 12. Number of elevators, escalators, and moving walkways
13. Ease of movement due to number of people inside the interchange 4. Access 14. Ease of access to the interchange
Main dimensions (time using) Items
5. Comfort & Convenience 15. General cleanliness of the interchange
16. Temperature, shelter from rain and wind, ventilation, air conditioning
17. General level of noise of the interchange 18. Air quality, pollution.
19. Number and variety of shops
20. Number and variety of coffee-shops and restaurants 21. Availability of cash machines
22. Availability of seating
23. Availability of telephone signal and Wi-Fi 24. Comfort due to presence of information screens 6. Image & Attractiveness 25. The surrounding area is pleasant
26. The internal design of the interchange (visual appearance, etc.) 27. The external design of the interchange (visual appearance, etc.) 7. Safety & Security 28. Safety getting on and off the transport mode
29. Safety whilst inside the interchange
33. Lighting
8. Emergency situations 34. Information to improve your sense of security 35. Signposting to emergency exits
36. Use of escalators in the event of fire 37. Location of emergency exits in the event
Table 3: List of items classified into eight drivers behavior (see table 1 and 2)
2nd and 3rdst part-Questions on user characteristics and trip habits
The main purpose of these parts was clearly stated from the outset: to identify the current travel behavior of interchange users). In particular, the 2nd part gathered information about users´ travel habits, including the purpose of the trip, the selected transport mode (from origin to the interchange and from the interchange to destination), time (to/from/inside the interchange), type of public transport ticket used, how they used their time inside the interchange, etc. The third part collected socio-economic information about the users, including gender, age, employment status, household size, and household net-income.
The results concerning the two selected case studies (i.e. Thessalonoki and Madrid-Moncloa) show that Thessaloniki has a higher proportion of users with the lowest level of household net-income per month (56.4%), while Moncloa has a more equal distribution in respect to the income. Generally the interchange users surveyed are habitual users (i.e they use the interchange daily or 3-4 times a week). Moncloa had the highest number of habitual users (about 85%). The New Railway Station in Thessaloniki, however, has a different user profile, with most travellers using the interchange few times a month (24%) or less frequently (42%).
4th: Stated Preferences (SP) survey
A Stated Preference ranking experiment (SP), was undertaken for both case studies. It was used to check current interchange users’ preferences: is s/he more interested in saving time for her/his intermodal transfer or in improving the quality of her/his use of waiting time? The SP experiment proposed one table including 8 statements about the possible improvements at the interchange that the interviewed should rank from 1- most important improvement to 8 least important improvement. Three of them were related with time using (i.e. possible shopping or service activities) and other three were related with time saving (for modes transferring). Two additional questions were used as control statements of the experiment. The statements were adapted to each case study and each kind of interviewer.
The Moncloa and Thessaloniki interchanges were selected for conducting the SP experiment, because they are two different types of urban interchange:
A complex infrastructural organization including both transport and commercial functions: the Moncloa interchange – Madrid.
- Moncloa (Madrid)
The Moncloa interchange has four entrances and three different platforms with 39 bus bays. The metropolitan buses are distributed in each island according to common routes and all of them have direct connection through the HOV (High Occupancy Vehicle) lane (A6 corridor) (Pinto C. and J. Aldecoa, 2002). The buses lines are allocated to the same bus bay each time, so that travellers know where they arrive or depart from. The metro lines (line 3 and 6), the travel services and the retail area (cafés, restaurants and shopping) are located on the lower level. There are also temporary exhibitions and occasional campaigns. A Wi-Fi connection is available and free, although it is not advertised in the interchange. Seating is scant; however users must queue to take the bus during their waiting time and therefore would not be able to use them if more were provided.
The survey was carried out during five working days and one weekend by a group of four people on May 2013. The cards were handed out mainly on the three different bus platforms. Previously, the sample was characterized by the observation of the users (gender and age) during five consecutive days. The final sample available was of 851 available answers.
- New Railway Station (Thessaloniki)
The New Railway Station in Thessaloniki is located in the urban area of the city and it serves different modes of transport (including commuter rail, regional rail, metro under construction, local buses, suburban buses, regional buses, taxis, bicycle ways, park and ride, kiss and ride). Bus services are located on the street outside the station.
The survey carried out in Thessaloniki was undertaken during two periods, due to the low participation of travelers the first time the cards were distributed. A total of 105 surveys were collected from the first period in August 2013, while 153 surveys were collected for the second period September 2013. This resulted in a final available sample of 244 surveys. In order to characterize the sample, one previous day for observing the users at the interchange was undertaken.
4. SURVEY RESULTS IN RESPECT TO TIME PERCEPTIONS
The results concerning the time show that users use differently their time in both interchanges. In Thessaloniki 90% is used for transferring 5% for queuing and 5% for shopping, while in Madrid - Moncloa: 88% for queuing, 71%; for transferring and 28% for shopping and 31% for other activities. A same user can do multiple activities.
4.1 Principal components analysis
variation of the initial set. So that we can use the principal components as explanatory variables indicator study.
The extracted components are linear combinations of the variables that have the greatest variance. Z1 is the component being more explained variance, followed Z2 containing the second greatest variance explained but not correlated with Z1, and so on, so that the sum of the variance of all components total to explain variations of Xn and, in turn, are uncorrelated with each other.
Using the principal components analysis the attitudinal survey results could be summarizing as follows for Madrid-Moncloa case study, we have obtained eight main components factors, explaining a 63,259 % of variance. In each of them the amount of explained variance is specified, and the weight of each variable within these factors. These weights can be considered as the correlation coefficient. As much closer it is to 1, the higher relation exists between variable and factor. Among eight principal components factors, five are related with the previous classification of drivers travel behavior related to time using (i.e. Safety and Security (36,738% of variance); Emergency Situation (4.478 % of variance), Inside atmosphere (3.356 % of variance), Image & attractiveness (3.218 % of variance); comfort & technologies (2.912 % of variance); services (2.912 % of variance), while only two factors are related with drivers behavior related to time saving (i.e. Information, (5,843 % of variance) and Transfer (3.923 % of variance)). The first factor is “Safety and security”, a time using related factors.
For Thessaloniki railways case study, we have obtained five main components factors, explaining a 60 % of variance. In each of them the amount of explained variance is specified, and the weight of each variable within these factors. These weights can be considered as the correlation coefficient.
Among five principal components factors, four are related with the previous classification of drivers travel behavior related to time using (i.e. comfort & convenience (47,601% of variance); safety and security (4,586 % of variance), emergency situation (3,920% of variance) and image & attractiveness (3,138% of variance), while only one factor is related with drivers behavior related to time saving (i.e. Information and coordination (5,791% of variance)). The first factor is “Comfort and convenience”, a time using related factors.
4.2 Ranking Stated preference experiment results
User preferences were measured by the specific requirements stated in the question about factors of importance. This information was also extracted from the a ranking SP experiment.
SP ranking experiment: 3 levels for time saving and time using.
Time saving for transfer and queuing:
Low = T1
High = T3
Number of services:
Low = S1
Intermediate = S2
High = S3
For Thessaloniki case study 14 scenarios were defined, linking question about the waiting time to a specific SP card (i.e. scenario #1: up to 5 min). For Moncloa 8 scenarios were defined in relation with the kind of transfer and they were linked to the relevant SP card (i.e. scenario #1: from all modes transport to metro). For Thessaloniki we obtained 244 users answers, while for Madrid 851 users answers. The SP analysis shows that even if the first voted choice in both case studies is a level of time saving (i.e.T2 for Thessaloniki and T3 for Moncloa, the second choice is the second level of services increasing (S2) for Thessaloniki and the third level for Madrid-Moncloa (S3).
5. MODELING FRAMEWORK
5.1 Discrete Choice Model
It was therefore decided to develop a binary discrete-choice model (“accept” or “not accept” paying for the use of highways) and a hybrid model with latent variables. It is important to evaluate the sensitivity of the City-HUB users to variations in the time saving and using. This analysis enabled us to distinguish among those respondents who had chosen the different time-using and saving combinations. In this kind of model, the main assumption is that each decision-maker seeks to maximize his personal utility and chooses the alternative with the highest utility only for himself (Ben Akiva et al., 2009). In this context, a binary discrete-choice model analysis is applied in order to analyze the behavior of all City-HUB users: including a calibrated number of women and an adapted age scale representativeness.
The modeling framework contains a standard Multinomial Logit Model (MNL). The utility Uqr of each users q for each alternative r is a function of the characteristics
Srq of the road pricing alternative and the stakeholder’ attributes (annual turnover). A set
of parameters θ have to be estimated and the error term 𝜀𝑞:
(1)
An adjustment condition is imposed through a binary variable dq: the utility will
be positive when the individual prefers time saving and, or negative when s/he reject it:
(2)
5.2 Modeling time perception with latent variables
Choice model framework is based on the Random Utility Maximization theory (RUM) framework which comes from a microeconomic analysis of individual behavior, stated for transport by McFadden (1974 and 1981). According to McFadden, transport
𝑈𝑞𝑟 = 𝜃𝑟 𝑟 ∙ 𝑆𝑟𝑞 +𝜀𝑞
services and infrastructures users assign weights to different attributes of road pricing scheme characterizing each of the choices and select the one that maximizes their utility (Ben-Akiva and Boccará, 1995). In general, choice model considers the problem of timesaving/using analysis in an experimental way by using discrete choice modeling (Train, 2003). Transport planners are particularly interested in both the time saving effects and the factors that determine the time using, in order to better foresee the impact of new Interchange improving measures (i.e. new coffee shops in the interchange, increasing lighting comfort etc.). This quantitative choice models approach emphasizes the systematic, invariant aspects of choice behaviour (Ben-Akiva et al., 2002). Nevertheless, recent research demonstrates the existence of factors such as attitudes, perception and social interactions that distort – positive or negatively – the use of a transport service or infrastructure, hence partly relaxing the classic RUM assumptions including flexible disturbances error and latent variables (Cantillo et al. 2007, Yañez et al. 2009, Tudela et al. 2011).
6. CONCLUSION: CITY-HUB DEFINITION AND TIME PERCEPTION
In the case of urban interchange use, the use of hybrid discrete choice models with the incorporation of psychological /perception factors leads to a more behaviorally realistic representation of the choice process, and consequently has a better explanatory power (Cao & Mokhtarian 2005, Heath & Gifford, 2006, Duarte et al. 2009, Karash et al. 2008). Thus a sequential maximum likelihood estimation method is used to integrate latent variables in discrete choice models. Despite the fact that this method does not guarantee totally consistent estimators, its application is clear and simple and gives good results (Yañez et al., 2010; Bolduc & Alvarez-Daziano, 2010). The latent variables are derived from the subjective attitudes and perceptions which emerged in the attitude questionnaire, while the more objective data are collected from the stated preferences experiment.
In particular, this questionnaire was designed to capture interchange station perceptions of various aspects (see Table 1 and 2). Within the set of users evaluable assumptions, the attitudinal questionnaire addressed the two cross-cutting issues of time saving and time using, which were identified as latent variables through a preliminary principal components analysis (Spearman 1904, Bollen 1989). However, a principal component analysis, following the model identifies mainly time use as a significant latent variable related to the ranking among time using and time saving factors for City-HUB use. The resulting subjective ratings of the perception questions are used as indicators of latent variable of time using and time saving.
Acknowledgements
The authors would like to thank the EU 7 FP program for its support in developing the City-HUB project.
REFERENCES
ASHOK, K., DILLON, W.R. & YUAN, S. (2002) Extending Discrete Choice Models to Incorporate Attitudinal and Other Latent Variables. Journal of Marketing Research vol 39, 1, 31-46
AZJEN, I. (1991) The theory of Planned Behavior. Organizational Behavior and Human Decision Process, 50, 179-211.
BARNES, G. & KRIZEK, K. (2005) Estimating Bicycling Demand. Transportation Research Record: Journal of the Transportation Research Board, 1939, 45-51.
BEN-AKIVA M., BIERLAIRE, M.,BOLDUC, D. &WALKER, J. (2009) Discrete Choice Analysis, 338-378, MIT Press, MA.
BEN-AKIVA, M. AND B. BOCCARÀ (1995) Discrete Choice Models with Latent Choice Sets. International Journal of Research in Marketing, 12, , pp. 9-24.
BEN-AKIVA, M., A. DE PALMA, D. MCFADDEN, M. ABOU-ZEID, P.A. CHIAPPORI, M. DE LAPPARENT, S. DURLAUF, M. FOSGERAU, D. FUKUDA, S. HESS, C. MANSKI, A. PAKES, N. PICARD AND J. WALKER. Process and context in choice models, (2012) Marketing Letters Vol. 23, 2, pp. 439-456.
BEN-AKIVA, M., BOLDUC, D. & PARKI, J. (2008) Discrete choice analysis of shipper’s preferences. Recent developmets in transport modeling: lessons for the freight sector, eds Eddy Van de Voorde. Elselvier
BEN-AKIVA, M., MCFADDEN, D., TRAIN, K., WALKER, J., BHAT, C., BIERLAIRE, M., BOLDUC, D., BOERSCH-SUPAN, A., BROWNSTONE, D., BUNCH, D.S., DALY, A., DE PALMA, A., GOPINATH, D., KARLSTROM, A., AND MUNIZAGA, M.A. (2002) Hybrid Choice Models: Progress and Challenges (2002) Marketing Letters, 13, 163-175.
BOLDUC, D & ALVAREZ-DAZIANO, R. (2010) On estimation of Hybrid Choice Models. Choice Modelling: the state-of-the-art and the state-of-practice, eds. S. Hess and A. Daly, Proceedings from the Inaugural International Choice Modeling Conference, Emerald, England.
BOLDUC, D., BOUCHER, N. & ÁLVAREZ-DAZIANO, R. (2008) Hybrid choice modeling of new technologies for car choice in Canada. Transportation Research Record 2082, 63-71
BOLLEN, K.A. (1989) Structural Equations with Latent Variables. John Willey and Sons, New York.
BRONS, M., GIVONI, M., & RIETVELD, P. (2009). Access to railway stations and its potential in increasing rail use. Transportation Research Part A: Policy and
Practice, 43(2), 136-149.
CANTILLO, V., J. DE D. ORTÚZAR, AND H.C.W.L. WILLIAMS (2007). Modeling discrete choices in the presence of inertia and serial correlation. Transportation Science, 41, pp. 195-205.
CAO, X. & MOKHTARIAN, P.L. (2005) How do individuals adapt their personal travel? Objective and subjective influences on the consideration of travel-related strategies for San Francisco Bay Area commuters. Transport Policy, 12, 291-302.
CEDER, A., CHOWDHURY, S., TAGHIPOURAN, N., & OLSEN, J. (2013).
Modelling public-transport users’ behaviour at connection point. Transport Policy, 27, 112-122.
CITY-HUB CONSORTIUM, 2013 D 3.3 Guide for efficient and smart design
CITY-HUB CONSORTIUM, 2013, D 2.3Lessons from descriptive case studies – recommendations for City HUB model.
COMMISION OF THE EUROPEAN COMMUNITIES (CEC) (2001) White Paper European Transport Policy 2010: Time to decide. Brussels.
CORREIA, G.; ABREU E SILVA, J. & VIEGAS, J. (2010) Using latent attitudinal variables for measuring carpooling propensity. Proceeding of 12th World Conference on Transport Research. Lisbon.
CROZET, Y. AND I. JOLY. “Budgets Temps de Transport: Les sociétés tertiaires confrontées à la gestion paradoxale du «bien le plus rare».” Les Cahiers Scientifiques du Transport, Vol. 45, 2004, pp.27-48.
DE GROOT, J., & STEG, L. (2006). The role of value orientations in evaluating quality of life consequences of a transport pricing policy. Transportation Research Part D, 11 (2), 160-165.
DI CIOMMO, F., MONZÓN, A., & FERNANDEZ-HEREDIA, A. (2013). Improving the analysis of road pricing acceptability surveys by using hybrid models.Transportation Research Part A: Policy and Practice, 49, 302-316.
DUARTE, A., GARCIA, C., LIMÃO, S., & POLYDOROPOULOU, A. (2009) Experienced and Expected Happiness in Transport Mode Decision Making Process. proceeding 88th Annual Meeting of the Transportation Research Board.
FUJII, S. & GÄRLING, T. (2003) Application of attitude theory for improved predictive accuracy of stated preference methods in travel demand analysis. Transportation Research Part A: Policy and Practice, 37, 389-402.
GOLOB, T.F. (2001) Joint models of attitudes and behavior in evaluation of the San Diego I-15 congestion pricing project. Transportation Research Part A: Policy and Practice, 35, 495-514.
GREENE, WILLIAM H. (1990) Econometric Analysis. 6th edition ed. Pearson New Jersey
GROTENHUIS, J.W., W.W. BART AND P. RIETVELD. “The desired quality of integrated multimodal travel information in public transport: Customer needs for time and effort saving”. Transport Policy, Vol. 14, 2007, pp. 27-38.
GUO, Z., & WILSON, N. H. (2011). Assessing the cost of transfer inconvenience in public transport systems: A case study of the London Underground.Transportation Research Part A: Policy and Practice, 45(2), 91-104.
HEATH, Y. & GIFFORD, R. (2006) Extending the Theory of Planned Behavior: Predicting the Use of Public Transportation. Journal of Applied Social Psychology, 32, 2154-2189.
HINE, J. AND J. SCOTT. “Seamless, accessible travel: users’ views of the public transport journey.” Transport Policy, Vol. 7, 2000, pp.217-226.
ISON, S. G. & RYE, T. (2005). Implementing road user charging: the lessons learnt from Hong Kong, Cambridge and Central London. Transport Reviews, 25 (4), 451-465.
JÖRESKOG, K.G. (1969) A general approach to confirmatory maximum likelihood factor analysis. Psychometrika, 34, 183-202.
KARASH, K.H., COOGAN, M.A., ADLER, T., CLUETT, C., SHAHEEN, S.A., AZJEN, I., & SIMON, M. (2008) Understanding how Individuals make Travel and Location Decisions: Implications for Public Transportation. Transportation Research Board, Washington D.C.
MACKIE, P.J., S. JARA-DIAZ AND A.S FOWKES. “The value of travel time savings in evaluation.” Transportation research part E: Logistics and Transportation Review, Vol. 37, 2001, pp.91-106.
ORTÚZAR, J. DE D. & L.G. WILLUMSEN (2001), Modeling Transport , Third Edition, John Wiley and Sons, Chichester.
PENDLETON, L.H. & SHONKWILER, J.S. (2001) Valuing Bundled Attributes: A Latent Characteristics Approach. Land Economics, 77, 118-129.
PINTO C. AND J. ALDECO A. “Concepción de terminales estaciones de autobuses metropolitanos en Madrid”, Presented at the International Seminar: La integración modal en la grandes aglomeraciones urbanas, Mexico, September 26th 2002.
RAVEAU, S; ALVAREZ-DAZIANO, R; YÁÑEZ, MF; BOLDUC, D & ORTÚZAR J de D. (2010) Sequential and Simultaneous Estimation of Hybrid Discrete Choice Models: Some New Findings. Transportation Research Record.
SPEARMAN, C. (1904) General intelligence, objectively determined and measured. American Journal of Psychologist, 15, 201-293.
TUDELA, A., K. M. N. HABIB, J. A. CARRASCO AND A. O. OSMAN (2011). Incorporating the explicit role of psychological factors on mode choice: A hybrid mode choice model by using data from an innovative psychometric survey. Paper presented at the 2nd International Choice Modelling Conference, Leeds.
VREDIN JOHANSSON, M., HELDT, T., & JOHANSSON, P. (2006) The effects of attitudes and personality traits on mode choice. Transportation Research Part A: Policy and Practice, 40, 507-525.
YÁÑEZ, M.F., E. CHERCHI, J. DE D. ORTÚZAR, AND B. HEYDECKER (2009). Intertia and shock effects on mode choice panel data: Implications of the Transantiago Implementation. 12th International Conference on Travel Behaviour Research. Jaipur, India.