Modeling of the behavior of alternative fuel vehicle
buyers.
A
model for the location of alternative
refueling stations
C.
Fúnez Guerra
a,*,Ricardo
GarcÍa-Ródenas
b,E.
Angulo Sánchez-Herrera
c,Doroteo
Verastegui
Rayo
c,C.
Clemente-Jul
daNationalHydrogen Centre, Prolongación FernandoelSanto s/n,13500,Puertollano, Spain
bEscuelaSuperior deInformática, UniversidaddeCastilla la Mancha, Paseodela Universidad,4,Ciudad Real, Spain
eEscueladeIngeniería MineraeIndustrialdeAlmadén, UniversidaddeCastilla-La Mancha, Plaza ManuelMeca S/N,
Almadén, Ciudad Real, Spain
dDepartament ofEnergy andFuels, SchoolofMining andEnergy TechnicalUniversity ofMadrid (UPM),RiosRosas,
21, Madrid, Spain
ABSTRACT
This paper addresses the problem of estimating the infrastructure to be made available for refueling alternative fuel vehicles as a function of the profitability thresholds required by the investment. A methodology has been devised based on sales forecasts for alternative fuel vehicles. These methods use discrete choice models in which the factor of refueling infrastructure, rather than being considered simply as one more attribute of the model, acts as a constraint on the choice set for vehicle buyers. This methodology is used to es-timate the infrastructure of hydrogen refueling stations and electricity charging stations for Spain (8,112 population centers) in 2030. Evolution of fuel cel! vehicles over the years 2016 and 2030 is also estimated and compared with forecasts for countries such as France, Germany and the United Kingdom.
Introduction
The transportation sector is responsible for a large share of the European Union greenhouse gas (GHG) emissions, and consequently it is a central goal of the European Commission in sustainability development strategies. The European Union is attempting to replace 10% of conventional fuels with bio-fuels, hydrogen and ecologically-sourced electricity before the
year 2020 [16] and for 2050 has set the much more ambitious target of 60% reduction in emissions of polluting gases [10].
The use of Alternative Fuel Vehicles (AFV) to replace vehicles powered by internal combustion, is an alternative form of road transport that may provide, in the long term, reduction in GHG emissions and improvement in air quality in cities [19,21].
SpanishTotal VehideSales Forecast
2000
~
1Il
"C
e
(Jl1500-.<···,···:·· ,
::::l
o
.c
....
e
';' 1000-.<···:··· '"""
Ql iii
111
Ql
U 500
:i:
~
o
-4 -2 O 2 4 6
Annual percentage growth rate of GDP per capita (in percetange)
o
o
~e
.l!!
:c
la U"l.c ('1)
.E
o~
g
.~ U"l :§C\1Ql e C.o 111 Ql U"l
iii ,....
111
Ql U :i:
~
O-l---i---~-~----,-'----r---,.---2000 2005 2010 2015 2020 2025 2030
Year
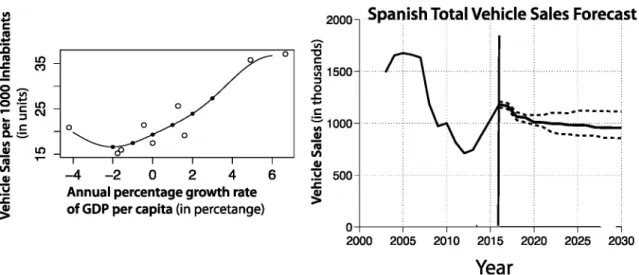
Fig. 1 - Multiplier4>(~GDP)for sales (on the left) and the forecast vehicles sales in Spain (on the right).
A basicapproach
1 The data used in this paper can be found at the following web address http://cort.as/f5Vw.
Forecasting of alternative fuel vehicles sales by
using discrete choice models
investment in rolling out the infrastructure will allow the ty-pology of the feasible infrastructure in the study area to be determined.
(1) v¡= pt'4>(~GDpt)'P(i/t)
This section describes the basic method1 to predict the evo-lution of AFV as a function of the roll-out of infrastructure. This method assumes that vehiele sales satisfy the equation:
where v¡ is the number of vehieles of type i sold in period t (in
thousands of units),4>(~GDpt)is a multiplier which transforms
the variation of GDP per capita in period tinto vehieles sold per thousand inhabitants and P(i/t) represents the market share of vehiele type i in period t.
This method has been applied to Spain. Three scenarios are considered (one baseline case, one optimistic and one pessimistic) consisting of a combination of forecasts of
population development {Pt},¿2Ü16 and of the{~GDPt},¿2ü16'
The population estimate was obtained from the INE (Spanish Statistical Office). The baseline case considers a final population of 45.4 million, 44.3 in the pessimistic case and 46.5 in the optimistic case. The left of Fig. 1 shows the
estimate of the multiplier4>(~GDP)using a Gaussian radial
basis approximation and on the right of Fig. 1 the forecast
for total vehieles sales vt= pt'4>(~GDpt) for the three
scenarios.
This study considers seven types of vehiele i that are already available on the Spanish market, or will be in the near future. We have considered gasoline and diesel (conventional technology, CT), biofuel vehieles (BVs), natural gas vehieles (NGVs), hydrogen (fuel cell electric vehieles, FCEVs). There are AFV vehieles. The European Directive 2014/94/EU [17]
estab-lishes a common framework of measures for the deployment of alternative fuels infrastructure in the European Union. One of the main problems which must be addressed in the roll-out of the necessary infrastructure for the use of alternative fuels
in transport is the so-called Chicken -or- Egg dilemma [13,21].
Consumers are not keen to buy alternative-fuel vehieles while the refueling infrastructure is hard to find, and refueling points will only become common when there are enough ve-hieles to make it worthwhile.
This study as sumes that private enterprise will finance the roll-out of the refueling infrastructure if it considers that the
investment required will reach a certain profitability
threshold. This assumption removes the dilemma of prece-dence between supply and demand, and raises the question of whether the supply will generate sufficient demand, that is, whether the chicken will or will not layan egg. Thus we call
the approach the the chicken orraster prablemas addressed in
this paper.
The stated preference methods are the tools most widely used to analyze relevant factors in the market penetration of AFV. These studies use the marginal willingness to pay (WTP) and the analysis of market share in different scenarios to weight each of the factors. Martin Achtnicht and Hermeling [13], Hoen and Koetse [7] review these methods and show that availability of refueling stations is an essential factor. Hack-barth and Madlener [4]; Ito et al. [9] use this methodology to assess potential demand for infrastructure investment for AFV vehieles.
also hybrid electric vehieles (HEVs), plug-in hybrid-electric vehieles (PHEVs), and fully battery-electric vehieles (BEVs).
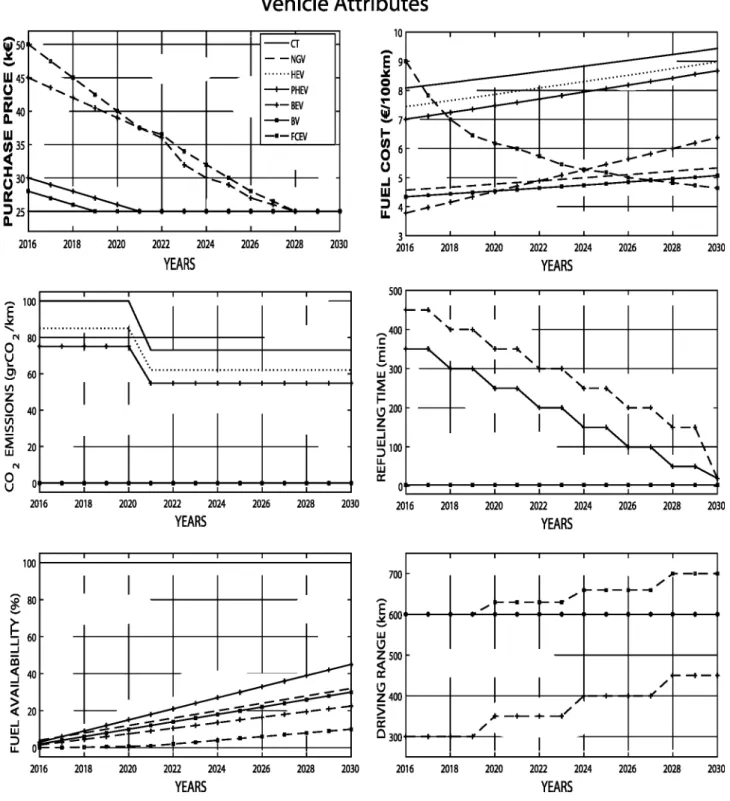
The stated choice methods allow market share to be pre-dicted P(i/t) as a function of a vector of attributes s of the set of vehiele types i considered in the study. Findings from the existing literature on AFV preferences show that next to purchase price and operating costs, driving range [5,11,14] and fuel availability [8,18] may have substantial effects on con-sumer preferences for AFVs. Emission reduction is also flag-ged as an important factor (see Refs. [6,18]). For these reasons this study considers the vector of attributes s to consist of:
- Purchase Price (PP) is the money to be paid by the consumer to buy a vehiele (in k€).
- Fuel Cost (Fe) is money that a user spends to drive 100 km of distance (in €/100 km).
- CO2emissions (C02) is the amount of CO2 emitted by
vehi-eles to travell km of distance (in gr CO2/km).
- Driuing Range (DR) is the maximum distance that a vehiele can travel with a load to 100% of the fuel use (in km). - Fuel Auailability (FA) is the number of filling stations that
the user has available to refuel (in % total existing filling stations).
- Refueling Time (RT) is the time that a vehiele takes to refuel from 0% to 100% its capacity (in minutes).
The most basic discrete choice model is the logit model, which expresses market share as a function of the attributes as:
(2)
where V¡(s) is a function (linear in most studies) of the
attri-butes, ands:fis the choice-set for a vehieles buyer (types of
vehiele).
Most studies that use discrete choice models are cross-sectional studies. This paper deals with a longitudinal study and requires forecasts for the evolution of the different attri-butes with time, that is {st}t¿2016'
The forecast for the future of the attributes is based on Prospective Technological Studies2 for the different types of vehieles concerned shown in Fig. 2.
Hackbarth and Madlener [3] analyze the potential demand for AFV vehieles using stated-preference discrete-choice data and a mixed multinomiallogit model (MMNL). This paper uses the model and parameters that the authors obtained with a sample of 711 respondents. The longitudinal market shares are shown in Fig. 3. The most important observation is that the
attribute FAt= Ofor the AFV in the year t= 2016 (it measures
the roll-out of the infrastructure), nevertheless the market share is not zero. This effect will be dealt with in the next subsection using a constrained mixed multinomiallogit model (CMMNL).
For example, if a buyer has no possibility of refueling with hydrogen then the option of purchasing a FCEV is not feasible.
The paper considers that a buyer only has access to the infrastructure of the town where they live. This implies that the probability of purchasing a vehiele of type i depends on where the buyer lives.
The paper focuses on analyzing the roll-out of refueling infrastructure for hydrogen and electric vehieles. Thus, we assume the existence of a current infrastructure serving the other vehiele types and we wish to assess the introduction of refueling infrastructure for these two types of vehiele against the others. This premise results in four typologies of refueling infrastructure (henceforth TIR) which we shall call
j.We associate the valuej= 1 with an infrastructure which
has all possible fuels, the value j= 2 to hydrogen
vehieles
+
current infrastructure, the valuej= 3 to electricvehieles
+
current infrastructure, and finally j= 4 to thecurrent infrastructure. The sets of alternatives associated with each typology are:
s:f1= {CT,NGV,HEV,PHEV,BEV, BV,FCEV}
s:f2= {CT,NGV,HEV,BV,FCEV}
s:f3= {CT,NGV,HEV,PHEV,BEV,BV}
s:f4= {CT,NGV,HEV,BV}
Discrete choice models, when the attributes of all the al-ternatives present in the choice set are known, can be used to calculate the probabilities of acquiring a vehiele of type i for a
TIRjen period t,
(3)
We shall now determine which TIR are acceptable in town
c.A TIRj is feasible for a town c if it exceeds the profitability
thresholds (breakeuen) for the types of fuel it ineludes. The criterion used to assess profitability of a refueling station is the number of vehieles per service station.
Currently in Spain, according to data from the Asociación Española de Operadores de Productos Petroliferos, the number of service stations has grown from 8,622 in 2002 to 10,712 in 2014. Likewise, the number of cars in Spain, according to the INE dates, has increased from 18, 688, 320 in 2002 to 22,029,512 in 2014. From these data, it can be seen that each refueling station serves an average of 2.25 vehieles (in thousands of units). This quotient, number of vehieles per filling station, is indicated by b and is what we call breakeuen. In towns where the number of vehieles per service station is higher than this breakeven value b it would be worth considering a service station if one does not existo
Mathematically, this expressed as:
A constrainedapproach
The set of alternativess:favailable to a buyer is constrained
by the refueling infrastructure typology he/she can access.
2 More information at the link http://cort.as/f5Vw.
(4)
(5)
Vehicle Attributes
10r - - - , - - - - . - - - , - - - , - - - , - - - , - - - ,
...
-...-...
...
--
.....-_-:!.-::"---~- - -
--
-
---...
-E
.ll: \ CI ...CI .. -.. -..~,...."""-fc:..:..:..:-:-=:::oIo_-=::;---l----l
:!::
...
~...
!!!.
7+-o:::!:~~--I___-___1I___-___1--__+--__+--___j 1-ti)O
(,) .J W::J 4 ..._+-"
U.
I I
--a
"
I I- -NGV
'
....- -
... HEV...
,
--+-PHEV ...
....
...
'
--+-BEV~
...
--BV."",
':.... -o-FCEV
~
..."
... I~
- , I""
t-...;:-.._
...W45 (,) D::40
a.
W ti)35«
::t
30 (,)a:
::J25a.
i
50...
2030 2030 2030 2028 2028 2028 2026 2026 2026,
"'--
....
,
_
...
,
2022 2024YEARS
2022 2024YEARS
2022 2024YEARS
2020 2020 2020 2018 2018 2018~ a
-,;'
....
--
....
-....
--
...
, ;, ;
I
I
/,...-+-,
"
; -+--+--+/
/
I
0...
---0--...
----<0--...---10--...---01--...- - - 0 -...- - -...31...-_---I.._ _....L.._ _.L..-_---L_ _....l...._ _.L-_----I
2016
2016
500r - - - , - - - - r - - - , - - - , - - - , - - - , - - - ,
2016 700 ... 400 l:
'E
;;; 300 ~F
~200 Z :J ~100 u.. UJ c::~
600 UJ ~ Z 500~
~ Z 400:>
a:
03002016 2018 2020 2022 2024 2026 2028 2030
YEARS
... 100
-~
...
~\
... N 80 ".\ O U"-
... ... ...
~ 60 Vl Z O 40 Vi Vl ~ 20 UJ N O U
2016 2018 2020 2022 2024 2026 202B 2030
YEARS
100l80
~
60 :J ...J ~ oc( ...J~
...J UJ :J u..2016 2018 2020 2022 2024 2026 2028 2030
YEARS
Fig. 2 - AttributesoCvehicles between 2016 and 2030(st).
where Qis the vehicle life expectancy, u~ is the number of
vehicles sold in town e in periodt.The left of the constraint (4)
is an estimate of the number of vehicles of type FCEV which would exist in the equilibrium state. That is, the number of
Feasibility J?f3 :Q'u~•(aP(PHEVIJ?f3 ,st)
+
P(BEVIJ?f3 ,st))2:bpHEV+BEV
Feasibility J?f4 : always
(7)
(8)
vehicles of type FCEV sold in ayear multiplied by the average life of these vehicles. The constraint (5) considers that hybrid
vehicles PHEV refill the fractionaof their fuel in the refueling
infrastructure, and this constraint represents the economic
viability ofthis type ofinfrastructure. In order forthe TIR J?fl to
be viable both constraints (4) and (5) must be satisfied simultaneously.
The numerical trials found that the 8,112 Spanish towns are distributed among the following combinations of feasible
2016 2018 2020 2022 2024 2026 2028 2030
Year
Fig. 3 - Market shares using the mixed logit model given in Hackbarth and Madlener [3] and the attributes{st};~~~16'
Sensitivity analysis of breakeven parameter for
the roIl-out of alternative fuel infrastructure
We have considered as a base discrete choice model the mixed logit model described in the article Hackbarth and Madlener
[3]. The study considers Q = 25 years and CI= 0.5 and the
breakeven threshold b FCEV= bpHEV+BEV= 7 (in thousands of
vehicles). To get b FCEV= 7 we analyzed public-private
part-nership Mobility studies, such as for example Association Francaise pour I Hydrogene et les Piles a Combustible [1]; McKinsey Company [15]; Transnova [20]; and Germany Trade Invest [2]; which show the number of hydrogen vehicles, of hydrogen refueling stations, and hydrogen consumption. We
have estimated the parameteru~= ut'Pewhereutis the set of
total vehicle sales andpe is the proportion that the population
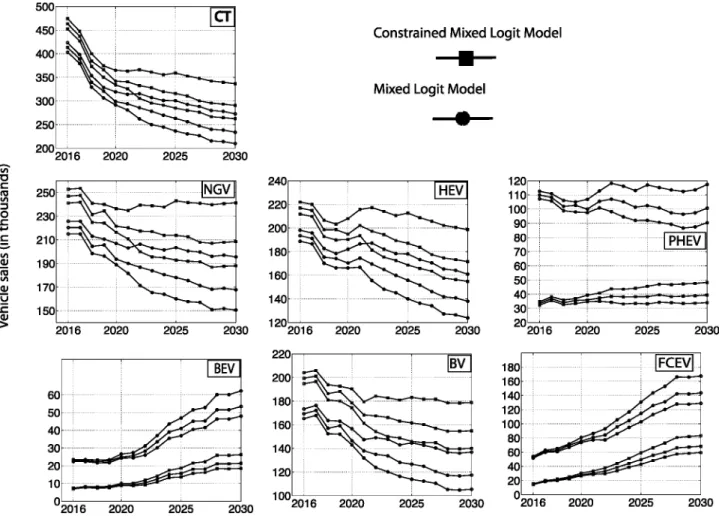
of town e in 2016 represents in the total. The results are shown in Fig. 4. It can be seen that the basic approach overestimates vehicle sales for which there is no TIR (FCEV, PHEV, BEY). The constrained approach corrects this.
Table 2 shows the number of FCEV vehicles estimated in 2030 for Germany, the United Kingdom and France and com-pares them with the estimates obtained for Spain using the CMMNL for the 3 scenarios. We have standardized the esti-mates obtained in the different studies by country population in 2016 (fourth column). Column 5 compares these standard-ized measures to the base estimate CMMNL. The estimates obtained with the CMMNL for Spain are seen to be similar to those for France, a country with a more moderate plan for the introduction of FECV, which is in agreement with what is expected to happen in Spain.
The estimates for the number of FCEV in Spain in 2030 using the MMNL for the three scenarios are: 1.49, 1.63 and 1.83
million vehicles. These values lead to indices
¡L= 0.0321, ¡L= 0.0351 and ¡L= 0.0394 well aboye the other
countries. This shows the need to use the CMMNL to avoid overestimating with the MMNL.
In order for the figures for vehicles sold to agree with those predicted by the model, private initiative must be aware of business opportunities (the basic assumption of the approach) and the government must make introduction easier (by legally guaranteeing the investment through concessions, subsidies, etc.). The constrained MMNL overestimates AF vehicle sales for 2016 (see Fig. 4) because the refueling infrastructure for hydrogen and electric vehicles is currently negligible and so the basic assumption is not meto
(9) ... - -+- -.-+- - + --+ --+- - ... - -+__.¡. - -+o --+- -+ .... _ ....
-OAr .,
=cr=
···NGV
... ~HEV
0.35 "' ~., _... ...PHEV
• - " " " " " " , , " . ' B E V
111 0.3 BV
~_ _ FCEV
10 ~0.25r ··· .. ··· ·.. ··· , , , , --~:..;:..;:..;:::-::; .J: O
111 ''¡:¡ _ __ • •
... O
0.2~--·_·,·.•. ,•.•. ".•.'.'•. ,•._".. _.,. ·".'0' "';;,',_'·C_'·'.'_" .. , , .J¿
:u
3
g-
0.15i~=:::=:==1==::j:2~~::
•••• " '-~ .~
0.1t=...
=~;~~~·::..:·j:~~~=~,::.:..~~
0.05,,,_''''-_·~ ;
shows that there are towns which could support any refueling infrastructure while in others only the current infrastructure is viable.
The next issue is to determine which of the feasible TIR's for a town e is introduced in a period t, this TIR is indicated by To solve this requires defining the mechanisms operating in the companies (private initiative). We as sume that com-panies, with or without public incentives, will create the infrastructure if the expected return to investment is positive
(measured by the breakeven threshold b).A corollary of this
mechanism is that companies will do business as long as it is possible to do so, and so the infrastructure in each town will grow to the maximum economically viable (feasible TIR). Table 1 shows the application of this corollary to each situa-tion. What is most noticeable is that there is a size of town for which it is only possible to introduce infrastructure for hydrogen or electric vehicles, and its introduction makes the other type economically non-viable. To remove this indeter-minacy involves consideration of technological neutrality, chance, etc. We have simplified the question and in the
nu-merical trials we have considered introducing typologysl3in
these cases.
Finally, the estimate of vehicle sales of type i for each period t is given by the expression:
Table 1 - Typology of towns by feasible TIR.
Note thatiE,fsl~givesp(ilsl~,st)= O.
We have applied these two methodologies (MMNL and CMMNL) to Spain, and for the three scenarios of vehicle sales.
This section presents a methodology whose aim is to accel-erate the introduction of alternative fuel infrastructures. Pri-vate initiative can determine in which towns, when and with which associated TIR to decide on their participation in this process, while the government can evaluate incentives permitting the development of a sustainable network which encourages the private sector to anticipate the investment.
This section analyzes both points ofview. On the one hand, it is considered that the incentives allow variation in the breakeven value (decreasing it), while on the other hand the decision makers assess subsidy policy in terms of the capacity to reduce emissions, energy dependence, etc. These matters are closely related.
sicintroduced
in town e TIR's to be introduced
in town e
{Jli\ ,'w2, 'w3, 'w4},
{'w2,'w3,'w4}, {'w2'w4}, {'w4}
2030 2025
2020
120íT-~,/~::::;;:¡O::::;::::::::/T
1101 . . . . .
~~~:
10m
90f'··· , ,.."",-'"'"""~...,
80
70
60,···... ,
50[I~~~~~~
40[j 30 20
2016
•
2030
•
2025
Mixed Logit Model
Constrained Mixed Logit Model
2020
240,,----~---~--,----.
220
200f ..=·\~"'::."""""'···""""__
180
160
140f···,···"o.o"" - ....
2030 1202016
2030
2025 2025
2020 2020
500,,----~---~-_____.~
450
400 ..ffi\l~, ,... 1
350
300
250,···
,···"'--..c···"""""'" "
200 2016
~
'"
"'C
e
ro
'"
::::1 O
..c
...
e ~2030 2025
2020 180
160 140 120
100f···.···· c/...-:V··· 1
80
6°fE~~
40 20 0
2016 2030
BEV
2025 2020
60 50
40,···/..-::.-··... ,
30'···,"~.r··· ... ,
20f[=:::I=:~@~~==,
10f
02016
Fig. 4 - Sales forecasts according to the two methodologies (MMNL and CMMNL) for the three scenarios analyzed.
Table 2 - Comparison of the forecast for the number of fuel cell vehicles for the year 2030 in different EU countries.
Country i Program FCEV in 2030 (in millions) ¡.ti= Po:~l;'{ion 100x~
Germany Now Germany Mobility 1.87 0.0228 121.35%
United Kingdom UKH2Mobility 1.27 0.0194 88.34%
Franee H2Mobility Franee 0.773 0.0120 16.5%
Spain Optimistie CMMNL 0.56903 0.0123 19.41%
Spain Base CMMNL 0.47562 0.0103 0%
Spain Pesimistie CMMNL 0.42353 0.0091 -11.65%
Where¡J.'is the index¡J.for Base CMMNL.
A sensitivity analysis will be carried out on the breakeven parameter b assuming that it has the same value in both types
of infrastructure, that is:b FCEV= bpHEV+BEV'Fig. 5 shows the TIR
of Spanish towns in 2030 as a function of the number of in-habitants. Looking at the graph on the left, it can be seen that
for a value b= 7 the TIR sil is introduced in towns of
more than 167,008 inhabitants, the TIR sl2 between
84,789 - 138,048, the TIRsl3in the range 145,967 - 165,287.
This supposes that in the case of Spain there would be 38
towns with infrastructuresil,30 withsl2,7 forsl3and the rest
8037 keep the current infrastructure sl4.The right of Fig. 5
shows sales of vehicles FCEV, BEV
+
PHEV as a function ofthe parameter b. When the parameter b is increased the introduction of the infrastructure is reduced and so are the sales of those types of vehicle. Competition between
alternative infrastructures can be seen for the value b= 11.An
increase in this value of10-11(for the optimistic scenario) do
not cause sales FCEV vehicles to reduce. In fact they rise
because the electric vehicle charging infrastructure is
removed from a town, and substituted for hydrogen fueling infrastructure.
To our knowledge there is no study in the literature which analyzes the introduction of refueling infrastructure (in Spain) in terms of thresholds of economic viability, and thus we have been unable to contrast our results.
'íil 5 ,....,
+-' 5x1O 111
c -g140
10 4.5 ~~e
+-'
~~ 10
:c
4 ~ ~12010
3.5
~\<,~
.,g
100..c
c
3
#"~
+-'...
§
80c 2.5 ~,,~
O
''¡:¡ 2
<ce
111 60.!!! 1.5
•
.!!!
1040
:::J VI
c..
1 QIO 20
c..
0.5u
>-
01
:2
+-' 3 5 7 9 11 13 15 17 19
~
3 5 7 9 11 13151719O
Breakeven (b)
Breakeven (b)
Fig. 5 - TIR deployments versus city's inhabitants (base scenario) and sales forecasts for the year 2030 as a function of the breakeven b (for the three scenarios analyzed).
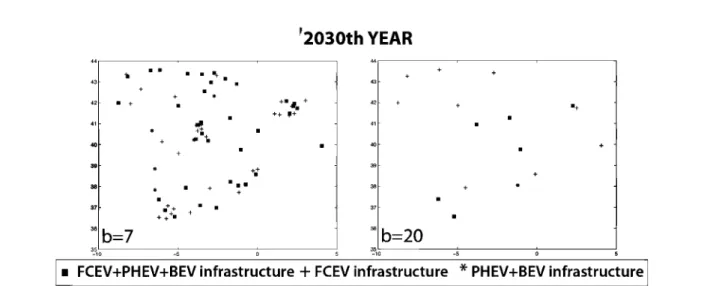
'2030th YEAR
43
" +
39
as
37
36
b=7
"
"
+" ++"
"+
38
38b=20
351~O- - - ; - - - : : - - - !
• FCEV+PHEV+BEV infrastructure
+
FCEV infrastructure
*
PHEV+BEV infrastructure
Fig. 6 - Introduction of alternative fuel refueling infrastructure as a function of breakeven for the year 2030.
Note that it is possible to perform a sensitivity analysis not
only the key parameter model breakeven(b) but any vehicle
attributes considered. Table 3 shows the difference in total vehicle sales between the base case and a new scenario defined by the 50% trend increase in the fuel costs for CT, NGV, HEV and BV vehicles. It is noted: i) that although the fuel costs increased by 50% for CT, NGV, HEV and BV only CT and HEV
vehicles decreased in sales; and ii) the MMNL constrained
regarding MMNL reflects the lack of effect of this incentive to purchase an AF vehicle in small cities where the adequate infrastructure is not available.
Conclusions
This paper introduces a methodology for estimating sales of alternative fuel vehicles by stated choice methods. The key aspect of this approach is to introduce the infrastructure of the refueling network as a procedure which restricts the de-cision set for vehicle buyers and not as one more attribute of the basic discrete choice model. The sensitivity analysis of this model allows both private and public interests to assess their decisions about refueling infrastructure.
Table 3 - Differences in vehicle sales (in thousands) for the period 2016-2030 between the base case and the scenario defmed by 50% the Fuel Cost for the vehicles CT, NGV, HEV, BV.
Model CT NGV HEV PHEV BEV BV FCEV
MMNL -378.3 42.7 -178.7 184.3 65.1 42.0 222.9
CMMNL (b= 3) -345.4 110.9 -154.8 114.0 42.2 89.5 143.6
CMMNL (b= 7) -332.4 131.8 -146.1 90.7 33.1 103.9 119.0
We have analyzed the situation in Spain and have obtained a typology of the existing infrastructure, in space and in time, and estimates for fuel cell electric vehicles in 2030, the results being comparable with those for France. We have proved numerically that the CMML corrects the overestimates of the MMNL.
Acknowledgments
This research was supported by the Spanish Ministry of Economy and Competitiveness of Spain-FEDER ED grant with number TRA2014-52530-C3- 2-P and the Spanish Ministry of Economy and Competitiveness, Castilla-La Mancha Govern-ment and the European Regional DevelopGovern-ment Fund (ERDF) 2007-2013 included in the "Programa Operativo de1
+
D+
i por y para el Beneficio de las Empresas - Fondo Tecnológico".REFERENCES
[lJ Association Francaise pour1 Hydrogene et les Piles a Combustible,A.H2 mobilite France. Study for a fu el cell electric vehicle national deployment plan. 2015 [Technical reportJ.
[2J Germany Trade Invest, i. Retrieved from national hydrogen and fuel cell technology innovation programme. 2013. [3J Hackbarth A, Madlener R. Consumer preferences for
alternative fuel vehicles: a discrete choice analysis. Transp Res Part D Transp Environ 2013;25:5-17.
[4J Hackbarth A, Madlener R. Willingness-to-pay for alternative fuel vehicle characteristics: a stated choice study for Germany. Transp Res Part A Policy Pract 2016;85(C):89-111. [5J Hensher D, Greene W. Choosing between conventional,
electric and LPG/CNG vehicles in single-vehicle households. Lead Edge Travel Behav Res 2001:725-50.
[6J Hidrue M, Parsons G, Kempton W, Gardner M. Willingness to pay for electric vehicles and their attributes. Resour Energy Econ 2011;33:686-705.
[7J Hoen A, Koetse MJ. A choice experiment on alternative fuel vehicle preferences of private car owners in The
Netherlands. Transp Res Part A Policy Pract 2014;61:199-215.
[8J Horne M, Jaccard M, Tiedemann K. Improving behavioral realism in hybrid energy-economy models using discrete choice studies of personal transportation decisions. Energy Econ 2005;27:59-77.
[9J Ito N, Kenji T, Managic S. Willingness-to-pay for infrastructure investments for alternative fuel vehicles. Transp Res Part D Transp Environ 2013;18:1-8. [10J Kallas S. White paper: roadmap to a single european
transport area - towards a competitive and resource efficient transport system. Eur Comm 2011;2011:1-31. [l1J Maness M, Cirillo C. Measuring future vehicle preferences
stated preference survey approach with dynamic attributes and multiyear time frame. Washington, D.C.: Transportation Research Board of the National Academies; 2012. p. 100-9. [12J Manski C. The structure of random utility models. Theory
Decis 1977;8(3):229-54.
[13J Martin Achtnicht GB, Hermeling C. The impact of fuel availability on demand for alternative-fuel vehicles. Transp Res Part D 2012;17:262-9.
[14J Mau P, Eyzaguirre J, Jaccard M, Collins-Dodd C, Tiedemann K. The Neighbor Effect: simulating dynamics in consumer preferences for new vehicle technologies. Ecol Econ 2008;68:504-16.
[15J McKinsey Company EE. UKH2 mobility projet. 2013. [16J Parliament TE, The Council ofthe European Union. Directive
2009/28/ec of the european parliament and of the council of 23 april 2009 on the promotion of the use of energy from renewable sources and amending and subsequently repealing directives 2001/77/ec and 2003/30/ec. Official J Eur Union 2009;52(L 140):16-62.
[17J Parliament TE, The Councilof the European-Union. Directive 2014/94/eu of the european parliament and of the coincil of 22 october 2014 on the deployment of alternative fuels infrastructure. Official J Eur Union 2014;57(L 307):1-20. [18J Potoglou D, Kanaroglou P. Household demand and
willingness to pay for clean vehicles. Transp Res Part D 2007;12:264-74.
[19J Stephens-Romero SD, Brown TM, Kang JE, Recker WW, Samuelsen GS. Systematic planning to optimize investments in hydrogen infrastructure deployment. Int J Hydrogen Energy 2010;35(10):4652-67.
[20J Transnova E. H2moves Scandinavia technical reporting. 2012.
[21J Wang Y, Wang C. Locating passenger vehicle refueling stations. Transp Res Part E Logist Transp Rev
![Fig. 3 - Market shares using the mixed logit model given in Hackbarth and Madlener [3] and the attributes {st};~~~16'](https://thumb-us.123doks.com/thumbv2/123dok_es/6841622.836962/5.892.85.427.99.359/market-shares-using-mixed-logit-hackbarth-madlener-attributes.webp)