Spatial and temporal variations of trace element distribution in soils and
street dust of an industrial town in NW Spain: 15 years of study
A.
Ordóñez
a,*,R.
Álvarez
a,E. De Miguel
b,S. Charlesworth
eaDep. Explotación y ProspeccióndeMinas, University ofOviedo, EscueladeIngenienadeMinas, Energía y Materiales, e/Independencia,13,33004 Oviedo, Asturias, Spain
bEnvironmental Geochemistry Research and Engineering Laboratory, Universidad PolitécnicadeMadrid, Spain
eCentre for Agroemlogy, Water and Resilience, Coventry University, United Kingdom
ABSTRACT
Extensive spatial and temporal surveys, over 15 years, have been conducted in soil in urban parks and street dusts in one of the most polluted eities in westem Europe, Avilés (NW Spain). The first survey was earried out in 1996, and sinee then monitoring has been undertaken every five years. Whilst the sampling site is a relatively small town, industrial activities (mainly the steel industry and ln and Al metallurgy) and other less signifieant urban sourees, sueh as traffie, strongly affeet the load of heavy metals in the urban aerosol. Elemental traeers have been used to eharaeterise the infiuenee of these sourees on the composition of soil and dust. Although PMlO
has decreased over these years as a result of environmental measures undertaken in the eity, sorne of the "indus-trial" elements still remain in coneentrations of coneern for example, up to4.6%and0.5%of ln in dust and soil, respeetively. Spatial trends in metals sueh as ln and Cd clearly refieet sourees from the proeessing industries. The coneentrations of these elements aeross Europe have redueed over time, however the most reeent results from Avilés revealed an upward trend in coneentration for ln, Cd, Hg and As. A risk assessment of the soil highlighted As as an element of coneern sinee its eaneer risk in adults was more than double the value aboye whieh regulatory agencies deem it to be unaeeeptable. If ehildren were considered to be the reeeptors, then the risk nearly doubles from this elemento
1. Introduction
The negative effeets of urbanization and industrialisation on the urban environment are well known (Sancini et al.,2011; Wang et al., 2012), due to the many geoehemical studies of street dusts, road deposits and soils that have been undertaken (e.g. Charlesworth et al., 2003,2011; De Miguel et al., 2007; Loredo et al., 2003; Tositti et al., 2014). These studies found that one of the most important heavy metal sourees in urban environments is vehicle emissions. Whilst the gradual shift from leaded to unleaded petrol has signifieantly redueed vehicular emissions of this element, its persistenee in the urban envi-ronment has been noted by authors sueh as Charlesworth et al.(2003)
*
Corresponding author.E-mailaddresses:[email protected](AOrdóñez)[email protected](E.De Miguel), apxl19@covent:ry.ac.uk (S. Charlesworth).
and De Miguel et al.(1997), particularly near heavily traffieked areas. Traffie also contributes signifieant amounts of Zn, Cu, Ba, Cd and Ni (Charlesworth et al.,2011).
considerable variation in the concentrations of heavy metal s found in urban environments, as was found in ürdóñez et al. (2003). This latter study was carried out in an industrial city in Northern Spain: Avilés, and was based on the collection and analysis of street dusts and soils. The study found that there were concerning levels of elements such as Zn, Cd, Hg and Pb in the street dusts related to industrial activities and exhaust emissions, with similar distributions but lower concentrations in the soil samples. Such metal concentrations have the potential to have significantly negative impacts on the health of those living in such industrialised cities.
Trends with time across Europe appear to reflect the declining economic situation, with metals exhibiting a general decline in their deposition (sampled in mosses across Europe) in recent decades. For example, between 1990 and 2005, the average concentrations of As, Cd, Cr, Cu, Fe, Hg, Ni, Pb, V and Zn declined by values ranging from 11% (Cu) to 77% (Pb) (Harmens et al., 2013). This particular study reported on concentrations of a variety of metal s as well as nitrogen from 3 regions in northern Spain (La Rioja and Navarra in the NE, and Galicia to the NW) but not Asturias.
Many studies on street dust have focused on elemental concentra-tions and source identification (Charlesworth et al., 2011; De Miguel et al., 1997; Ferguson and Kim, 1991). Heavy metals in urbanized areas can accumulate on topsoil from atmospheric deposition by sedi-mentation, impaction and interception (Sezgin et al., 2004), with lengthy persistence (Alloway, 1990; Kelly et al., 1996). Inhalation of suspended particles and ingestion of dust particles and soils (especially in the case of children) are among the possible routes through which people can be exposed to these elevated levels of trace elements. If chil-dren and the elderly are exposed to an environment with high metal contamination, their health may be affected (Charlesworth et al., 2011;Li and Liu, 2001). Consequently, the geochemical investigation
of pollution in soils and street dust particles is an important contribution to the characterisation of the urban environment and associated poten-tial health risks.
The aim of this research was to carry out a comprehensive urban geochemical study focussing on urban parks and roadside dusts in a tra-ditionally industrial Spanish town.lt assesses, both spatially and tempo-rally, heavy metal contamination over a 15 year period (1996-2011), investigating possible sources ofthe metals and also the potential impli-cations of elevated levels on human health.
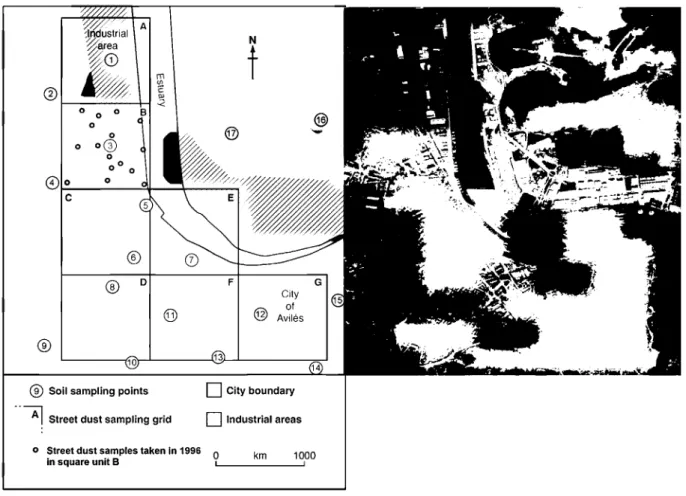
2.Afea ofstudy
Avilés is a city located on the coast of Asturias, NW Spain (Fig. l).lt used to be a markedly industrial area, including the steel industry and non-ferrous metal production (mainly Zn and Al), glass production, fer-tilizer and manufacturing, but some of these activities have declined over the last few years. Factories related to Zn, Al and steel production and processing are located to the N, NE and E of the city, respectively. Due to industrial growth in the city the population quadrupled from 1950to 1970, but recently decreased, currently standing at 83,000 inhabitants (SADEI, 2014).
Environmental guideline values for several substances have been dramatically exceeded in the pasto For example, during December 1979,the level of total suspended solids was 300 times the maximum allowed value. This lead to Avilés being declared a Polluted Atmosphere Area in january 1981, the most polluted city in Spain, and one of the most polluted European cities (Gobierno del Principado de Asturias, 2014).Suspended particulate matter was of particular concern, leading to high incidences of asthma. Industrial restructuring began in 1990: several factories c10sed or introduced more conservative environmental measures and monitoring plans. Also, a series of actions undertaken by
Cily 01
@
AvilésF D
®
0
®
/ A
;Industrial
N
~área
t
%0
6
m@
~c:'"
-<
o o o B
o
@
o o
00)
o00
o8)0
oe
®
®
Soil sampling points----¡¡
Street dust sampling gridD
City boundaryD
Industrial areaso Street dust samples taken in 1996 O km 1000
In square unlt B LO ...JI
local authorities over the last 30 years have helped to meet air quality objectives, resulting in regeneration of the urban environment. Cur-rently, only one monitoring station (tocated in the N of the city) revealed that the allowed levels ofPMlOhad been exceeded, due to its
proximity to an area of storage and handling of bulk ore from the porto Analysis ofthe partieles retained on the filter from that monitoring station had high concentrations ofZn and S (up to 90%), but these were not found at the other stations (Gobierno del Principado de Asturias, 2014). Fig. 2 shows the general downward trend in average PMlOvalues
registered across the city's monitoring network during 1996-2013. The same figure shows the Industrial Production Index (tPI) of metal indus-tries in Asturias which increased until recently, when it was affected by the economic crisis.
Major roads with high vehicular traffic density cross the city reach up to 20,000 Iight vehieles/day (Ordóñez et al., 2003); however, away from these major roads the rest of the city is rather quieto 50% of the houses were built befo re 1960 and 81% before 1980, with the built envi-ronment in total occupying an area of more than 5 mi Ilion m2
,which
in-creases on average about 1.4% per year (SADEI, 2014).
The local bedrock geology consists mainly of elastic rocks (conglom-erates), red elays, carbonates (limestones and dolostones) and marl s of Mesozoic age (López and Flor, 2008), covered by recent deposits near the estuary, which has been partly filled up artificially. Consequently, the terrain is basically flat, with an elevation ranging from Oto 140 m aboye sea level (SADEI, 2014).
According to the Agencia Estatal de Metereología, the elimate is humid, with an average yearly precipitation over the last 45 years of 1100 mm (effective rainfall of 41 Omm per year) and a mean temper-ature of 13 oc. The wind direction is predominantly west (55%), although wind velocities are generally low (average of3-4 m S-l). The wind direction explains maximum PM10values registered at
some of the city's monitoring stations (Gobierno del Principado de Asturias, 2014).
3. Methods
Street dust, the particulate matter deposited onto urban roads and pavements, has high spatial variability, so it is essential to select the appropriate sampling designo Therefore, the urban area was divided into seven mapping squares of 1 km2
each, designated A to G (Fig. 1). Sixteen sampling points were randomly distributed in each mapping unit, yielding a total ofl12 subsamples in both residential and industrial sectors. Sampling was always carried out one week after the last pre-cipitation evento Sampling was performed using a small broom and a dustpan, collecting dust deposited mainly on the road, elose to the pavement. The approximately 150 g of street dust collected at each
125 120 ...
~ -PM10
c::
E ...
-
---IPI ><el 100 110 Q)
2:
,
,
,
"'C-=
'E
,
,
.S!
s::: 75,
,
,
100.2
s:::tí
o
...
\u :::l
o \ "'C
:f
50....
90 o\
...
a.
,
,
\ a.Q)
,
¡¡¡el \
,
.¡:l'il 25 SO
...
I U;Q) I :::l
~
I "'Cs:::
o 70
<D "- <Xl <J) o
o
N C')..-
U) <D "- <Xl <J) o ~ N C')<J) <J) <J) <J) o o o o o o o o o
o o o o
~ ~ ~ ~ o o o o o o o o o oN N N N N N N N N N N N N N
Fig. 2. Average PMlOcontent in Avilés and the Industrial Production Index ofmetal
indus-tries in Asturias (2005 referenced) from 1996 - 2013.
sampling point was combined to represent one whole mapping unit. This sampling design was maintained in all four sampling campaigns, although the location of the 16 subsamples could not be maintained, due to the variability in dust deposition. As an example, the location of the 16 subsamples taken in unit B in the 1996 campaign is shown in Fig. 1. As detailed in Ordóñez et al. (2003), Visman methodology (Visman, 1947) was applied in order to evaluate precision in terms of estimating the sampling unit's mean value.
In urban soils it is not possible to apply a systematic sampling design as their location depends on there being open areas such as parks, yards, roads, roadsides, private gardens, and undeveloped land, from which to sample, and these are not evenly distributed across the city. Samples were collected from public parks and other green areas to cover the dif-ferent districts of the city and assess possible influences from traffic or industry as a function of distance from their potential source. Sampling points were located at about 15 m from the nearest major road or street with high traffic density. Soils collected were not necessarily restricted to the urban area, unlike the street dust campaign, and therefore cov-ered a larger area (10 km2
)ineluding soils surrounding the city. As far
as the authors know, the areas where soils were collected are not fertil-ized and the potential contribution of compost to the trace element load was therefore considered negligible.
Soil samples were composites of five subsamples (of about 0.5 kg each), which were taken according to a cross pattern (centre and extremes), with 5 m distance between subsamples. These were taken using garden tools (a small pick to make a surface hole and a plastic shovel to collect the samples). In 1996,40 samples in total were col-lected (Ordóñez et al., 2003), whereas in campaigns which followed, only 17 samples were taken from the same sites (designated nos. 1 to 17), chosen from the locations identified in 1996 (Fig. 1); these locations were selected as the most visited green spaces in the centre of the city, some associated with residential blocks and some with the city outskirts. In 1996 and 2006, samples were collected from the upper 15 cm ofthe soil profile, whereas in 2001 they were collected from the upper 25 cm; in the last campaign (2011), samples were taken at both depths (15 and 25 cm) every time in order to evaluate the vertical mobility of trace elements in the soil profile and how this translocation may affect the concentrations reported for different depths.
In order to avoid metal contamination, only plastic tools were used for dust and soil sampling. AII the samples were kept in plastic bags and taken to the laboratory. After drying for 72 h at 45 oC, each sample was sieved through a 2 mm non-metallic mesh to remove large par-tieles, and then carefully homogenised and sieved to obtain the <147 flm fraction (partieles that can be easily resuspended). After reduction by repeated quartering, 0.5 g subsamples were digested using 3 mi of 3:1:2 HCI:HN03:H20 at 95 oC for 1 h and diluted to
10 mi with water. Multielemental analyses of all samples from all cam-paigns were determined by ICP-MS at accredited ACME Analytical Lab-oratories, in Vancouver (Canada). Quality controls involved routine analyses of standards and duplicates. Approximately 5% of the samples were analysed as internal and external control samples; the variability was found to be <10% for all elements analysed.
Descriptive statistics of the analytical data, as well as multivariate analysis techniques, i.e. Cluster Analysis, were performed to describe and interpret the results.
Table 1
Descriptive statistics of the analytical data found in street dust from the four sampling campaigns (n= 7 at each campaign).
Min. Max. Arith. mean Median Coef. variation
1996 2001 2006 2011 1996 2001 2006 2011 1996 2001 2006 2011 1996 2001 2006 2011 1996 2001 2006 2011
Ag (mgkg-1) 0.40 0.30 0.40 1.10 4.55 3.20 2.90 10.9 1.73 1.20 0.97 3.76 1.75 0.40 0.80 3.20 0.81 0.97 0.90 0.89
Al (%) 0.72 0.61 0.46 0.71 1.12 0.81 0.72 1.07 0.86 0.70 0.62 0.84 0.86 0.70 0.67 0.78 0.17 0.09 0.17 0.16
As(mgkg-1) 11.0 10.9 9.70 16.4 26.0 29.8 29.4 110.1 18.2 18.7 22.1 37.6 18.0 18.8 24.0 28.7 0.30 0.32 0.33 0.86
Ba(mgkg-1
) 244 303 248 185 489 446 407 640 369 386 326 400 375 378 327 405 0.21 0.14 0.19 0.38
Ca (%) 9.08 7.96 5.75 9.90 12.0 10.1 11.0 14.1 10.2 9.11 8.05 12.0 9.7 9.17 7.21 12.3 0.11 0.08 0.25 0.12
Cd (mgkg-1
) 9.60 6.70 4.00 11.0 104 82.6 41.3 139 31.2 26.0 15.4 45.1 15.7 11.1 11.2 26.1 1.07 1.16 0.82 1.01
Co (mgkg-1) 5.00 3.4 3.7 6.4 11.50 8.9 6.5 19.2 7.36 5.44 5.24 10.9 6.50 4.70 5.20 10.7 0.33 0.36 0.17 0.41
Cr(mgkg-1) 32.0 46.2 29.0 57.0 54.5 73.4 67.0 214 42.4 55.7 50.6 109 44.5 55.2 52.0 102 0.20 0.16 0.25 0.49
Cu(mgkg-1) 104 159 102 167 374 222 319 966 203 189 212 370 171 189 189 265 0.51 0.12 0.38 0.75
Fe (%) 3.24 2.14 1.47 2.36 5.74 3.30 3.58 6.56 4.30 2.63 2.51 3.87 4.60 2.59 2.45 3.82 0.21 0.18 0.30 0.37
Ga(mgkg-1
) 1.00 1.00 2.00 3.00 2.00 6.00 1.57 1.57 3.00 1.00 2.00 3.00 0.50 0.34 0.47
Hg(mgkg-1
) 1.20 0.31 0.18 0.90 10.8 4.03 1.08 10.3 3.40 1.40 0.60 2.93 1.95 0.61 0.61 1.53 0.99 1.09 0.49 1.14
K(%) 0.09 0.07 0.06 0.10 0.24 0.18 0.17 0.18 0.14 0.11 0.11 0.13 0.15 0.09 0.10 0.13 0.33 0.38 0.32 0.21
La (mgkg-1) 8.0 9.0 6.0 8.0 11.5 31.0 8.0 11.0 10.4 16.4 7.57 9.14 11.0 11.0 8.00 9.00 0.13 0.57 0.10 0.12
Mg(%) 0.94 1.01 0.73 0.83 1.29 1.84 1.20 1.23 1.10 1.47 0.85 0.98 1.06 1.44 0.77 0.90 0.12 0.21 0.20 0.17
Mn (mgkg-1) 1194 1301 604 1074 3149 2415 1467 4761 1770 1793 1095 2522 1446 1766 1106 2362 0.41 0.21 0.24 0.56
Mo (mgkg-1) 3.0 3.5 2.9 3.6 5.0 6.9 7.2 10.3 4.2 4.7 5.2 6.9 4.0 4.5 5.3 7.2 0.17 0.22 0.30 0.35
Na (%) 0.03 0.02 0.02 0.03 0.05 0.04 0.11 0.09 0.04 0.03 0.04 0.05 0.04 0.03 0.03 0.04 0.21 0.25 0.71 0.51
Ni (mgkg-1
) 18.0 15.0 16.0 22.4 50.0 25.8 27.1 69.3 28.9 21.3 21.8 43.3 28.5 21.3 24.9 33.8 0.36 0.18 0.23 0.50
P (%) 0.04 0.05 0.07 0.06 0.23 0.32 0.13 0.28 0.11 0.13 0.10 0.14 0.07 0.08 0.08 0.12 0.69 0.78 0.24 0.48
Pb(mgkg-1) 330 162 157 208 964 919 705 1482 559 400 289 496 484 278 207 320 0.46 0.69 0.67 0.92
Sb (mgkg-1) 7.0 4.8 5.4 5.7 9.0 8.9 15 20 8.0 6.9 8.3 10.4 8.0 7.2 7.6 8.8 0.08 0.23 0.40 0.46
Sr (mgkg-1) 222 208 159 255 310 422 242 362 266 277 201 315 271 226 192 324 0.13 0.34 0.16 0.11
Th (mgkg-1
) 4.00 1.70 1.10 1.60 8.00 2.00 1.90 2.30 6.50 1.90 1.50 1.96 6.50 1.90 1.50 2.00 0.21 0.06 0.19 0.13
Ti(%) 0.02 0.02 0.01 0.02 0.03 0.03 0.02 0.04 0.02 0.02 0.02 0.03 0.02 0.02 0.02 0.03 0.21 0.12 0.19 0.31
V(mgkg-1
) 25 22 18 29 35 29 28 76 28 26 23 44 28 25 22 39 0.12 0.11 0.15 0.36
W(mgkg-1) <2 0.7 0.4 0.7 4.0 1.5 1.9 6.5 3.5 1.0 0.9 2.7 3.5 0.9 0.7 2.2 0.20 0.30 0.59 0.69
12 120 160
... 1996 140
10 100
-0-2001 120
8 80 ...-2006 :;- 100
Cl Cl Cl
Cl 6 Cl 60 -0-2011 Cl 80
2: 2: 2:
Cl 4 1/)
40 "tl 60
<1: <1: ()
40
2 20
20
O O O
A B e D E F G A B e D E F G A B e D E F G
Square unit
12 1600 50000
1400 45000
10 40000
1200
8 35000
:;- 1000
bl 30000
Cl Cl
Cl 6 Cl 800 Cl 25000
2: 2: 2: 20000
Cl 4 ..Q 600 l:
J: D.. N 15000
400
2 10000
200 5000
O O O
A B e D E F G A B e D E F G A B e D E F G
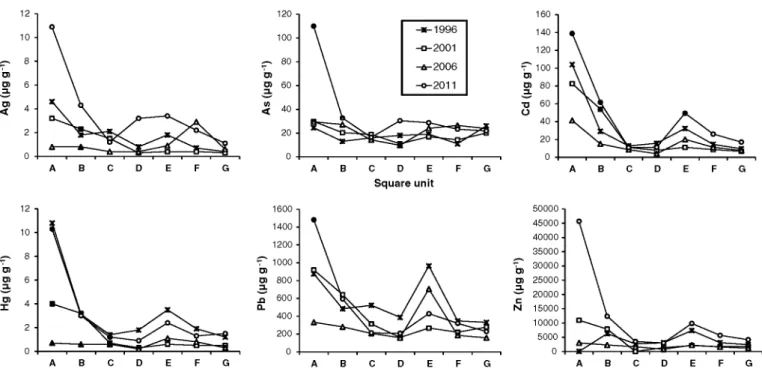
Fig.3. Metal contents found in the square units sampled for street dust.
chemical composition of metal-bearing particles (Miler and Cosar, 2012,2013,2015).
The mineral composition of the same samples used for SEM was determined by X-ray Diffraction (XRD), utilising the powder method, and a Bruker 08 Discover diffractometer, working with KaCu radiation and an Ni filter. The applied voltage and anodic current were 45 kV and 40 mA, respectively.
The methodology used by Wang et al. (2012) when defining the concept of "urban environmental entropy" to investigate the effect of urbanization on the overlying atmosphere, was applied to this case. Urban growth is a necessary condition for the urban system to prevail but as it is irreversible, it may decrease the quality of the system. Entropy is a commonly used way to address urban sprawl; it must be kept within a range in which the system is sustainable. Environmental pollution generates excess entropy; the greater the entropy, the greater the effect on the environment (Cabral et al., 2013; Ouyang et al., 2008). The rela-tionship between the development of urbanization and street dust quality in Avilés between 1996-2011 has therefore been studied through the determination of urban environmental entropy in the 7 square sampling units, based on statistical analysis of the main metals (Al, Ba, Fe, Pb and Zn) present in the samples.
Lastly, the potential health effects on the urban population of the exposure to trace elements in dust and soil were derived from a risk assessment following the USEPA methodology. To characterise the sys-temic and carcinogenic risk, a Hazard Index (Eq. (1)) and a Cancer Risk (Eq. (2)), respectively, were determined. The chronic average daily dose (CADO) or concentration in air (Cair)was divided by the corresponding
reference dose (RfD) or reference concentration (RfC), and the Iife-time average daily dose (LADO) or concentration in air was multiplied by the corresponding slope factor (SF) or unit risk (UR). Additivity of adverse health effects was assumed for mixtures of elements and mul-tiple exposure routes.
Chronic and Iifetime average doses through ingestion, inhalation and absorption through the skin were calculated using USEPA's default exposure parameters for a residential scenario. Toxicity values were retrieved from the US Department ofEnergy's Risk Assessment Infor-mation System (USDoE, 2014), except the oral reference dose for Pb, which was derived from the World Health Organization's Cuidelines for Drinking Water Quality. Dermal toxicity values have been deter-mined from oral values, multiplying reference doses and dividing slope factors by the corresponding gastrointestinal absorption factor. The concentration term used in the estimate of reasonable maximum exposure was the upper Iimit of the 95% confidence interval for the arithmetic mean (calculated with ProUCL 5.0 software (USEPA, 2014)).
HI ' " HQ HQ= CADO [Cair ]
= ¿ ¡ i RfD [RfC] (1)
Hg 1
lo 2
Pb 1
TI 2
c,
Cd Ag
AS
Sb 1
<o
Ga 1
>-p
Al Se Na 1 Ca Fe
T; C,
\' r·An 1
Mg 1
1f- Sf- 7f- 3f- sf- Sf-lf-
- 3f-9f--
~B-
~p--~W
:W
9f- 2f- 7f-4f----¡
t-~
10 15 20 25
RISK= L¡RISKi RISKi= LADD[Cair ] .SF [UR] (2)
Fig. 4. Clustering ofvariables analysed for street dust in 2011 (Linkage method: Ward;
4. Resultsanddiscussion
4.1. Street dust
A statistical summary of the analytical results of the 1996, 2001, 2006 and 2011 sampling campaigns is shown in Table 1. The coefficient ofvariation (standard deviation/mean) is low for Ca, Mg, Sr, V, La and Th. The concentrations of these geogenic elements (ürdóñez et al., 2003) show Iittle variation in the area due to their natural origin.ln con-trast, Zn, Cd, Hg, Ag, Pb and As (in the 2011 sampling campaign), have high coefficients of variation and heterogeneous distribution, corre-sponding to anthropogenic origins. The concentrations of the latter ele-ments in every square unit for the four sampling campaigns are shown in Fig. 3. The highest concentrations ofthese elements were found in the northern sampling square unit (A), related to the raw materials used in the Zn metallurgical industry, located in the northern section of the city. The concentrations of some metal s found in some sampling units were noticeably high. For example, elevated concentrations of Zn (4.6%), Pb (0.15%) or Cd (139 mg kg-1
)were found in unit A in 2011. To the
best knowledge of the authors, such values have not been exceeded in street dust in other cities in the world (Charlesworth et al., 2011).
Cluster Analysis (Fig. 4) revealed several groups of highly correlated elements, suggesting common origins. There was a distinct separation
Table2
Reduction(%) of concentrations of pollutants in the Avilés street dusts compared with
trends across Europe, according to Harmens etal.(2013).
Element Europe" Avilés Europe" Avilés Avilés net change
1990-2005 1996-2006 2005-2010 2006-2011 1996-2011
Al na -28 -28 35 -2
As -26 21 -25 70 107
Cd -51 -51 -7 193 45
Cr -43 19 -23 115 157
Cu -11 4 -6 75 82
Fe -52 -42 -15 54 -10
Hg -23 -82 -20 388 -14
Ni -33 -25 -12 99 50
Pb -77 -48 -36 72 -11
V -57 -18 -27 91 57
Zn -34 -73 -7 557 74
a - ve= reduction in concentration,
+ve
= increase in concentration.between elements with a c1ear anthropogenic origin (first cluster) and those with a natural or mixed origin (second cluster). The first sub-group of elements (Hg, Zn, Pb, TI, Cu, S, Cd, Ag, As and Sb) within the first cluster can be Iinked to the Zn processing industry, which uses sphalerite (ZnS) as a raw material, in which Fe, Cd and Pb are frequently found and less so Mn, Hg, In, TI, Ca, Ce, Sb, Sn, Ag, Ba, Au, Bi and Cu
.---A
-B
e
ED F
G
I
Fig. 5. Contour maps of metal concentrations found in street dust: A) Zn in the four sampling campaigns; B) Cd, Pb, Fe and Cr in the most recent campaign. All concentrations in mg kg-1
,
Table3
Urban environmental entropy calculated in terms of metal content in street dust of the7
sampling units between1996 and 2011, according to the methodology defined by Wang
et al.(2012).
Sampling unit Al Ba Fe Pb Zn Total
A -0.007 -0.001 -0.054 0.009 0.318 0.130
B 0.020 -0.002 -0.170 0.002 0.122 -0.017
e
0.034 0.001 -0.447 -0.006 0.017 -0.192D 0.006 0.001 -0.081 -0.002 -0.001 -0.037
E -0.150 0.001 0.820 -0.053 0.251 0.485
F -0.004 0.007 0.148 -0.001 0.051 0.092
G -0.026 -0.001 -0.044 -0.001 0.021 -0.011
(Mindat, 2014). Anju and Banerjee (2011) found high, correlated con-centrations ofheavy metals including Pb, Zn, Mn, and Cd in the soils sur-rounding historical Pb-Zn mining and smelting areas in India, and Xu et al. (2013) found high As contents in the street dust of a Zn smelting district in China.
Another subgroup in the first cluster was composed ofCo, Ca, P, Al and Se. These are related to aluminium processing by the Bayer process, using bauxite as the raw material. The main impurities in bauxite are SiOz, Fe, Ti, Be, Ca, Cr, Ca, Mn, V, P, K, S, Na, B, Ba, Cd, Co, Pb and Sc, de-pending on the initial composition of the ore and also processing condi-tions. Most bauxites contain between 0.001-0.05% of CaZ03, and are the main source ofCa (RACI, 2011). Ca and Al are in the same column ofthe periodic table and therefore have similar chemical properties, reflected in their similar distribution in the present study. The second main cluster included the alkali elements Na-K and Ca-Sr, whose origins are basically geogenic/natural. Fe, Ti, Cr, V, Mn and Mg, most Iikely have mixed origins, i.e. natural and related to steel production and pro-cessing in coke ovens. The emissions from such facilities can be very broad, including organic compounds, as well as As, Cd, Be, Cr, Pb, Ni, Mn, Hg, Se, V, Cu and Zn (Craham and Holtgrave, 1990). Trace elements found in the coke are directly related to those present in raw coal and are highly variable, depending on its origino The steel industry in the study area recently measured atmospheric annual emissions consis-tently aboye 60 kg As, Hg and Cd, 160 kg Cr, 500 kg Cu, 190 kg Ni, 2 t Pb, 580 kg Zn and 88 t ofPMlO(MACRAMA, 2014).
Sampling grids A and B, located to the north ofthe study area were c1early different from the rest, with a higher industrial influence, and higher concentrations of Zn, Cd and Hg. Some of the metals discussed here can have typically urban origins such as traffic or heating emissions, construction, and urban degradation of metal surfaces (Charlesworth et al., 2011). However, in this case, the industrial influence is so prevalent that its contribution masks any other potential sources.
Fig. 5A shows contour maps of Zn concentrations found in the four sampling campaigns; although the range was variable, the spatial distri-bution of this element was similar in the four maps; it tended to steadily increase in a northerly direction. The spatial distributions ofCd and Pb are shown in Fig. 5B and have the same tendency of increasing concen-tration towards the site where the Zn smelter is located. In contrast, elements such as Fe and Cr (Fig. 5B) showed a different distribution, with maximum contents in square E, c10se to the steel industry.
Over time, the concentrations of Zn, Cd, Hg, Ag and As in street dust decreased from 1996 to 2001, then either remained stable or further de-creased from 2001 to 2006, and then rose to maximum values in 2011. These reductions in concentrations between the first and second sam-pling campaigns are in agreement with the European trend found in the study carried out by Harmens et al. (2013), leaving methodological differences aside (Table 2). In the case of Avilés, they can be related to changes in the method of transport of the Zn ore from the harbour to the factory which occurred in 1998. A covered conveyor belt replaced the lorries previously used to transport the dusty ore by road, moving the ore directly from the harbour to the factory, potentially reducing the release of particulate material and thus its incorporation in the street dust. A second important factor was that in 2004 the Spanish mine supplying the mineral to the Zn smelter c1osed, and the ore had to be imported, principally from Canada and Alaska. Due to c1imatic con-ditions in these countries, mines are only able to open half oftheyear, so the mineral is delivered to the N of Avilés in summer and autumn. It is then stored in uncovered heaps and there is great potential for it to be incorporated in street dust. For the rest of the year (winter and spring), mineral particles will only make a significant contribution to the trace element load of street dust if they are resuspended from the heaps by NW winds which are infrequent during these months. This fact would explain the increased concentrations of elements associated with the
1mm
Point C O Al Si S Ca Mn Fe Zn Pb Hg
1 22.3 77.7
2 24.2 30.0 1.6 6.1 0.8 2.78 28.5 6.1
3 23.9 30.3 1.0 1.6 2.9 40.3
4 27.0 18.0 1.0 0.54 0.5 0.90 52.1
5 17.3 35.1 2.2 2.2 0.8 42.4
6 22.5 25.8 0.8 6.02 2.1 0.87 1.72 40.2
Table4
Descriptive statistics of the results for urban soils in the four sampling campaigns (n= 17, same sample locations in al! four campaigns).
Min. Max. Arith. mean Median Coef. variation
1996 2001 2006 2011 1996 2001 2006 2011 1996 2001 2006 2011 1996 2001 2006 2011 1996 2001 2006 2011
Sampling 0.15 0.25 0.15 0.15 0.25 0.15 0.25 0.15 0.15 0.25 0.15 0.25 0.15 0.15 0.25 0.15 0.25 0.15 0.15 0.25 0.15 0.25 0.15 0.15 0.25
depth (m) Ag(mgkg-1)
<0.3 0.10 0.20 <0.1 <0.1 1.20 0.50 1.30 1.90 0.60 0.69 0.19 0.62 0.72 0.22 0.7 0.1 0.5 0.55 0.2 0.41 0.65 0.52 0.84 0.62
Al (%) 0.60 0.59 0.76 0.69 0.73 2.49 1.67 1.58 2.95 2.31 1.55 1.19 1.14 1.39 1.53 1.52 1.18 1.2 1.26 1.51 0.36 0.30 0.20 0.40 0.32
As (mg kg-1)
8.00 6.40 5.30 7.70 9.00 117 39.0 30.7 39.8 61.1 30.8 16.3 15 19.3 24.3 19 14.1 12.8 16.8 23.4 0.96 0.51 0.44 0.43 0.54
Ba (mg kg-l) 77.0 67.0 40.0 88.0 70.0 401 399 550 921 674 185 201 199 321 249 177 153 161 220 223 0.45 0.55 0.67 0.72 0.68
Ca (%) 0.24 0.19 0.21 0.23 0.24 10.9 8.46 13.5 9.48 6.56 1.69 1.36 2.35 4.12 2.06 0.64 0.58 1.56 3.25 1.13 1.64 1.43 1.33 0.75 1.09
Cd(mgkg-l) 0.80 0.20 0.40 1.10 0.30 7.30 6.20 15.6 28.6 6.20 2.53 1.58 3.79 7.84 1.32 2.1 1.2 2.1 2.8 0.8 0.67 0.90 1.14 1.13 1.10
Co (mg kg-1) 2.00 1.90 1.90 0.90 2.60 30.0 10.2 10.4 11.4 14.1 9.59 5.36 5.45 7.28 7.04 8 5.5 5.1 7 6.7 0.78 0.39 0.41 0.39 0.46
Cr (mg kg-1) 9.00 9.70 11.0 12.0 12.0 40.0 107 91.0 75.0 38 22.5 23 24.5 32.8 20.9 21 17 20 27 22 0.37 0.97 0.76 0.47 0.32
Cu(mgkg-l) 21.0 13.0 9.20 8.00 10.5 243 67.0 138 435 89.1 70.9 30.9 45.5 95.5 28.9 46 26.7 29.8 53.3 23.2 0.84 0.55 0.74 1.10 0.71
Fe (%) 1.80 1.32 1.40 1.40 1.47 9.83 9.89 7.35 6.77 4.18 4.03 2.62 2.6 2.92 2.58 3.23 1.91 2.28 2.62 2.6 0.57 0.77 0.53 0.45 0.29
Ga(mgkg-1
) 2.00 2.00 2.00 2.00 5.00 4.00 8.00 7.00 4.00 3.53 4.59 4.53 4.00 4.00 5.00 5.00 0.25 0.18 0.31 0.31
Hg(mgkg-1
) 0.21 0.06 0.07 0.24 0.25 2.18 1.32 3.62 3.02 1.40 0.72 0.42 0.62 0.92 0.74 0.51 0.28 0.39 0.74 0.68 0.79 0.76 1.33 0.87 0.50
K(%) 0.07 0.07 0.08 0.07 0.07 0.42 0.34 0.29 0.49 0.57 0.21 0.16 0.17 0.2 0.19 0.19 0.13 0.17 0.17 0.15 0.53 0.52 0.35 0.50 0.66
La(mg kg-1
) 8.00 6.00 8.00 7.00 9.00 36.0 16.0 19.0 21.0 26.0 16.8 11.9 11.2 12.4 14.9 16.0 13.0 11.0 13.0 14.0 0.40 0.24 0.25 0.28 0.29
Mg(%) 0.09 0.11 0.14 0.05 0.12 3.53 1.55 1.53 2.93 2.57 0.6 0.53 0.6 0.9 0.85 0.34 0.4 0.48 0.62 0.54 1.32 0.78 0.63 0.85 0.84
Mn(mgkg-1)
246 191 148 53.0 112 4261 6821 2388 2257 3099 1190 822 721 958 658 601 405 492 745 493 1.08 1.90 0.90 0.68 1.02
Mo(mgkg-1
) <0.1 0.40 0.20 0.60 0.30 3.00 3.90 1.80 6.10 2.10 1.43 1.12 0.92 1.89 0.84 1 0.7 0.8 1.4 0.6 0.60 0.91 0.43 0.74 0.64
Na(%) 0.01 0.004 0.008 0.007 0.003 0.04 0.06 0.04 0.04 0.05 0.01 0.01 0.01 0.02 0.01 0.01 0.01 0.01 0.01 0.01 0.58 1.03 0.46 0.47 1.14
Ni (mgkg-l) 5.00 4.70 5.60 4.30 5.70 35.0 27.6 21.7 31.7 23.8 16.9 13.4 12.9 17.9 15.8 15 11.8 12.4 16.4 16.7 0.53 0.48 0.33 0.38 0.35
P (%) 0.04 0.03 0.02 0.05 0.03 0.20 0.22 0.21 0.62 0.10 0.07 0.07 0.09 0.22 0.05 0.06 0.06 0.09 0.17 0.05 0.60 0.60 0.58 0.75 0.39
Pb (mg kg-1
) 54.0 46.1 23.0 37.2 27.6 353 259 793 462 471 154 107 194 181 114 155 79.3 125 141 74.1 0.54 0.65 0.95 0.69 1.00
Sb (mg kg-1)
<1 1.10 1.70 0.80 0.20 15.0 6.10 4.90 8.70 2.30 6.6 2.67 3.07 3.48 1.11 6 2.5 2.6 2.7 0.8 0.67 0.49 0.38 0.66 0.63
Sr (mg kg-1)
10.0 9.00 11.0 14.0 8.00 381 200 204 230 115 45.6 36.8 56.6 106 45.2 24 19 37 98 28 1.92 1.24 0.86 0.65 0.77
Th(mgkg-1)
<1 1.60 1.40 0.20 2.00 7.00 4.20 6.70 4.90 7.80 5.08 3.18 2.68 1.66 3.52 5 3.5 2.6 1.1 3.3 0.31 0.24 0.45 0.78 0.45
Ti (%) 0.01 0.002 0.004 0.002 0.002 0.02 0.05 0.02 0.03 0.01 0.01 0.008 0.009 0.009 0.004 0.01 0.005 0.006 0.007 0.004 0.25 1.50 0.70 0.67 0.55
V(mgkg-1)
22.0 13.0 19.0 20.0 19.0 55.0 92.0 43.0 54.0 45.0 34.8 27.0 27.3 33.2 28.4 32 22.0 25 32 29 0.28 0.66 0.25 0.25 0.26
W(mgkg-1)
<0.1 <0.1 0.10 <0.1 <0.1 <0.1 1.20 0.60 0.80 0.20 <0.1 0.44 0.18 0.36 0.13 <0.1 0.3 0.1 0.3 0.1 0.83 0.73 0.52 0.43
Zn ore in the 2011 campaign (carried out in the summer) relative to the 2006 one (undertaken atthe end of the year). The change of origin - and composition - of the ore in 2004 is most likely also the explanation of the higher concentrations of Ag and As in street dust after that date (although the latter can be also related to the steel industry).
In spite of its increase in concentration in the northern grids in 2011, Pb was generally lower in comparison with the first campaign. This is because not all of the Pb found in the street dust was necessarily associ-ated with the Zn metallurgical industry since one major source ofthis element at the time that the first sampling was undertaken was traffie. This was highlighted by Ordóñez et al. (2003) due to the enrichment of Pb along busy roads, but the shift to unleaded petrol has since reduced the emissions of this metal. The concentration of Ba, for example, usually linked to diesel vehicle emissions, has remained steady dur-ing monitordur-ing. Concentrations of Al in street dust have not undergone substantial changes during this periodo Oespite the gradual substitution of coal for gas in the heating systems of the city, which could lead to a reduction of Cu concentration, the potential input of this metal from other sources such as coke production and traffic, has probably caused it to slightly increase.
The entropy results reinforce the geochemical discussion on tempo-ral and spatial variability (Table 3). The total values of entropy are negative for four units (B, C, O and G) which implies that urbanization has not been negatively affected by the presence of metals in the street dust in these areas, in contrast to units A, Eand F. The fact that the con-centration ofFe and Zn increased in sampling units Eand A respectively, is also reflected in an increase in urban entropy; this means a negative effect over these units, which is related to industrial emissions. By analysing the absolute value of entropy, urban activities over time have not significantly affected street dust Al content, although unit E has c1early improved in relation to this element. The same can be said for Ba, as the entropy values are low for all the units; relating this metal to vehicular emissions, the central units (C, O, E and F, where most traffic concentrates) register less improvement (entropy>O), as traffic increases urban entropy in these neighbourhoods. In contrast, Pb emissions are now more related to industry (northern units: A and B) than traffie.lt is noticeable that the entropy results for Zn are negative in only one unit (O); this metal is the main input to the total entropy of the city.
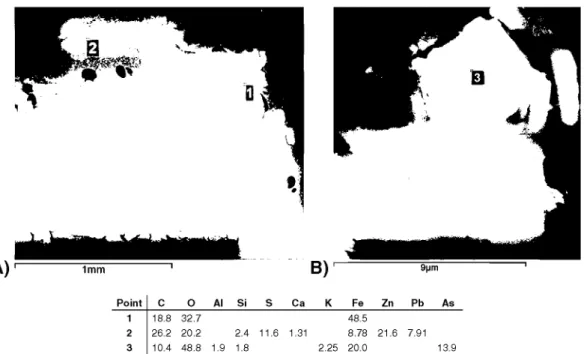
Some examples of the SEM-EOAX analyses of street dusts are shown in Fig. 6. In the sample from the N of the city, this shows that particles
essentially contain0,C, Fe, Si, Al and Ca with concentrations of metal s such as Zn, Pb or Hg high enough to be detected in some of the particles. Particles of sulphides such as sphalerite and Zn carbonates were c1early identifiable in Fig. 6A, with an Hg-rich particle (probably cinnabar) in Fig. 6B. XRO analysis indicated quartz as the major crystalline mineral, and moderate quantities of calcite and sphalerite were also found.
4.2. Soils
The analytical results obtained for soils in the four sampling cam-paigns are summarised in Table 4. As expected, the concentrations of anthropogenic trace elements, which are deposited on the surface of the soil as resuspended street dust and particulate atmospheric aerosol, decrease with depth. Concentrations ofZn, Cd, Ag, Pb and Ba are 6.2, 5.9, 3.2,1.6 and 1.3 times higher in the shallower samples.
Comparing campaigns with the same sampling depth, elements of anthropogenic origin gene rally increase with time in the soil. In 15 years, average contents of Zn, Cd, Ba and Pb have increased by 275%,210%, 74% and 17%, respectively. Contents of these elements have particularly increased to the N of the city, c10se to the Zn industry and the main routes of ore transport, and downwind from the industrial area. Thus, Zn concentrations in sample nos. 5, 16 and 1 have increased 14,8 and 5 times, respectively in 15 years and concentrations ofZn and Cd in sample no. 16 reached values up to 5458 and 28.6 mg kg-l, respectively, in 2011, whereas samples taken in the residential southern area, such as nos. 10, 11 or 12 had relatively little variation in concentra-tion. However, elements such as Fe and Al, which have both industrial and natural origins, reflect the reduction in their industrial emissions over time, in decreased mean concentrations in superficial soils. A 65% increase in P concentration over time is probably related to the fertilizer industry.
Compared to values in the surrounding street dust, average metal contents in soil are appreciably lower. Mean contents of Zn, Cd, Ag and Pb in the street dust sampled in 2011 were 7.8, 5.8, 5.2 and 2.7 times higher than those found in superficial soils. Non-anthropogenic elements, such as K, Mg, Th or La, had similar or slightly higher average concentrations in soils and street dust, as the latter is fed from soil particle resuspension. In the most recent campaign, elements such as Al and Ga were lower in the street dust in comparison with the soils. This may again be due to the reduction in industrial emissions affecting dust, whereas soil acts as a pool that accumulates elements
•
•
Poin! C O Al Si S Ca K Fe Zn Pb As
1 18.8 32.7 48.5
2 26.2 20.2 2.4 11.6 1.31 8.78 21.6 7.91
3 10.4 48.8 1.9 1.8 2.25 20.0 13.9
~ M M t.D O"J O"J t.D deposited over time; also, Al is present in the natural composition of soil
o o o o o o
Vl
1 1 1 1 1 1
'"
(phyllosilicates). Despite these differences in absolute values, ClustercY ..c
,...,'"
","1 ~ ~ ~ ~ ~Lf'l N N O"J N:r: ~ N 00 o::i,....:N~,....: Analysis of the soil data essentially replicated the results previously
W ~ o found for street dust (Fig. 4): groupings reflecting elements related to
11 o o
5': 00 1
+
typical emissions from Zn and Al metallurgy, the steel industry and'"
'"
vi Z ci ": o those of natural origino
~
N 00 ci"
o 00 00 Fig. 7 shows some images and analyses of soil sample 16 bySEM-ro o o o
EDAX. The observed particles essentially comprised0,Si, Al, Fe, Ca
-e
+
1 1;:l N
'"
'"
'"
and K; phyllosilicate sheets could also be c1early identified. In Fig. 7A,B 'O ,...: M M M
U ~ <.Ó N N
~ particles of Fe carbonate and weathered Pb-rich sphalerite were
;:l OT"""oLnOOt.DLn
~ 0 0 0 0 0 0 0 observed and Fig. 7B shows Fe-As carbonate. According to XRD analysis,
O<
+++
1 1 1 16J u OO~~~~~~~ the soil sample contained quartz, muscovite and kaolinite as major
6
c
<lJ-<
NI.JlI.Jlr-;c!r"-Jcr:~NT"""T"""MNf'-..Lf'lNmineral crystalline phases. Other metallic mineral phases could not o
""
""
o"
'"
" "<ii;:l .~ ~:5 @.J~51~ be c1early distinguished by XRD analysis, since they were present in
:8 u ~~~~~~~ concentrations below 2%. These techniques will be further explored in
.2:
'O
~ N N " ' N future research.
S o o o o o
.g
M I 1 1 1 1 The soil was mostly sampled in parks and undeveloped land, not'O ~'"
'" '"
'" '"
ro
"
" , e : o ~ N ~ used to grow vegetables. The Regional Soil Guideline Levels for As, Cd,"
N N M f.Ó""': r-i""':ro Co, Cu, Mn, Pb and Zn defined in Asturias for residential soils (40, 20,
~ Mt.OLf'lMMMN
<B 0 0 0 0 0 0 0
25,400,2135,400 and 4550 mg kg-l, respectively) were exceeded in
~ 1 1 1 1 1 1 1
~ OO~~~~~~~
a total of 26 of the samples, mostly in the most recent sampling
cam-<lJ f.Óqqqr"-Jcr:cr:~
'¡j
>
'c
Mr--..r--..r--..r--..MNT"""paign. In order to assess the potential adverse health effects of exposure
2- ~
~'"
"''''
-'" o o o o o to these trace elements, a risk assessment was carried out, using the
·c
1 1 1 1 1",'"
'" '"
'" '"
results of the 2011 superficial sampling campaign. The output of the¡; ~ Me: N ~ ~ ~
u Vl ~
'"
,....:¡V¡ t.DMrisk assessment (Table 5) indicated that the highest risk was associated
"
ro
u
'"
'" N M N with ingestion of soil particles and that the trace element of mostcon-'O o o o o o
"
1 1 1 1 1ro
cern was As. The exposure to As resulted in a cancer risk value for an
'"
'" '"
'" '"
~ ..c
'" o o", o 00
~
"''''
00""': M""': adult individual of 2.6 x 10⁻⁵, aboye the 1 x 10⁻⁵ probability level<lJ Vl
'¡j
C M " ' N M N deemed unacceptable by most regulatory agencies. Regarding
non-;:l o o o o o
cY 1 1 1 1 1 cancer effects, exposure to the urban soils yielded an aggregate hazard
ts
..c,...,'"
","1'" '"
M"'"'" '"
' " Olindex (HI) below the threshold value of 1. For children, HI>1, with As
"
~ N M ~m Ncr1'B
N L f ' l M M " t L f ' l M and Pb as main contributors, and the value of cancer risk almost0 0 0 0 0 0 0
;:l
1 1 1 1 1 1 1 doubles.
o<
~ OO~~~~~~~
Z dqq~~~-r-:r"-J Although the main conclusions of this risk assessment in terms of
N NNNLf'lT"""f'-..NN
ro the elements and exposure pathways of main concern are perfectly
..c: M
M ' "
"''''
o o o o o
valid, the quantitative results must be interpreted with caution because
!.- 1 1 1 1 1
'"
'" '"
'" '"
they are affected by three important sources of uncertainty: Firstly, theo '" o Ol Ol M o
I ::E r-iLf'i ""':f.Ó r-..:r-..:
~ default exposure factors taken from the USEPA may not accurately
'O T"""Lf'lMNNMN
I 0 0 0 0 0 0 0 reflect the characteristics and habits of the population in Avilés. In
par-2 N 1 1 1 1 1 1 1
ticular, contact rates and exposure frequency used in the model
proba-"
"=t~~~~~~~""
::E M~q~C"")qC"")~g
T"""T"""Lf'lLf'lT"""NT"""M bly overestimate the actual values for Avilés, where c1imatic conditions4-< '<::l"'<::l"Lf'lMt.D"tM
restrict the amount of time spent outdoors, and the percentage of
hous-~ 0 0 0 0 0 0 0
~ 1 1 1 1 1 1 1
es with gardens is lower than in the United States. Secondly, the use of
Bu ~~~~~~~
""
MOOT"""O"JN"fM<l'l :r: ""':MMNLf'iMMt.D the default Particulate Emission Factor suggested by the USEPA may not
<lJ
O<
N N M
'" M correctly extrapolate the concentration in air from the concentration in
~ o o o o o
1 1 1 1 1 soil for the c1imatic conditions and surface soil characteristics of Avilés.
",'"
'" '"
'" '"
I ;:l " , e : N o '" o Thirdly, the concentration term has been calculated using pseudo-total
~ u ~'" ""':Lf'i f.ÓLf'i
'O
(i.e. aqua regia extractable) concentrations. For elements whose oral
I o M ' "
'" '"
o o o 0 0
2
+
1 1 1 1 toxicity reference values have been derived from studies in which the""
M ' "'" '"
'" '"
hazardous element was administered in a soluble form (for example,6 U~ ml.f'¡M ~
'" '"
r'evi Ol ' "r-it.D~
M L f ' l L f ' l N M M N As), the use of pseudo-total, instead of bioavailable, concentrations0 0 0 0 0 0 0
could lead to an over-estimate of risk. Elements present in the soil are
<lJ 1 1 1 1 1 1 1
~ N~~~~~~~ bound to particles in a variety of ways, depending on which, the
ele-'O 'O r-..:qqq~C"")~~
<lJ u T"""T"""T"""T"""NT"""O"lM
ment will be released in the gastrointestinal tract to a lesser extent
u
"
T " " " " t N M " t " t M <lJthan that corresponding to the soluble form on which the toxicity
~LIl' 0 0 0 0 0 0 0
<lJ I 1 1 1 1 1 1 1
~ o N~~~~~~~ value is based.
--"~ ro Mqq~q~r---:oq
I x 00 "fNLf'lT"""Mt.OT"""M
""~ "tLf'l"tT"""MNT"""
-'" 1\ 5. Conclusions
""-'" 0 0 0 0 0 0 0
S~
·c
u 1 1 1 1 1 1 1c
OO~~~~~~~U 4-< <lJ
-<
Nql.f'¡r"-Jq-r-:q~~ o
""
A geochemical study of street dust and urban soils of an industrial"
~ o NMT"""T"""T"""T"""MT"""o
"
'.)::lro
..a
ro .~ OMT"""NM"tN0 0 0 0 0 0 0 city was performed in four campaigns over a 15 year periodo In bothb
"
> u:;;] +
1 1 1 1 1 1 milieu, the industrial influence was c1early identified. Elements such.. ¿,
<lJ 'O T"""~~~~~~~
§
:g
o:<
t.6qqqr"J~oql.f'¡ as Zn, Cd, Hg, Ag, Pb or As were found in high concentrations (up toZ T"""T"""Lf'l T"""NN 00 N
u " 4.6% and 0.5% ofZn in dust and soil, respectively), particularly in the N
~
-
bJ)..c: [j bJ)..c: ....Ln e ~
éJ8'eeJ_
,.!jS&!
of the city. These elements appear to be correlated in their distribution~&íW
u~~~:r::r::r::r:elements, usedin the Zn industry (particles ofthis sulphide were
iden-tifiedin soil and street dust by SEM-EDAX and XRD analyses). The
spatial and temporal distributions of these elements are a function of the distance to the storage area of the ore, the intensity and method of transport from the port, and the prevailing wind direction. The elemen-tal concentrationsin the particulate matter, characterised by short
resi-dence times, show high variability depending on the time of the year that the sampling was done; they are more stablein the soils, as they
retain the input of particles deposited over time.Inboth cases, the aver-age concentrations of these elements have generally increased over the monitored periodoInagreement with this, the entropy model used to analyse the relationship between the development of urbanizationin
the period 1996-2011 and the street dust geochemistry shows that urban development has been negatively affected by the presence of metalsin the street dust, particularly in the north of the city, with Fe
and particularly Zn the main metals responsible.
Other groups of elements included those related to bauxite and its impurities, usedin the Al industry (Al, Ca, etc), those related to the
steel industry (Fe, Cr, V, Mn, etc) or those with natural/geogenic origin, not Iinked to anthropogenic activity(La,Th, Ca, Na, etc). Many of the elements cannot be c1assified with certainty, as they have more than one possible industrial or urban source.Inthis case, typical urban geo-chemical fingerprints, such as traffic, are masked by the widespread and considerable industrial influence.
In comparison with temporal trends across Europe in general, it was
found that until the present sampling campaign, concentrations of pol-lutantsin the street dusts appeared to mainly decrease in common with
European values. However, whilst European values continuein their
downward trend, those from Avilés mainly increasedin concentration,
reflecting industrial activityin the area in spite ofvarious actions having
been taken to reduce its impacto
Metal reference values established for soils with the characteristics of those sampled were exceeded at times. Although the assumptions
in the model may result in an overestimate of the quantitative results
arrived at, a risk assessment applied to the urban soils reveals that the concentrations of some elements, such as As and Pb, could resultin
unacceptable levels of risk for residential receptors, with ingestion of soil the exposure pathway with the largest contribution. However, sam-pies with the highest concentrations were takenin industrial, rather
thanin residential areas. Some environmental measures, such as a
new isolated warehouse and a new conveyor belt associated with the Zn industry, which will come into use shortly, will reduce particle emis-sions associated with ore transport and storage, and should have posi-tive environmental and human health benefits.
Aclmowledgements
The authors thank the students R. Carcía, ].M. Morán and E. Campa for their sampling and lab work.
References
Alloway. B.j.. 1990. Heavy Metals in Soils. Blackie. London.
Anju. M.• Banerjee. D.K.. 2011. Associations of cadmium. zinc. and lead in soils from alead and zinc mining area as studied by single and sequential extractions. Environ. Monit Assess. 176. 67-85.
Cabral. P.• Augusto. G.• Tewolde. M.• Araya. Y.• 2013. Entropy in urban systems (review). Entropy 15. 5223-5236.
Charlesworth. S.• Everett, M.• McCarthy. R.. Ordóñez. A.. De Miguel. E.• 2003. A compara-tive study of heavy metal concentration and distribution in deposited street dusts
in a large and a small urban area: Birmingham and Coventry. West Midlands. UK. Environ. Int 29. 563-573.
Charlesworth. S.• De Miguel. E.• Ordóñez. A.. 2011. A review of the distribution of particu-late trace elements in urban terrestrial environments and its application to consider-ations ofrisk. Environ. Geochem. Health 33 (2).103-123.
De Miguel. E.• Llamas. j.F.• Chacon. E.• Berg. T.• Larssen. S.• Royset. O.• Vadset, M.• 1997. Origin and patterns of distribution of trace elements in street dusts; unleaded petrol and urban lead. Atrnos. Environ. 31 (17). 2733-2740.
De Miguel. E.• Iribarren.l..Chacón. E.• Ordóñez. A.. Charlesworth. S.• 2007. Risk-based
eval-uation of the exposure of children to trace elements in playgrounds in Madrid (Spain). Chemosphere 66. 505-513.
Ferguson. j.E.• Kim. N.• 1991. Trace elements in street and house dusts source and specia-tion. Sci. Total Environ. 100. 125-150.
Gobierno del Principado de Asturias. 2014. Plan de mejora de la calidad del aire en la zona ES0302 Asturias Central. Consejería de Fomento. Ordenación del Territorio y Medio Ambiente. Asturias. Spain (428 pp.).
Graham.j.D.• Holtgrave. D.R.. 1990. Coke oven emissions: a case study oftechnology-based regulation. Report to the Congressional Research Service. Washington. DC; Reprinted in Risk. Health Saf. 1. 243-272.
Harmens. H.• Norris. D.• Mills. G.• 2013. Heavy Metals and Nitrogen in Mosses: Spatial
Patterns in2010j2011and Long-tenn Temporal Trends in Europe. Centre for Ecology
& Hydrology. UK.
Kelly. j.. Thornton.l..Simpson. P.R.. 1996. Urban geochemistry: a study of influence of
anthropogenic activity on heavy metal content of soils in traditionally industrial and non-industrial areas ofBritain. Appl. Geochem. 11. 363-370.
Ii.X.• Liu. P.s.• 2001. Heavy metal contamination of urban soils and street dusts in Hong
Kong. Appl. Geochem. 16. 1361-1368.
López. j.. Flor. G.• 2008. Evolución ambiental del estuario de Avilés (1833-2006). Trab. Geol. 28. 119-135.
Loredo. j.. Ordóñez. A.. Charlesworth. S.• De Miguel. E.• 2003. Influence of industry on the geochemical urban environment of Mieres (Spain) and associated health risk. Environ. Geochem Health 25 (3).307-323.
MAGRAMA (Ministerio de Agricultura. Alimentación y Medio Ambiente). 2014. http:// www.prtr-es.esjinfonnesjfichacomplejo.aspx?id_complejo=3143.
Miler. M.• Gosar. M.• 2012. Characteristics and potential environmental influences of mine waste in the area ofthe closed Mezica Pb-Zn mine (Slovenia).j. Geochem. Explor. 112. 152-160.
Miler. M.• Gosar. M.• 2013. Assessment of metal pollution sources by SEMjEDS analysis of solid particles in snow: a case study ofZerjav. Slovenia. Microse. Microanal. 19 (6). 1606-1619.
Miler. M.• Gosar. M.• 2015. Chemical and morphological characteristics of solid metal-bearing phases deposited in snow and stream sediment as indicators of their origino Environ. Sci. Pollut. Res. Int. 22 (3). 1906-1918. http://dx.doi.org/l0.l007/sl1356-014-3589-x.
Mindat. 2014. http://www.mindatorg.
Ordóñez. A.. Loredo.j.. De Miguel. E.• Charlesworth. S.• 2003. Distribution ofheavy metals in the street dusts and soils of an industrial city in northern Spain. Arch. Environ. Contam Toxicol. 44. 160-170.
Ouyang. T.• Fu. S.• Zhu. Z.• Kuang. Y.• Huang. N.• WU. Z.• 2008. A new assessment method for urbanization environmental impact: urban environment entropy model and its application. Environ. Monit Assess. 146. 433-439.
RACI (Royal Australian Chemical Institute). 2011. Gallium. www.raci.org.aujdocumentj itemj429.
SADEI. 2014. Reseña Estadística de los Municipios Asturianos. http://www.sadei.es/es/ portal.do?IDM=20&NM=2.
Sancini. A.. Tomei. F.• Capozzella. A.. Pacchiarotti. A.. De Sio. S.• Tomei. G.• Palermo. P.• Ciarroca. M.• 2011. Respiratory effects in the general population exposed to urban pollution.j. Environ. Prot 2. 974-981.
Sezgin. N.• Ozcan. H.K.. Demir. G.• Nemlioglu. S.• Bayat,
c..
2004. Detennination ofheavy metalconcentrations in street dusts in Istanbul E-5 highway. Environ. Int 29 (7).979-985.
Tositti.L..Brattich. E.• Masiol. M.• Baldacci. D.• Ceccato. D.• Panneggiani. S.• Stracquadanio.
M.• Zappoli. S.• 2014. Source apportionment of particulate matter in a large city of southeastern Po Valley (Bologna. Italy). Environ. Sci. Pollut Res. 21. 872-890. US DoE. 2014. RAIS (The Risk Assessment Infonnation System). http://rais.ornl.gov. US EPA, 2014. http://www.epa.gov/osp/hstl/tsc/software.htrn.
Vismanj.. De monsterneming van heterogene binomiale korrelmengsels. in het bijzonder steenkool. PhD Thesis. Technical University of Delft
Wang. Q. Yuan.
x..
Ma.c..
Zhang. Z.• Zuo. j.. 2012. Research on the impact assessment ofurbanization on air environment with urban environmental entropy model: a case study. Stoch. Env. Res. Risk A. 26. 443-450.
XU. S.• Zheng. N.• Liu. j.. Wang. Y.• Chango S.• 2013. Geochemistry and health risk assess-ment of arsenic exposure to street dust in the zinc smelting district. Northeast China. Environ. Geochem. Health 35. 89-99.