RECTANGULAR ROOM DIMENSIONS ESTIMATION USING NARROWBAND SIGNAL
AND SECTORIZED ANTENNAS
Igor Arambasic, Francisco Javier Casajus Quiros, IvanaRaos Departamento de Señales, Sistemas y Radiocomunicaciones
E.T.S.I. de Telecomunicación, Universidad Politécnica de Madrid, Madrid, Spain E-mails: [igor, Javier, ivana]@gaps.ssr.upm.es
ABSTRACT
A system for estimation of unknown rectangular room dimensions based on two radio transceivers, both capable of full duplex operations, is presented. The approach is based on CIR measurements taken at the same place where the signal is transmitted (generated), commonly known as self-to-self CIR. Another novelty is the receiver antenna design which consists of eight sectorized antennas with 45° aperture in the horizontal plane, whose total coverage corresponds to the isotropic one.
The dimensions of a rectangular room are reconstructed directly from radio impulse responses by extracting the information regarding features like round trip time, received signal strength and reverberation time. Using radar approach the estimation of walls and corners positions are derived. Additionally, the analysis of the absorption coefficient of the test environment is conducted and a typical coefficient for office room with furniture is proposed. Its accuracy is confirmed through the results of volume estimation.
Tests using measured data were performed, and the simulation results confirm the feasibility of the approach.
Index Terms —absorption coefficient, CIR, narrow-band, reverberation time, room volume, RTT, sectorized antenna, self-to-self CIR, TOA
1. INTRODUCTION
Most of the existing methods for estimating the room volume are based on Channel Impulse Response (CIR) between two points located inside the room. This type of observation is in acoustics commonly known as room impulse response (RIR). Actually, different methods for extraction of room dimensions out of RIR have been proposed over the years, being all sensitive to transmit-receive positions and room reflection coefficients [1-4]. None of these approaches combines RIR with self-to-self CIR which provides more information obtained at the same place, and as such should increase the stability of the solution.
Further on, several studies reported in the recent literature attempted to address this problem with radio signals based on Ultra-Wide-Band (UWB) techniques. Some adopt a bat-type UWB radar approach [5], other require a highly
specific hardware configuration, for example central transmitter with receive antennas array [6] or monostatic CIR measurements (i.e. self-to-self channel sounding) [7]. Regardless of different techniques, bottom line is that all of them require large bandwidths and as such introduce significant hardware restrictions.
Contrary to UWB methods, we propose to shift hardware constraints from bandwidth to the design of the receiver antennas. Hence, the bandwidth is reduced to narrow-band (100MHz) and isotropic antenna is replaced with eight sectorized antennas with 45° aperture in the horizontal. Eventually, using self-to-self CIR obtained at each one of these eight antennas the presence of walls and corners can be evaluated utilizing round trip time (RTT) measurements. The rest of the paper is organized as follows. The details of synthetic test environment used for simulations are given in section 2. Afterwards, system model is described. The process of estimating the positions of the walls is presented in section 4 while two last sections are reserved for simulation results and conclusions.
2. SYNTHETIC EVALUATION ENVIRONMENT
During the first year of the ICT-WHERE2 project [8], partners in charge of developing indoor mapping, self-localization and mobility learning algorithms expressed the need for the common synthetic evaluation framework in order to ensure fair performance assessment and comparison of the proposed algorithms.
This common synthetic environment is based on measurements collected during the ICT-WHERE1 [9] project which are complemented by deterministic ray-tracing simulations of CIRs calculated by three partners of WHERE2 for three different bandwidths (UWB, Wide Band and Narrow Band). It represents a typical indoor office environment, as specified in section 6.1.5 of deliverable Dl.lb [10]. The size of the simulated environment is approx 30x12m, and transmitters and receivers height was set to 1.5m.
sections and covering 360º azimuth angles. However, this also means that for each pair of Tx-Rx links nine CIRs are calculated (one per sector antenna and one per omni-directional). Eventually, Rx positions are defined with a grid of approximately 1mx1m density (all together 363 positions as seen in Figure 1) while Tx positions are located on the same grid but their number is reduced to 51 to ease the computational load.
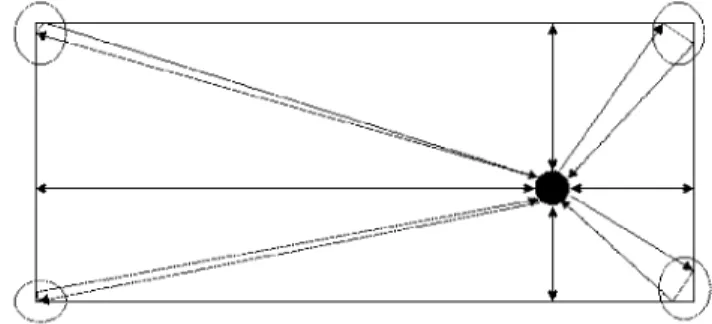
2. This hypothesis is true if we consider four sectors of Rx antenna to be orthogonal to the walls meaning their TOA calculations correspond to radar reading. In other words, half of self-to-self TOA calculation of the corresponding sector antenna matches the distance of the transceiver to the wall orthogonal to that section.
Figure 1: Rx positions inside common synthetic environment
The simulations resulted in CIRs for all Tx-Rx links and all three bandwidths. Out of these CIRs, different location/context-radio parameters, such as Received Signal Strength Indicators (RSSIs), multipath Times of Arrival TOAs, (Average) Power delay Profiles ((A)PDPs), channel delay spread, or mean excess delay, etc., can be extracted. In this paper synthetic narrow-band environment obtained by SIGINT 3DTruEM software [11] was used, and RTT or TOA of the strongest peak, RSS parameters and reverberation time were exploited. The simulations have been carried out at 3.5GHz (this is the frequency that the Ray Tracing Simulator was calibrated for) and a bandwidth of 100MHz considering an unlimited number of refractions and up to one diffraction, as defined in [12].
3. SYSTEM MODEL
One important requirement for this model is the ability of both transceivers to support self-to-self CIR, meaning that they are able to transmit and receive simultaneously. Utilizing self-to-self CIR on sectorized Rx antenna enables a variety of applications like self-localization, room shape detection, room volume determination and eventually the solution to simultaneous localization and mapping (SLAM) problem which is our final goal. In this preliminary work we restrict the research to determining the dimension of the rectangular room and its volume.
When representing rectangular room as geometrical model walls are seen as reflecting lines in a two-dimensional space, while corners are characterized by double reflections at two orthogonal walls as seen in Figure
Figure 2: Different measurement corrections are required depending on observed distance for corner calculation
One the other hand, four remaining sectors of Rx antenna are pointing to the corners and since this includes double reflection their reading of distance should be systematically corrected. The correction should be smaller for the corners far away from the transceiver and larger as the transceiver is located closer to the corner as pointed out with a circle in Figure 2. This correction parameter is labelled as C and is set empirically to values between 0.7 and 1 depending on the calculated distance from the wall. C=0.7 matches distance measurements between 0m and 1.5m, C=0.75 measurements between 1.5 and 3m, C=0.8 measurements between 3 and 4.5m etc. with maximum C equally 1.
Apart from correction parameter C, two other prerequisites are necessary for the approach; one is accurate path loss model for calculating the distance between the transceivers and the other is faithful room absorption factor for determining the room volume. Both parameters are determined empirically, by fitting them to the true values obtained over the entire synthetic environment scenario except for one room which is left as “unknown” for testing the method. Eventually, seven rectangular rooms (marked with circles in Figure 3.) were used for extracting these parameters and then the approach is tested on the room marked with the diamond.
For path loss model, one slope approximation model for the relationship between attenuation and distance has been used:
T (-f (-f 1 0 l \ ^
\J c ) 0\ J c ) o g1 0
{d0
J
Where d0 is the unit distance (1m) and L0(fc)
corresponding attenuation at transmission frequency^. (1)
Figure 3: Training rooms marked with ellipse and test room marked with diamond.
It was tested for 7 rectangular rooms, taking into account all possible pairs of Tx-Rx links inside the corresponding room. Finally Z0=-35.85 and «=1.7 produce the best fitted
approximation to be used for this path loss model inside synthetic narrow-band environment. These values are consistent with the ones found in [13] and [14] for LOS short-range indoor n value (1.87 and 1.5, respectively). In order to stress the importance of the third factor, the absorption coefficient, it should be noted that the shape of the self-to-self CIR is determined by:
• room volume—» determine the tail of CIR
• absorption (or reflection) coefficient of the walls and materials inside the room —> determine the slope of CIR
• transceiver position inside the room —> determine the position of maximum CIR value
A combination of volume, surface and absorption coefficient is often found in room acoustic in form of another parameter known as reverberation time (RT6 0) :
RT
60=
4ln(10
6)
V
c aS
(2)where c is speed of light, V is room volume, S is room surface, and a is absorption coefficient.
RT60 is actually defined as a decay time that takes a signal
to drop 60dB below its original level [15,16]. In our environment RT60 can be calculated out of isotropic
self-to-self CIR or out of isotropic CIR between the two transceivers located inside the same room. In both cases RT60 is calculated the same way as time difference
between the maximum of CIR and 60dB decay from the maximum, as shown in Figure 4.
Notice that the tail of CIR presents unstable measurements (dots); so in order to accurately determine the 60dB decay; it is approximated by polynomial function.
Figure 4: Calculation of RT60 using polynomial
approximation on the CIR’s tail
This is done by finding the coefficients of a polynomial
p(x) of first degree (N=1) that fits the data in a least squares sense.
P() = 7 ,PN-n+1* (3)
n=0
Larger degree for the approximation is not needed as the tail power is smooth function. Afterwards, it is interpolated by a factor of 10 to obtain improved time precision (see line). Hence, if we calculate RT time, for all available self-to-self CIRs inside the seven rectangular rooms, by knowing the volume of the corresponding room, and its surface, according to equation (2) we could obtain its actual absorption factor.
a
=
1.842x10"
V
RT
60S
(4)
Figure 5: Estimated pdf of absorption coefficient
4. ALGORITHM DESCRIPTION
The focus of the approach is determining the dimensions of the rectangular room. To do so, at least two transceivers are necessary.
0
325L
/\
334
<8>
1
<- 5.13m
7.32m
Legend:
(g) transceiver
table H bookcase
v >
Figure 6: layout of test room with bookcase, tables and two transceivers
The position of the transceivers inside the room is unknown, but their orientation is predefined as 4 sectorized Rx antennas are orthogonal to the walls. Actually, the influence of antenna orientation with respect to walls should still be investigated, but if found critical the solution would be to replace Rx sectorized antennas with 2D array of eight isotropic antennas. As a result beam-forming would be used for determining the correct orthogonal orientation with respect to the walls (minimum RTT measurements).
When extracting different location/context-radio parameters two standard CIR obtained between the transceivers, and two self-to-self CIR, are available. The algorithm will be presented by applying the approach to two transceivers located at the positions marked with filled circle (see Figure 6). These two circles correspond to positions inside the grid tagged as 325 and 334. The test room is actually a reception hall which explains the existence of three doors (left upper
corner, right upper corner and middle of the bottom wall). Its furniture composed of metallic bookcase (on the left wall), one large wooden desk and one table. The room is not perfectly rectangular with approximate size of 5.1mx7.3m with 2.4m height.
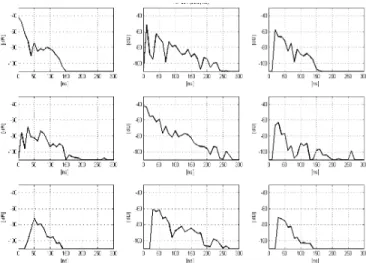
The data obtained for CIR of the transceiver 325 at position 334 is seen in Figure 7. It consists of nine CIRs. The central one corresponds to isotropic antenna, while eight surrounding CIRs match the corresponding sectorized antenna of the Rx.
Figure 7: CIRs between transceivers 325 (Tx) - 334 (Rx)
The algorithm starts by calculating the distance between the transceivers, out of isotropic standard CIRs, using path loss model. The model was calibrated in another environment using the same transceivers, as already explained in section 3. Afterwards, sector CIRs of Rx antennas of both transceivers are used for detecting the direction of the emitter. This is easily seen in Figure 7 where upper-left sector receives highest power level when compared to other sectors. Eventually this statement constructs two wall observations with respect to the observed sector. In case of a corners calculations (sectors not orthogonal to the walls), the obtained distance is multiplied by correction coefficient C, and then two corner observations are produced.
as the room is not empty the first peak is not selected since its reflection source might be the furniture and not the wall.
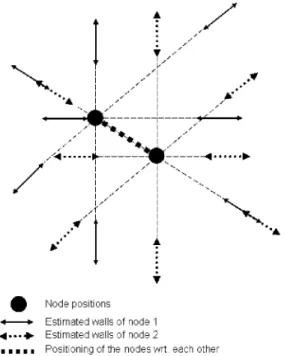
Figure 8: Estimation of walls and corners positions based on RTT of self-to-self CIRs obtained at sectorized Rx antenna
Figure 9: Left wall estimation example
In case of narrow-band environment (100MHz), TOA values are multiples of 10ns which matches round-trip distance to the wall to be a multiple of 1.5m. Hence, it could be said that, if RTT of the orthogonal section is 10ns, the wall is positioned between 1.5m and 3m from the transceiver. Eventually these readings (1.5m and 3m) would be the two points the corresponding Rx sectorized-antenna produces. Hence, when determining the wall position we
part with 12 observations for each wall is seen in Figure 8. Four correspond to the directly to orthogonal wall observations, and eight correspond to the two corners. These 12 observations are then projected on the straight line as seen in Figure 9 and median of all projections produces the wall position estimate.
Once the locations of four walls are established, only the height of the room is missing in order to be able to determine the volume. If we calculate the reverberation time for two self-to-self isotropic CIRs, and two standard isotropic CIRs, four (V/S) relations can be obtained out of (2). Then, by solving equation (5), four height values are produced, and the average value is delivered as height estimate.
V XˆYˆZ
=
2(XY
+
XZ
+
YZ
)
S ˆ ˆ ˆ ˆ
( 5 )where X and Y are estimated floor dimensions, V is volume, S is surface and Z is height.
Figure 10: CDF of relative estimation error of room dimensions X and Y
5. SIMULATION RESULTS
The CDF of relative error obtained for dimension of X and Y are depicted in Figure 10. The results correspond to room 1, of Siradel building, with size of 5.1mx7.3m. This office room includes metallic bookcase and 2 wooden tables. It is not perfectly rectangular, and consists of one glass wall and three wooden doors. As such the environment can be considered as rather hostile. Nevertheless, the CDF show that in more than 80% of calculations the relative error of the obtained dimensions is bellow 15%, while in 50% of calculations the error would be less than 11%.
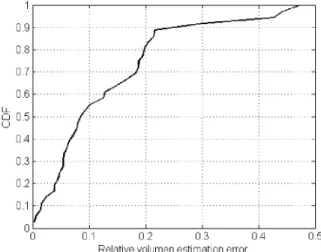
room height and consequently room volume. The performance of the proposed approach can be seen in Figure 11. The CDF shows that in more than 80% of calculations the relative volume error is bellow 20%.
Figure 11: CDF of relative volume estimation error
This is in line with relative errors of X and Y dimensions, and means that no additional error was introduced in this step. Eventually, it confirms that the average absorption coefficient is a good choice for this kind of room.
6. CONCLUSION AND FUTURE WORK
The algorithm for indoor localization with 100MHz RF signal is presented. The main distinctive property of the algorithm is the spatial discrimination of the received signal and absorption factor usage. It is shown that the even with 100MHz signal (up to 3m localization error per estimation due to sampling rate) the relative position and volume estimation error can be maintained in more than 80% of points below 15% and 20% respectively. This confirms that the algorithm is appropriate and can be used for indoor localization and volume estimation. For distance estimation the simple one-slope path loss model was found to be adequate, with attenuation and path loss exponent parameters estimated empirically from the data.
Further work includes analysis of improvements with respect to precision and sensibility using larger bandwidth signal (up to 500MHz) and/or introducing more transceivers. Additional research on localization and tracking should also be valuable for SLAM problem solution.
7. ACKNOWLEDGMENTS
This work has been carried out in the frame of the WHERE2 (FP7-ICT 248894) project, which is funded by European Union, and Spanish national MCIN project TEC2009-14219-C03-01.
8. REFERENCES
[I] M. Kuster, “Reliability of estimating the room volume from a single room impulse response,” J. Acoust. Soc. Am., vol. 124, no. 2, pp. 982–993, Aug. 2008.
[2] Shabtai, N.R.; Zigel, Y.; Rafaely, B.; "Feature selection for room volume identification from room impulse response," WASPAA '09. IEEE Workshop on Applications of Signal Processing to Audio and Acoustics, 2009., pp.249-252, Oct. 2009
[3] Shabtai, N.R.; Zigela, Y.; Rafaely, B.; , "Estimating the room volume from room impulse response via hypothesis verification approach," IEEE/SP 15th Workshop on Statistical Signal Processing, 2009. SSP '09, pp.717-720, Sept 2009
[4] J. B. Allen and D. A. Berkley, “Image method for efficiently simulating small room acoustics,” J. Acoust. Soc. Am., vol. 65, no. 4, pp. 943–950, Apr. 1979.
[5] Seitz, J.; Schaub, M.; Hirsch, O.; Zetik, R.; Deissler, T.; Thoma, R.; Thielecke, J.; , "UWB feature localization for imaging," IEEE International Conference on Ultra-Wideband, 2008. ICUWB 2008, vol.2, pp.199-202, 10-12 Sept. 2008
[6] Deissler, T.; Thielecke, J.; , "Feature based indoor mapping using a bat-type UWB radar," 2009. IEEE International Conference on Ultra-Wideband, 2009. ICUWB, pp.475-479, Sept. 2009
[7] Wenyu Guo; Filer, N.P.; , "On the Accuracy of an Indoor Location-sensing Technique Suitable for Impulse Radio Networks," IEEE International Conference on Communications, 2007. ICC '07, pp.3987-3992, 24-28 June 2007
[8] http://www.ict-where2.eu/.
[9] “Measurements of location-dependent channel features," technical report, Deliverable D4.1 of WHERE1 Project (ICT-217033), Oct. 2008.
[10] “Scenarios and parameters”, Deliverable D1.1b of the WHERE2 Project (ICT-248894), August 2011.
[ I I ] “Ray-tracing tools for dynamic positioning," technical report, Deliverable D1.5 of WHERE2 Project (ICT-248894), July 2011.
[12] “Self-learning positioning using inferred context information (intermediate report)," tech. rep., Deliverable D2.3 of WHERE2 Project (ICT-248894), Dec. 2011.
[13] “D1.1.2 WINNER II channel models–part I: channel models,” WINNER Information Society Technologies, Tech. Rep. IST-4-027756 WINNER II, version 1.2, Sep. 2007.
[14] Bultitude, R.J.C.; Hahn, R.F.; Davies, R.J.; "Propagation considerations for the design of an indoor broad-band communications system at EHF," IEEE Transactions on Vehicular Technology, vol.47, no.1, pp.235-245, Feb 1998
[15] H. Kuttruff, Room Acoustics, Fourth Edition, London, Spon Press, 2000