Case study in failure analysis of accelerated life tests (ALT) on III-V
commercial triple-junction concentrator solar cells
P. Espinet-González
1, R. Romero
2, V. Orlando
1, M. Gabás
2, N. Núñez
1,3, M. Vázquez
1,3, S. Palanco
2, S.
Bijani
2, Y. Contreras
1, B. Galiana
4, C. Algora
1, K. Araki
51. Solar Energy Institute, Technical University of Madrid, Avda. Complutense 30, 28040
Madrid (Spain)
2. Dept. Física Aplicada I, The Nanotech Unit, University of Málaga, 29071 Málaga (Spain)
3. EUTT de Telecomunicación, Technical University of Madrid (UPM), Madrid, 28031, (Spain)
4.- Departamento de Física, Universidad Carlos III, Madrid (Spain)
4. Daido Steel Co., Minami, Nagoya, (Japan)
Abstract — In this work the failure analysis carried out in III-V concentrator multijunction solar cells after a temperature accelerated life test is presented. All the failures appeared have been catastrophic since all the solar cells turned into low shunt resistances. A case study in failure analysis based on characterization by optical microscope, SEM, EDX , EQE and XPS is presented in this paper, revealing metal deterioration in the bus bar and fingers as well as cracks in the semiconductor structure beneath or next to the bus bar. In fact, in regions far from the bus bar the semiconductor structure seems not to be damaged. SEM images have dismissed the presence of metal spikes inside the solar cell structure. Therefore, we think that for these particular solar cells, failures appear mainly as a consequence of a deficient electrolytic growth of the front metallization which also results in failures in the semiconductor structure close to the bus bars.
Index Terms — accelerated life test, ALT, characterization, concentrator, CPV, failure analysis, reliability, solar cells.
I. INTRODUCTION
Nowadays, CPV systems based on multijunction solar cells are experimenting a rapid development [1]. In order to be cost-competitive, a high reliability, similar to that of silicon modules, is essential [2]. In fact, silicon modules have shown that perform very well in the field with less than 1 % power degradation/yr for more than 20 years [3]. However, the knowledge of the reliability of concentrator multijunction solar cells is still scarce because there is not enough accumulated experience, since concentrator multijunction solar cells have not been in the field long enough [4]. Consequently, the aim of this work has been to contribute to the knowledge of III-V concentrator solar cells by carrying out a temperature accelerated life test (ALT). A detailed description of the steps followed to carry out the test has been presented in [5] and the reliability analysis of the data obtained has been presented in [6]. Therefore, the goal of this paper is to focus on the failure analysis of the commercial concentrator multijunction GaInP/Ga(In)As/Ge lattice-matched solar cells tested. In this paper we describe the procedure followed in order to determine the failure origins
and also we discuss the appropriateness of the temperature ALT carried out. Given that there is a primary cause of failure, we cannot guarantee against secondary failure origins not appearing in this test.
II. STAGES OF THE ACCELERATEDLIFETEST The steps followed in the accelerated life test carried out on 45 commercial lattice-matched multijunction solar cells of size 9 x 7 mm2 have been classified into four stages: 1) design
of the test, 2) progress of the test, 3) reliability analysis and 4) failure analysis.
In brief, with regards to stages 1) and 2), the parameter used to accelerate the aging of the solar cells has been the temperature. Then, three tests at different temperatures (119
oC, 126 oC and 164 oC) have been necessary in order to
calculate the acceleration factor between different temperatures. Regarding the working conditions, they have been emulated by injecting current in darkness. The current injection level was determined by simulating the current density distribution of commercial solar cells with a 3D distributed model [5]. A conservative approach was followed, avoiding current over stress, that is, the current density injected in darkness through the solar cells did not surpass the current density photo-generated at the nominal working conditions (820 X) at any point of the solar cell. In particular beneath the bus bar the current injected has been equivalent to approximately 450 X.
Regarding stage 3) reliability analysis, the distributions of failures across the different temperatures have been fitted to an Arrhenius-Weibull model which has been used to extrapolate the reliability data at nominal working conditions (80o C, 820 X, 8 hours/day). The main results obtained have
been [6]:
Activation energy, EA = 1.58 eV
The failures are of the wear-out kind
At the working temperature of 80o C promising
failure after 25 years of 0.3%, a mean life of 177 years and a warranty time for a failure population of 5 % of 69 years
Reliability results are very sensitive to the working temperature.
Once the main reliability parameters and functions have been determined in [6], in this paper we present the last stage of the accelerated life test, the failure analysis.
III. FAILURE ANALYSIS
During the temperature ALT carried out, the dark I-V curves of the solar cells inside of the climatic chambers have been periodically measured. All the failures presented in the three climatic chambers have been catastrophic since all the solar cells turned into low shunt resistances (point d). In figure 1 the typical evolution of the dark I-V curve of the solar cell tested is depicted. It has to be pointed out that the source meter was limited to 5 A. Therefore, the flat region in the thyristor-like curve (point b) and in the low shunt resistance (points c and d) is due to the limitation of the current.
Figure 1. Typical evolution of the dark I-V curves of the solar cells tested inside of the climatic chambers.
Since the solar cells failed turning into low shunt resistances, we were not able to accomplish the characterization carried out previous to the test. Therefore, we carried out a characterization based on optical microscope, scanning electron microscopy (SEM), Energy-dispersive X-ray spectroscopy (EDX), external quantum efficiency (EQE)
and X-ray photoelectron spectroscopy (XPS) in order to get as much as possible information about the failure mechanism.
A. Microscopy analysis
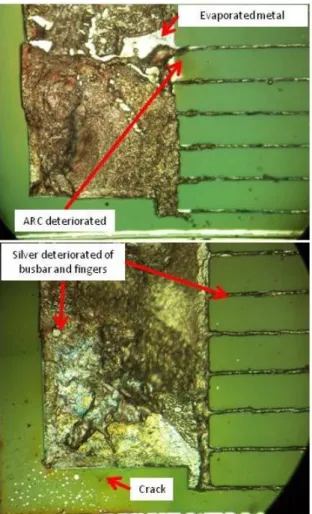
The first step has been to carry out a visual inspection by optical microscope. In figures 2, 3, and 4 we can observe the typical damage presented in the solar cells tested at low (119
oC), medium (126 oC) and high temperatures (164 oC).
In figures 2-4, we observe that for all the test temperatures, the bus bars have been damaged; we can clearly observe regions where the electrolytically grown silver has been detached from the evaporated metal. In fact, this effect is also observed in the fingers.
In all the solar cells, at any temperature, we observed cracks in the semiconductor surface next to the deteriorated region in the bus bar.
Figure 2. Microscope photograph of the typical evolution of the front metallization in a solar cell tested at low temperature (119 oC).
Figure 4. Microscope photograph of the typical evolution of the front metallization in a solar cell tested at high temperature (164 oC).
Finally, at the three temperatures, we observed a localized region where the anti-reflecting coating is deteriorated (change of color), probably due to a localized higher temperature in this region. Then, the tendency of the solar cell’s deterioration at the three test temperatures is the same one.
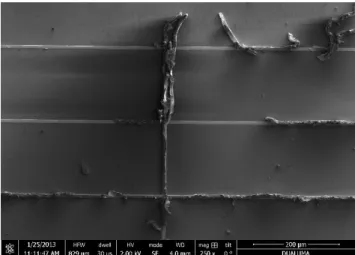
In order to better observe the evolution of the degraded bus bars and to evaluate their impact on the degradation of the semiconductor structure, SEM images have been taken. In figure 5, we can clearly observe how the bus bar is torn apart and it is raised up. Cracks in the semiconductor surface are observed and they could be due to a mechanical stress suffered by the different thermal expansion coefficients of metal and semiconductor. In figure 6 we observe that the cracks detected at the surface of the semiconductor also propagate inside the semiconductor structure. At this point, it is important to point out that we do not know if the cracks observed in the semiconductor are responsible of the failure in the solar cells (turning them into low shunt resistances) or if they appear after the failure. In order to clarify this doubt, in figure 7 we can discern that the part of the metal raised up corresponds to the electrolytically grown silver. The
previously evaporated metal seems to be intact. It should be pointed out that the metal gap observed in figure 7 is about 20 microns. In figure 8 we detect that the electrolytically grown silver has also lift-off from the fingers, just remaining the evaporated metal.
Figure 5. Cross section SEM image of the front metallization in a solar cell tested at medium temperature.
Figure 6. SEM image of a crack propagation.
Figure 8. Upper view SEM image of the metallization of the fingers of a solar cell tested at low temperature
For comparison purposes, figure 9 present a solar cell which was inside the climatic chamber but current was not injected into it (reference solar cell). The cell presents the bus bar intact. Therefore, stressing with high temperatures but without the simultaneous current injection does not promote the degradation of the front metallization and the subsequent solar cell degradation resulting in a low shunt resistance.
Figure 9. Upper view SEM image of the intact front metal of a reference solar cell
The next step has been to check if the solar cells turned into low shunt resistances due to electromigration of the metallization into the semiconductor structure. For this purpose, transversal SEM images under the bus bar of several degraded solar cells were taken with a Helios Nanolab 650 Dual Beam microscope from FEI, fitted with a Schottky field emission source for SEM (FESEM) and a Tomahawk focused ion beam (FIB), which allows a precise and reliable milling and patterning. Different areas of the cells were analyzed by preparing cross-sections using FIB milling (at 30 kV and 65-9.4 nA). The surface was previously protected by a layer of platinum deposited using a gas injection system (GIS) at 30
kV and 0.79 nA. We have also carried out EDX,in order to discern the composition of each region in the cross section images.
Figure 10. Cross section SEM image of a degraded solar cell. No metal spikes penetrating in the semiconductor structure beneath the bus bar are detected.
Figure 11. Cross section SEM image of the semiconductor structure beneath the degraded bus bar.
cracks in the semiconductor structure. Two kinds of cracks can be discerned. Some of them are fractures which seem to be originated in the semiconductor surface close or beneath the bus bar and to propagate into the semiconductor structure as the ones shown in figure 6. As we pointed out above, these cracks seem to be due to the mechanical stress existing between the degraded metal and the semiconductor structure. The other kind of cracks seems to evolve in the opposite sense from the semiconductor structure towards the surface, as the one shown in figure 11. Finally, it has to be pointed out that no cracks were detected beneath or close to the bus bars of the reference solar cells what suggests that these cracks are promoted by current flow.
B. X-ray Photoelectron Spectroscopy Analysis
The chemical composition of the solar cell’s bus bars has been investigated by using XPS. The X-ray photoelectron
spectrometer used has been a Thermo Scientific Multilab 2000 system fitted with a dual-anode (MgKα, AlKα) X-ray source and a 110 mm mean radius hemispherical sector analyzer with a seven-channeltron detector. As it can be observed in figure 12, there are remarkable differences between the composition of a degraded bus bar (blue line in figure 12)and that of a non-degraded one (red line in figure 12). In the surface of the last one, it should be noted the presence of sulfur, aluminum, silicon and chlorine, the last three elements in a very small quantity. In the surface of the damaged bus bar it is evident the apparition of germanium, -note the intensity of the core levels Ge3s, Ge3d and the Auger transition GeLMM-, together with an increase of the quantity of oxygen. Sulfur, aluminum and chlorine have disappeared. The intensity of the Ag signals has dramatically decreased in this bus bar spectrum.
Figure 12. XPS partial survey spectra of a non-degraded bus bar (down, red line) and of a degraded bus bar (up, blue line).
The analysis of the Ag3d doublet core level shown in figure 13 reveals that the main constituent of the non-damaged bus bar is metallic Ag while a very small quantity of silver is linked to sulfur, forming an Ag sulfide. The S2p spectrum analysis (not shown) confirms the presence of silver sulfide.
However, the deconvolution of the Ag3d core level for the degraded bus bar shows a very different composition. In this bus bar the quantity of metallic silver has decreased to 15% while the rest of the signal corresponds to silver oxide.
The germanium found in the surface of a degraded bus bar is strongly oxidized as it is demonstrated through the analysis of the Ge2p core level (not shown). This fact and the evolution of the silver to its oxidized form in this bus bar justify the observed increase of the O1s signal in the survey spectrum of the degraded bus bar.
Figure 13. Deconvolution of the Ag3d core levels signal corresponding to a non-degraded bus bar (upper line) and to a degraded bus bar (lower line), showing the constituents of both signals.
C. External Quantum Efficiency analysis
Finally, in order to check if the semiconductor structure of the solar cells far from bus bars and consequently far from the shunts had suffered any degradation due to the ALT, we have cut a small piece in the center of the solar cell and we have measured its external quantum efficiency (EQE).
In figure 14, the EQE of the top cell (TC) and middle cell (MC) before the ALT and in a small piece of the same solar cell after the ALT have been depicted. We do not observe significant differences. Therefore, we can conclude that the semiconductor structure has not been significantly degraded, at least far enough from the degraded bus bars.
IV.ANALYSIS OF THE RESULTS
According to the characterization carried out, we have observed that during the temperature ALT, the electrolytic metallization of the bus bars and fingers close to bus bars, gets damaged. The metal deterioration could have caused that the metal contact becomes not equipotential and consequently, the current injected into the bus bar during the emulation of nominal working conditions is not uniformly distributed laterally. Therefore, all the injected current would effectively flow downwards the semiconductor structure only in small areas. The confinement of the current in such a small areas may have led to localized very high current densities through the metal-semiconductor interface resulting in hot spots. These hot spots would have favored the evolution of defects and the creation of cracks, which eventually turned the solar cells into shunts. The observed localized deterioration of the anti-reflecting coating (ARC) reinforces this hypothesis. The ARC would have been degraded due to the higher temperatures in these points (hot spots) caused by the localized very high current density. Additionally, the different thermal expansion coefficients of metal and semiconductor would result in a great mechanical stress at those hot spots reinforcing the appearance of cracks in the semiconductor structure.
According to the failure origin that we have proposed, the solar cells have failed due to a deficient electrolytic metallization which is additionally degraded because of the lateral distribution of the injected current flow. As we have pointed out, in order to emulate nominal operation conditions, 3.2 A were injected into the solar cells in darkness. Because the electrolytic metal is not equipotential, the current density beneath the bus bar was higher than in real operation conditions (820 suns) [5].
On the other hand, we have not observed metal electromigration into the semiconductor due to the current injection in darkness. Therefore, we think the way of emulating photogenerating working conditions by injecting current in darkness has not artificially favored the appearance of a failure origin different to that of we would have obtained in a temperature ALT with real nominal conditions (concentrated light). In fact, in case of using concentrated light, the lateral current flow that the bus bar and finger should have managed would have been the same one, so we would expect to have had a similar failures mechanism.
Finally, we have to point out that because there is a main cause of failure produced by the default in the electrolytic metallization, we cannot guarantee against secondary failure origins not appearing in this test.
V.SUMMARYANDCONCLUSIONS
A failure analysis of the solar cells subjected to a temperature accelerated life test has been presented. All the solar cells have failed turning into low sunt resistances. Therefore, in order to determine the failure cause we have carried out a structural characterization based on mainly SEM, XPS and EQE measurements. We have observed a severe deterioration of the silver grown electrolytically which we think made that the busbar and fingers were not equipotential. That would have led to the circulation of very high current densities into the semiconductor in very small areas of the cell structure during the emulation of nominal working conditions in the ALT. The confinement of these high current densities into the semiconductor would have
favored the evolution of defects and cracks turning the solar cells into shunts.
A methodical and thorough failure analysis of the ALT allows to improve the quality of this type of commercial concentration solar. This case study presents a support for the next works in this area.
ACKNOWLEDGMENTS
This work was supported by the European Commission under the project NGCPV “A new generation of concentrator photovoltaic solar cells, modules and systems” with Grant agreement no. 283798. The Spanish Ministerio de Economía y Competitividad has also contributed with the projects TEC2011-28639-C02-01 and -02, IPT-2011-1441-920000, as well as the Comunidad de Madrid under the NUMANCIA II program (S2009/ENE1477).
REFERENCES
[1] Sarah Kurtz. Technical report, National Renewable Energy Laboratory, NREL, 2012.
[2] S. Kurtz, et al. in the proceedings of the Instrumentation Engineers (SPIE) Solar Energy + Technology Conference, 2009. [3] J. A. C. R. Osterwald et. al. in 32nd IEEE Photovoltaic Specialist
Conference, 2006, pp. 2085-2088.
[4] T. Gerstmaier, et al. in the proceedings of the 9th International Conference on Concentrator Photovoltaic Systems CPV9 Miyazaki, Japan
[5] P. Espinet-González et al. in the proceedings of the 38th IEEE Photovoltaic Specialist Conference, 2012, Austin, USA