Ethical strategy focus and mutual fund management: Performance and persistence
38
0
0
Texto completo
(2) 1.. Introduction. Sustainable investing is transforming the panorama of the global financial industry. Interest in the perspective of long-term returns is growing, and the recently observed trends in favor of integrating sustainability concerns into investment worldwide are indicative of its momentum resulting in an explosive growth. Thus, according to the Global Sustainable Investment Alliance (GSIA)’s review,1 from 2014 to 2016 the trend for sustainability embedded in investment represents a significant share of the market not only in Europe and Australia, where it accounts for approximately 50 percent of their professionally managed assets, but also in the United States and Canada, where its share of the market ranges from 22 to 38 percent. Investors and investment managers are aware of the opportunities provided by the Socially Responsible Investment (SRI); specifically, in 2017, more than one quarter of the world’s professionally managed assets—roughly US$22.9 trillion—have some sort of sustainable investing mandate, with about US$8.7 trillion of that in the United States, US$12 trillion in Europe and the rest shared among other regions.2 In this context, global growth in sustainable investing is aligned with an emergence of specialized literature on the expansion of organizations that meet environmental, social and governance (ESG) criteria into their strategies (see Humphrey et al., 2012; O’Rourke, 2003, among others). Specifically, the motivations for centering attention on the Socially Responsible (SR) mutual funds have been investigated by a number of authors, such as Renneboog et al. (2008b), Capelle-Blancard and Monjon (2012), and Silva and Cortez (2016), to cite just a few. Likewise, Busch et al. (2016) build on the idea that a reorientation towards a long-term paradigm for sustainable investments is important; their main argument is that embedding sustainable values into investments requires a progressive change in mindset toward long-term risk and opportunities arising from the incorporation of such perspective are countless. Moreover, Laurel-Fois (2016) provides evidence of a positive relationship between responsible investment and financial performance as per a risk mitigation effect derived from high screening intensity. The author argues that intensive screening let fund managers to gain advantages from selection strategies. Despite this, there is a lack of studies analyzing the performance experienced by SR funds according to their SR strategy. In contrast to previous literature, our main goal is not 1 Global. Sustainable Investment Alliance, 2017: “2016 Global Sustainable Investment Review”. Stanley’s 2018 edition of the Sustainable Signals series: “Asset Owners Embrace Sustainability”.. 2 Morgan. 1.
(3) to compare SR to conventional funds3 but rather to analyze the performance of SR funds with similar characteristics. In other words, we aim to analyze whether managers, practitioners and individual investors could obtain higher risk-adjusted returns by allocating their investments to funds that integrate specific levels of SR criteria in their portfolios. This is achieved by comparing the performance of socially responsible (SR) mutual funds according to their SR characteristics: environmental, governance, social, and sustainability attributes. To address this issue, we first compare the performance of SR funds according to their SR strategy, reflected in the level of SR attributes accomplished in their portfolio. These characteristics refer to Environmental, Governance, Social, and Sustainability attributes. SR funds not reporting information on these characteristics are also included in the analyses as “undefined” funds. With the aim of avoiding any local bias related to the investment geographical area, we build groups of funds and repeat the analysis for each of them. The empirical work focuses on equity SR mutual funds around the world for the period from January, 2000, to March, 2018. The sample is made by 3,920 funds. Among them, only 180 funds have data for the full sample period, meaning that the rest of the funds either disappeared or were set up during this period. Our analysis is therefore free from survivorship bias. We apply a multifactor model to these data in order to estimate abnormal performance. In sum, this study contributes to the previous literature in several ways. Firstly, we analyze the risk-adjusted returns experienced by SR funds. Rather than comparing their financial results with those achieved by their conventional peers, we assess the SR fund performance in relation to the level of SR criteria integrated in their investment strategies by distinguishing among SR funds with higher and lower SR attributes in their portfolios. Secondly, we also differentiate SR funds according to their investment area in order to avoid any potential local bias. Bearing this aim in mind, we evaluate whether mutual funds achieving higher scores in their SR attributes underperform funds that focus less on their SR strategies. The analysis will go beyond the average (in order to prevent the emergence of effects mainly driven by the performance of the worst-performing funds), for which we follow a nonparametric approach based on kernel density estimation. As far as we know, this methodology has not been applied to analyze the differences in performance with regard to the SR characteristics of mutual funds, and constitutes the third 3 E.g.,. Bauer et al. (2005), Renneboog et al. (2008b) and Nofsinger and Varma (2014).. 2.
(4) contribution of our study. Finally, our fourth contribution lies in assessing the SR funds’ performance persistence through the recursive portfolio approach. This methodology has been frequently been applied to analyze the persistence of conventional funds but not of SR funds (see, for instance Bollen and Busse, 2005, 2001; Busse and Irvine, 2006; Cremers and Petajisto, 2009; Cremers et al., 2013; Gottesman and Morey, 2007). It reveals whether the performance differences between the best and the worst SR funds are persistent over time, and for which SR categories and areas analyzed this persistence holds. Providing responses to the objectives of the study might, a priori, be useful to professionals and investors aiming to enhance their risk-adjusted returns in order to identify skilled managers who can provide them with greater overall performances while integrating a relevant degree of ethical values in their investment portfolios. The remainder of the paper is structured as follows: Section 2 presents a brief review of relevant literature and states the main hypotheses to be tested. Section 3 provides details on the methodologies used to measure fund performance and persistence. Section 4 describes the data used in the study, while Section 5 reports the results. Finally, Section 6 presents some concluding remarks.. 2.. Literature review and hypotheses development. O’Rourke (2003) states that there are several reasons that explain the growth of SR funds in the financial markets around the world. Firstly, SR funds are a sophisticated option that adds value to the investment by following a non-purely financial orientation as other parameters are also considered (such as reputation, good corporate governance practice and environmental responsibility, among others). In this regard, Koellner et al. (2005) propose the basic principles and methods on which a sustainability rating for mutual funds could be based; specifically, they state that a variety of impacts—economic, social and ecological—should be considered in order to embed sustainability into investment processes. In addition, some authors analyze the intention to invest in a socially responsible manner (Palacios-González and Chamorro-Mera, 2018), and show that environmental as a sustainable criteria matter in the decisions of mutual funds because of their effect on the company’s future financial performance (Said et al., 2013; Cai and Li, 2018). Moreover, Helminen (2000) introduces the concept of “eco-efficiency” linked to sustainable development as the integration of ecological, economic and ethical dimensions at the firm level;. 3.
(5) indeed, ethics have also been integrated into mainstream business as a competitive strategy. In this sense, some studies highlight the impact of integrating ethics into the business strategy (Friede et al., 2015). However, Jansson and Biel (2014) conduct a survey on SR fund industry and show that future SR investment is not influenced by social and environmental concerns. Rather, their findings suggest that financial beliefs about risk, as well as beliefs about increased market shares, are a relevant driving force underlying SR investment. From a financial perspective, SR mutual funds are investment vehicles which investors can easily access to, and their returns are comparable to those of conventional funds. Indeed, numerous studies have analyzed the financial performance of these portfolios by comparing them to their conventional peers, finding mixed results. On the one hand, some studies argue that SR funds outperform conventional funds (Galema et al., 2008; Kempf and Osthoff, 2007). Nonetheless, it appears that socially responsible investors are less sensitive to poor performance and the overall implicit benefit to the SRI practice dilutes any negative impact, as postulated by Bollen (2007), Benson and Humphrey (2008) and Renneboog et al. (2011), among others. On the other hand, studies such as Bauer et al. (2005) and Renneboog et al. (2008a,b) conclude that, in general, there are no significant differences between the performance of SR mutual funds and their conventional counterparts. Up to this point, it is worth to note that SR mutual funds usually invest under different core values related to their ethical strategy. For instance, a SR mutual fund with a focus on environmental criteria does invest in companies that potentially contribute to the environment. Hence, attributes such as sustainability or environment should be implicitly related to the main investment objectives of a SR portfolio. Given that SR funds aim to maximize their financial results while achieving their SR goals, it is therefore of interest to observe the behavior of SR funds with the same characteristics or attributes. Most of the previous literature, however, does not focus on SR attributes. Some studies have compared the performance of different types of SR mutual funds, mainly in relation to green funds. In this line Mallett and Michelson (2010) find no differences in their comparison of returns of green and other SR funds. This same result is found by Climent and Soriano (2011), although this evidence varies over time. Furthermore, observing the level of SR attributes may help investors to distinguish between funds with the same label, but very different SR scores. This could be a solution to Silva and Cortez’s (2016) proposal that investors should pay attention to the social performance of 4.
(6) green funds. Our interest therefore lies in analyzing the relationship between SR attributes and performance. In this study, we aim to fill this gap in the literature by analyzing the performance of mutual funds focusing on similar SR attributes. Firstly, it should be noted that funds in the same SR categories (e.g., environmental) could achieve different scores in their SR portfolios attributes. In other words, two green funds, for example, can differ in the level of environmental characteristics related to the assets held in their portfolios. That is, one green fund could be considered “greener” than another. Accordingly, we should expect the first fund to yield higher SR scores related to environmental attributes than the second. Different levels of SR scores could therefore drive the performance distribution. For instance, in their comparison of US green funds with conventional funds Chang et al. (2012) find that green performance is not uniformly distributed across fund types. In another comparison, Nofsinger and Varma (2014) find that SR funds outperform (underperform) conventional funds during crisis (non-crisis) periods, but their most striking finding is that this asymmetric pattern is driven by SR attributes rather than differences in management or the characteristics in the fund portfolios. We are interested in analyzing what can be an intricate relationship between SR scores and performance, in which it is not easy to comprehend what should be expected from it. As Sharpe (1992) points out, the performance of a fund depends mainly on the evolution of the asset class it invests in. Therefore, different SR scores could lead to differences in performance. In this sense, higher SR scores in the portfolio could imply higher policy constraints that restrict their investment to very specific types of assets. As a result, the performance of the SR funds would be linked to the behavior of the specific constrained SR securities. In this line, Jin and Han (2018) found that green funds tend towards industry concentration rather than diversification. Additionally, previous evidence for conventional funds (Huang et al., 2011) shows that increasing investment concentration leads to higher specific risks and worse performance. Consequently, SR funds with high scores in their attributes, and therefore with more concentrated portfolios investing in specific securities, should face more difficulties in providing investors with greater financial performance. The analysis of the differences in performance according to SR levels is therefore the first hypothesis of our study: Hypothesis 1 (H1): There are no differences in the performance of SR funds according to their SR attributes. 5.
(7) In order to better understand the behavior of SR funds over time, we are also interested in analyzing the persistence of their performance. This analysis is useful to distinguish whether mutual fund results are due to luck or to managers’ ability. Thus, if there is persistence, the best-performing funds during a given period should experience greater subsequent performances than the worst-performing funds. The literature on performance persistence in conventional mutual funds is not conclusive. Some studies do not find general evidence of persistence (see Carhart, 1997; Cuthbertson et al., 2008; Massa and Patgiri, 2009) whereas other have uncovered some evidence of performance persistence in the mutual fund industry (see Brown and Goetzmann, 1995; Elton et al., 1996; Cremers and Petajisto, 2009). The literature on the persistence of SRI funds is still scant. Leite and Cortez (2013), using Carhart’s (1997) methodology, do not find evidence of persistence for a sample of French SRI funds; Lean et al. (2014) draw a similar conclusion—for a sample of SRI funds from the Asia-Pacific region. However, in Lean et al.’s (2015) study, although they found weak evidence of performance persistence for a sample of European and North American SRI funds (also using Carhart’s methodology), the evidence is stronger when applying contingency tables. In this vein, Matallín-Sáez et al. (2016) show how, compared to using Carhart’s method, contingency tables are biased towards finding evidence of persistence too easily. Unlike some of the previous literature, we do not analyze the persistence for a regional sample but for a global sample of SRI funds by applying a more robust methodology—also based on Carhart (1997). In our study, we contribute by incorporating information on the funds’ SR attributes into the persistence analysis. In fact, and as we will see, we obtain that persistence results are different depending on the level of mutual funds’ SR scores. Accordingly, the analysis of the performance persistence constitutes the second hypothesis of our study: Hypothesis 2 (H2): The differences in the abnormal performance between the best and the worst mutual funds, with similar SR attributes scores, are not persistent over time.. 6.
(8) 3. 3.1.. Methodology Performance measurement. This section is devoted to a succinct description of the measurement of mutual funds’ performance and their persistence, for which we consider a linear model which adjusts each fund’s returns for a set of given risk factors. This is a very popular approach in the literature, based on one of its seminal contributions (Jensen, 1968), although a successive number of contributions in the field have proposed some variations of it, in order to include more factors (Fama and French, 2015; Carhart, 1997). Multifactor models attempt to avoid the omitted benchmark bias in the performance evaluation. This bias, as pointed out by Pástor and Stambaugh (2002) and Matallín-Sáez (2006), is present when the performance model is not considered a relevant benchmark that proxies some asset classes in which the mutual fund invests. It must also be noted that the fund’s return is the result of passive and active management. The return linked to active management is the value added by managers over the return from passive management. The return of passive management hinges critically on the funds’ investment objectives. Thus, considering the characteristics of the mutual funds in the sample, and following Sharpe (1992) and Elton et al. (1993), we propose a multifactor model with specific benchmarks. Given that we aim at evaluating funds with a specific investment strategy as well as a broad geographical scope for investment, we have adopted a linear model such as the following one: r p,t = α p + β p,w rw,t + β p,s rs,t + β p,m rm,t + ε p,t. (1). In the above expression, r p,t is the excess return over the risk-free asset of the assessed fund, the constant in the model, α p , measures the fund’s abnormal performance, and the risk factors are the excess returns corresponding to: (i) a global benchmark, which represents investment in different markets around the world (rw,t ); (ii) a specific benchmark, representing investment constrained by SRI fundamentals (rs,t ); and (iii) a specific benchmark for investment in the emerging markets, taking into account the characteristics of some of the funds being evaluated (rm,t ).. 7.
(9) 3.2.. Performance persistence measurement. In order to measure performance persistence we will consider the so-called recursive portfolio approach (Carhart, 1997), which is probably the most popular approach in the literature to measure mutual fund performance persistence. Some successful variations of this approach have been proposed by Busse et al. (2010) and, most notably, Fama and French (2010). Carhart (1997) proposes to evaluate persistence by analyzing the abnormal performance of portfolios that invest according to mutual funds’ past performance. Persistence is then calculated for two semiannual (half-yearly) symmetrical windows. The first of these windows estimates past performance, whereas the second one rebalances the recursive portfolio. In addition, when estimating performance of a non-overlapping rolling window we will be allowing the model parameters to vary over time. This is an interesting feature, due to the substantial amount of literature on time-varying systematic risk. Similarly to Abdelsalam et al. (2017), we apply the recursive portfolio approach by means of the following algorithm: 1. In the first step the performance of the SR funds is estimated by means of Equation (1) for the first sample period. 2. SR funds are ranked in increasing order according to the performance achieved in the period in order to form quintiles within each group of funds—according to investment area and SR attributes. 3. At the start of the following period we form five equally weighted portfolios according to quintile past performance, Q1 , . . . , Q5 , where the first portfolio (Q1 ) invests in the worst performing funds in the previous period and, conversely, the last portfolio (Q5 ) invests in the previous period’s best funds. The same investment strategy is followed for the other deciles. 4. This process is repeated at the beginning of each period (i.e., we would restart in step 1). Therefore, each portfolio would represent a dynamic investment strategy that rebalances selected funds according to their previous performance. 5. We therefore compute the daily return of the five portfolios and then estimate the abnormal performance of the portfolio, also using model (1).. 8.
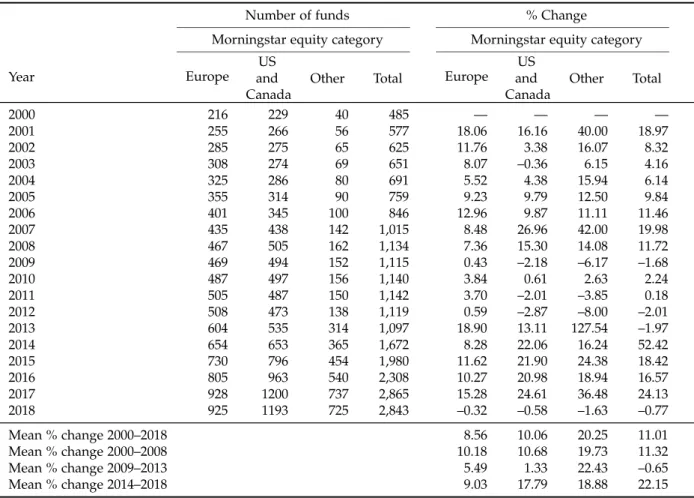
(10) Our hypothesis is therefore that, should persistence in mutual fund performance exist, a portfolio with an investment strategy based on a poor (good) past performance will show a negative (positive) abnormal performance.. 4.. Data. The data used in this study are from equity mutual funds with SR conditioned investment policies. Specifically, we analyze 3,920 SR equity mutual funds in the world according to investment geographical area. Attending to the representativeness on the global sustainable investment arena, we cover separately the following zones: Europe, US and Canada, and “Other” (including emerging economies) to prevent from any local bias. Morningstar database provides information on daily returns for these funds. The sample period analyzed spans from January 1, 2000 to March 29, 2018. We report some characteristics of the sample funds in Tables 1 through 4. Table 1 shows how the number of SR funds varies over the sample period because some funds disappear and new ones are incorporated. The net balance of all SR funds since inception shows that the number of funds generally increases. The annual increase in the number of funds was positive over the 2000–2018 period, with an annual average of 11.01%. It is also remarkable the strong impact of the global financial crisis on the clean energy production and the underlying SR funds, shown by the dramatic decrease in the total number of funds from 2009 to 2013 coinciding with downturns and upturns in the economic cycle (1,115 and 1,097, respectively). Although the recovery times have varied around the world, it is evidenced the remarkable overall increase experienced from 2014 to 2018 and reaching an all-time high with a positive inter-annual change of the number of funds with an average value 22.15%. In general, considering the full period 2000-2018, on average, the highest growth rate is mainly concentrated in the category that includes emerging countries, grouped in “Other” with a value of 20.25%, being practically double compared to “Europe” and “US and Canada” (10.06% and 8.56%, respectively). Since both surviving and non-surviving mutual funds are considered in the study, there is no survivorship bias in the results for performance and persistence. Rohleder et al. (2011) reviews the effects of this bias in mutual fund performance measurement. However, avoiding survivorship bias may also lead to other problems that are not usually addressed in the literature. Specifically, the inclusion of funds with limited data may reduce the ro-. 9.
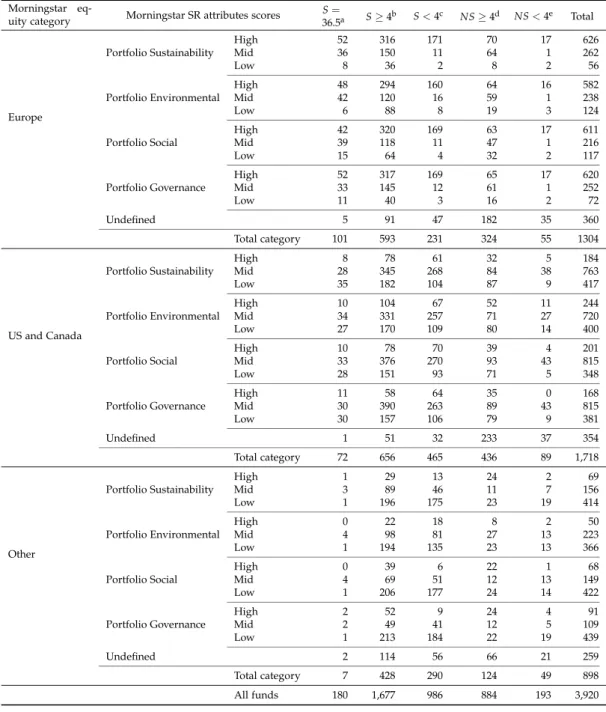
(11) bustness of the analysis. In this regard, Rohleder et al. (2011) pointed out how individual fund performance measurement requires a return history of a certain length to generate reliable regression estimates. In addition, comparing funds with different periods of existence could add some bias if the mutual funds’ performance is correlated with the period for which data are available—for instance, the performance could differ depending on the economic cycle or for bull and bear markets (Kacperczyk et al., 2009; Kosowski, 2011; Sun et al., 2013). In order to avoid this type of problem, our empirical strategy will take into account the following: we present performance and persistence results in two ways, i.e. for all mutual funds and for survivor funds only. Table 2 reports information on the fund sub-types considered in the study according to their survivorship characteristics. We create five categories of mutual funds. First, we split the funds into two sets, survivors (S) and non-survivors (NS). The difference between the two sets is that the first (second) includes all the mutual funds with (without) a net asset value as of March 29th 2018. Considering the number of semesters for which data for mutual funds are available, we distinguish three subgroups for S mutual funds: S = 36.5, when the fund shows data for the whole sample period, i.e., 36.5 semesters; S ≥ 4 for survivor mutual funds with at least four semesters of data, and S < 4 for survivors less than four semesters old. Also, considering semesters with data, non-survivor mutual funds are collated into two groups: NS ≥ 4 comprises mutual funds with at least four semesters of data, and NS < 4, the rest. As indicated in Table 2, only 4.59% (180/3,920) of the SR funds have complete data over the sample period. The largest group is that denoted by S ≥ 4, specifically 42.78% (1,677/3,920) for the funds. Table 2 also shows the survival characteristics of the mutual fund sample according to their Morningstar SR attributes scores as provided by the Morningstar mutual fund database. Specifically, we consider the following portfolio SR attributes: Sustainability, Environmental, Social, Governance and Undefined. The first one, Portfolio Sustainability Score combines a fund’s Portfolio ESG Score and its Portfolio Controversy Score jointly; the second, Environmental Score is based on the asset-weighted average of the Sustainalytics Environmental Scores for the covered holdings in its portfolio; the third one, Social Score based on the asset-weighted average of the Sustainalytics Social Scores for the covered holdings in its portfolio; the fourth, Governance Score is based on the asset-weighted average of the Sustainalytics Governance Scores for the covered holdings in its portfolio; and finally, fifth, Undefined, covers funds that do not focus on specific 10.
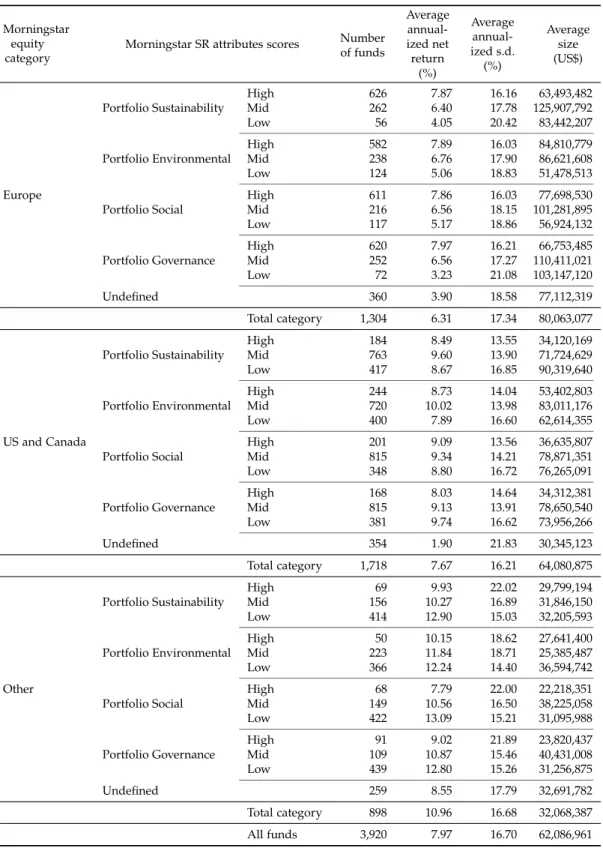
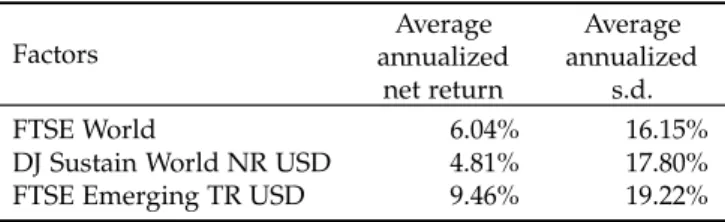
(12) SR attributes. Then, for each category the funds with the 30% highest/lowest portfolio SR attributes scores are classified as High/Low. Thus, we group top and bottom 30% of funds with “High” and “Low” scores, respectively, and the middle 40% (between 30% and 70%) are categorized as “Mid”. Interestingly, there are noticeable differences in the areas under analysis and Europe appears to concentrate the highest scores, while the lowest lie in “Other”. For the US and Canada case the vast majority of funds are classified as “Mid”, whereas “Low” outnumber “High”. Table 3 reports some summary statistics corresponding to the mutual funds’ sample. Regarding geographical area of investment, most funds focus on Europe, the US and Canada; specifically, 77.09% (3,022/3,920). A mean-variance analysis reveals that in Europe funds with “High” scores perform better since, on average, they show a higher net return and lower risk. And also notable is that this finding is revealed for the four SR attributes. However, for the US and Canada this evidence is not as clear, although Low scores concentrate higher risk, the return is mixed depending on the attributes observed. And contrary to Europe, the “Other” group reports a better balance for the “Low” scores. By connecting the previous evidence from Table 2 where the number of predominant funds is high (low) for Europe (“Other”), Table 3 brings insights in regard the risk-return trade-off and reinforces the argument in favor of the maturity of Europe to be a more developed and experienced area in the SR management industry. Nevertheless, the “Other” group does not appear to follow adequate SR investment strategies since results are worse than in the case of “Low” scored funds. These descriptive statistics give an idea of both the segmentation and disparate evolution of the SR fund industry in different locations. As mentioned in the methodology section, to evaluate mutual fund performance we apply the linear model (1) where funds’ excess returns are adjusted to the excess returns corresponding to the types of assets in which the funds invest. Note that because the analyzed funds invest in very different geographical areas, the first benchmark is a global index representing global investments, specifically the FTSE World. We selected the DJ Sustain World to represent investments under SR conditions. A number of funds invest in less mature and developed markets, so we also included the FTSE index for emerging markets. For these indices we calculate daily returns from information provided by Morningstar. We compute the excess return using the one-month Treasury bill rate as the risk-free asset.4 4 Obtained from Ken French’s website (mba.tuck.dartmouth.edu/pages/faculty/ken.french/, accessed March 2018).. 11.
(13) Table 4 reports some summary statistics for the benchmarks used in expression (1). For the analyzed sample period, the most globalized indexes (for which financial markets in more advanced economies weigh more) show a more conservative mix of average return and risk than those for emerging markets (FTSE Emerging) for which there is higher risk and average return.. 5. 5.1.. Results SRI mutual fund performance. In Table 5 we report results on funds’ performance, not only for all funds (last row of the table), and also split for Europe, US and Canada, and “other”. Within each of these three categories we also group results considering fund sub-categories and according to portfolio SR attributes: Sustainability, Environmental, Social, Governance and Undefined. The table is also split vertically in two panels, the left-hand panel indicating the percentage of funds in each category and sub-category for which results were either positive or negative (and whether these results were significant or not), and the right-hand panel reporting the annualized performance, considering both unweighted and weighted (by fund size and fund life) averages. Unlike Tables 2 and 3 the grouping criterion in “High”, “Mid” or “Low” attributes scores is not made on the whole of the totality of the funds, but within each geographical area (Europe, Usa and Canada, and “Other”). This procedure is due the lack of uniformity of the scores within the geographical zones. For instance, in Europe there were more “High” funds and in “Other” more “Low” funds. As one of the objectives of the study is to compare the performance of the funds based on their higher or lower score, there could be some bias in this comparison (i.e., if we maintained the previous grouping method, since comparing “High” vs. “Low” could mean comparing in some way Europe with “Other”). Thus, if there is a specific component in these geographical areas that is not captured by the linear model that adjusts to systematic risk sources, the High-Low comparison could be biased by that component. Results indicate that, on average, the number of funds with significant performance different from zero is small. For all the funds, in the bottom row of Table 5, the percentage of funds with negative performance was slightly higher than that corresponding to funds with positive performance (53.34% vs. 46.66%). However, the percentage of funds for which 12.
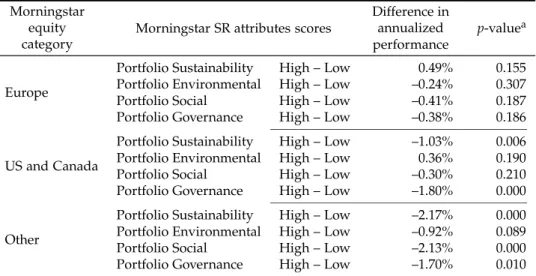
(14) results were significant was very low in both cases—5.46% and 3.27%, respectively. In addition, the funds do not outperform the market, there is an overall unweighted negative performance (−0.16%). This result is not very different from that achieved by most of the literature that has evaluated investment funds: a negative performance near zero is evident. Results differ depending on the geographical investment area. On average, they are particularly bad for US and Canada (−0.85%), whereas for Europe they were only slightly negative (−0.46%). In contrast, for “Other”, the average performance was positive (1.58%). In view of these results, we can infer that more mature markets (USA and Canada, and Europe) involve some complexity for managers to beat the market, while in emerging markets, perhaps less efficient, there may be more opportunities for managers to provide greater added value to their management. In contrast, looking at the weighted average performance by fund size, we observe that the total performance improves notably in Europe (0.69%) and in the USA and Canada (0.66%), so the negative average seems to be driven by the smaller funds. For funds in the “Other” area the weighted average by size is reduced, taking the highest value instead (1.14%). Therefore, part of the differences found between the different zones is partly due to the behavior of smaller funds; in Europe and, US and Canada there are more negative results while in “Other” area better results are found. It should be borne in mind that smaller funds have a greater capacity for active management than funds with large assets that implicitly approximate the average behavior of the market, given that they are an important part of it (Sharpe, 1992). In line with the above mentioned, it seems that more mature markets, such as Europe and, the US and Canada, do not provide value-added opportunities to these smaller funds, which can be inferred as a measure of the efficiency of that market. However, for funds from “Other” zones there are such opportunities. 5.2.. Performance and SR attributes’ scores. With the aim of testing the first hypothesis of this study, we now focus on the performance differences of funds with different levels of SR attributes. The specific comparisons between funds grouped according to attributes scores are reported in Table 6. In general, the sign of the difference between the performance of funds with higher and lower scores is negative, which indicates that on average the performance of funds with “High” scores is worse than those with “Low” scores. This evidence is clearly significant for the “Other” zone, and in most cases for the US and Canada. Whereas in Europe the sign of the difference 13.
(15) in performance is generally negative, in no case it is significant. After the diagnosis of the three geographic areas, we find a common pattern and this is an interesting finding that contributes to the SR literature: there are differences in performance among Sustainability, Environmental, Social and Governance attributes scores, in that the higher (lower) the SR attributes score, the worst (best) its performance. We can therefore reject the first hypothesis proposed in Section 2. In other words, we can infer that funds with weaker sociallyconscious schemes outperform those with a strong SR orientation. This result is consistent with Muñoz et al. (2014) for a sample of US and European socially responsible mutual funds in which underperformance is identified. In this line, Silva and Cortez (2016) expanded the analysis of US and European towards green funds and their results highlight the idea that green funds present a tendency to underperform the benchmark. One explanation for these findings draws on the tenets of modern portfolio theory, which holds that the negative financial consequences from investing in socially responsible screened companies are due to increased information costs and the inherent difficulty of diversifying ethical fund portfolios (Martí-Ballester, 2015); both motives may lead to poorer risk-adjusted performance mainly for the US and Canada, but also in “Other” areas—as observed. However, concerning the general relationship between financial and socially responsible performance from the Morningstar SR attributes scores approach, the lack of research identified means this remains an open question. Figures 1–4 provide a clearer view of the tendencies. Performance varies depending on the investment area as well as the attributes’ score, as commented on in the preceding paragraphs. However, the figure also reveals some hitherto undetected features. Of particular interest is the higher dispersion found for funds investing in “other” areas (Figures 1c, 2c, 3c and 4c), evidenced in the way probability mass is more spread along the OX axis, regardless of the attributes’ scores—sustainability (Figure 1c), environmental (Figure 2c), social (Figure 3c) or governance (Figure 4c). In contrast, for funds investing in Europe (Figures 1a, 2a, 3a and 4a) and US and Canada (Figures 1b, 2b, 3b and 4b) the performance of the funds in each category is more alike, particularly for the latter, as shown by the much tighter densities. However, in the case of Europe and US and Canada, despite the higher homogeneity, densities reveal that some funds perform particularly well, as shown by some bumps in the upper end of the distributions—although some pockets of poor performance also exist, as revealed by some (fewer) bumps in the lower tail of the distribution. This extreme behavior is also present in the “Other” geographical investment area, and 14.
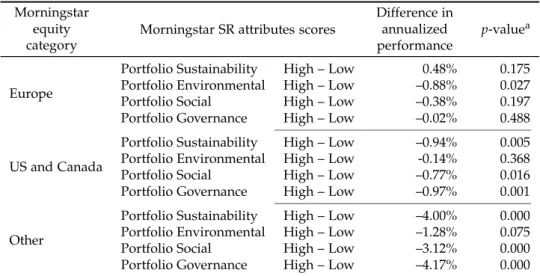
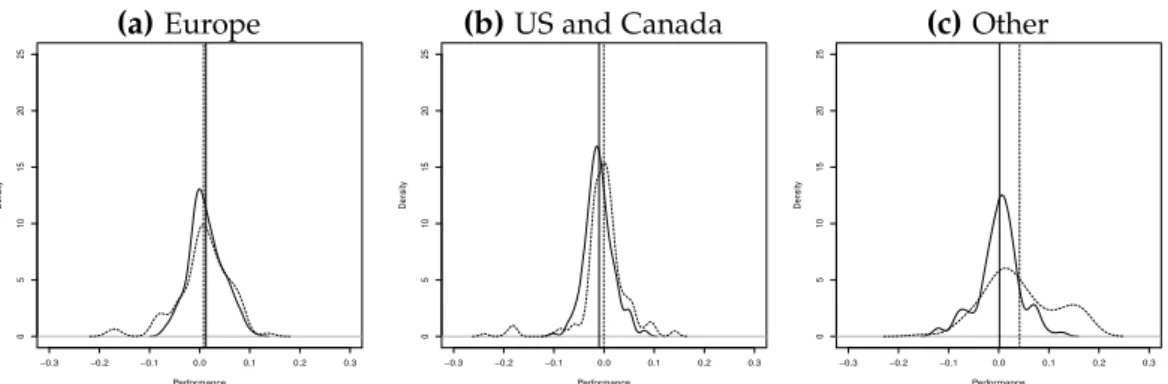
(16) particularly for the “Low” category. In this sense, some specific “Low” funds perform particularly badly in Europe, as shown by the lower tail stretching beyond −0.3 for Europe funds (Figures 1a, 2a, 3a, 4a), whereas for US and Canada funds (Figures 1b, 2b, 3b and 4b) and “Other” (Figures 1c, 2c, 3c and 4c) this phenomenon is less pronounced. However, at the other extreme, the best funds are more frequently found in the US and Canada category, as shown by the relatively long tails corresponding to the solid and dashed lines in Figures 1b, 2b, 3b and 4b. This overperformance is also found for the “Other” category, and particularly for “Low” funds. This result highlights the asymmetry in the performance differences according to “High”/“Low” categories—i.e., the main driver of the differences found is the behavior of the worst funds. Table 7 reports analogous results to Table 6 for survivor funds only—those surviving for at least four semesters. The survivor-only counterparts to the densities shown in Figures 1–4 are reported in Figures 5–8. Therefore, the tables and the figures give the analysis additional robustness. The total number of surviving funds is 1,677, representing 43% of total funds in our sample. The comparison of results between all funds (Table 6, Figures 1–4) and nonsurviving funds only (Table 7, Figures 5–8) indicates that, in general, the tendencies are maintained, since the sign of the difference in annualized performance is virtually the same in most instances—all of them except Portfolio Environmental in US and Canada, for which the sign is reversed. However, results for this particular comparison are not significant. Therefore, it seems that the results achieved in Table 6 and Figure 1–4 are robust in the sense that they have not been driven by the performance of non-surviving funds. 5.3.. Performance persistence and SR attributes’ scores. We will now analyze whether funds’ performance persists over time in order to test the second hypothesis of the study. As explained in the methodology section, we applied the recursive portfolio approach (Carhart, 1997). Then, we form portfolios which follow investment strategies based on past performance. Should performance exist, we expect that the quintile-portfolio that invests in the worst (best) funds in the past obtains a worst (best) performance. Results are shown in Figure 9 and Table 8 for all funds, and Figure 10 and Table 9 for surviving funds only. Figure 9 shows, for funds grouped according to SR attributes scores and investment 15.
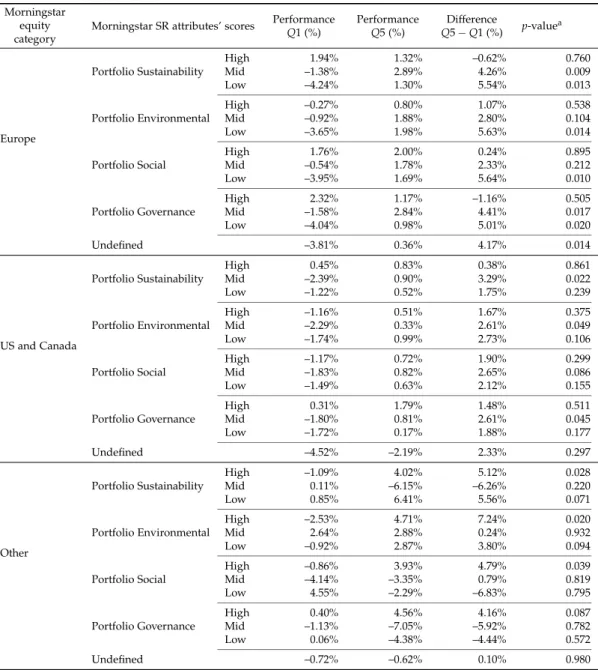
(17) area, the performance of the quintile-portfolios. Should persistence exist then we will expect lines with positive slopes. In general, this positive slope exists in most cases and the difference Q5 − Q1 is positive, which means that investing in the best funds (Q5) in the past provides better results than investing in the worst funds (Q1). These results support performance persistence evidence. More specifically, Table 8 reports the performance of the extreme quintile-portfolios (Q1 and Q5), and the magnitude and significance of the difference between both of them. For most of the cases being analyzed the difference is positive, implying that investing in the best past funds yields better performance the worst past funds. However, for the Europe zone not in all cases it occurs with the same intensity and significance. Specifically, for funds with “High” scores in no case there is significance, in fact the difference Q5 − Q1 takes smaller values—even negative. On the contrary, the persistence takes high and significant values for the funds with “Low” scores. Thus, investing in funds with lower scores that performed better in the past provides a differential with respect to the worst between 5.64% per annum in the case of the Social attribute and 5.01% in the Governance attribute. This differential is mainly due to the worst performance of the funds in the first quintile, which ranges from −4.24% for the Sustainability attribute and −3.65% for the Environmental attribute. That is, funds with Low scores have a clear persistence in their bad results. This evidence also holds, in general, for surviving funds (Table 9 and Figure 10). In the case of the US and Canada, previous finding is still maintained as funds with “High” scores are the ones with the lowest values of difference Q5 − Q1, and in no case they are significant. Unlike the previous analysis with Europe, the groups of funds with greater persistence and significance are the “Mid” over the “Low”. Finally for the “Other” zone, those funds with High scores are the ones that have the highest persistence and significance. Thus, the difference in the performance of Q5 − Q1 takes values that oscillate between 7.24% for the Environmental attribute and 4.16% for the Governance. These results are especially driven by the high performance of funds in Q5. For the “Mid” and “Low” funds although in some cases the difference is positive and weakly significant, in others it takes negative but not significant values (Social and Governance Scores). In conclusion, we find greater persistence in Europe and the US and Canada than in “Other”, leading us to reject the second hypothesis of the study (H2, see Section 2). In other words, the differences in the abnormal performance between the best and the worst funds with similar SR attribute scores persist over time. In particular, it is observed that 16.
(18) “Low” funds are the ones with the greatest persistence, while in “Other” those scored as High are the predominant.. 6. 6.1.. Conclusions and implications for theory and practice Conclusions. The performance of SR funds has been and continues to be an issue of interest worldwide. The popularity and reputation that these ethically oriented assets have been experiencing for decades brings to academics and investors a wide variety of research and investment opportunities, respectively. For both groups the issue as to the likely underperformance of SRI when compared to their conventional peers has always been at stake, and contributions in this particular field are diverse, being this question far from consensus. The fact that SR investors are less sensitive to poor past performance suggests that social, environmental or ethical issues are prioritized in their investment decisions. This approach looks beyond the economic dimension and the mere pursuit of competitive returns to encompass the investment strategy as non-financial attributes are taken into consideration. This point, coupled with the evidence about its positive impact on societal concerns with no extra charges involved when integrating ethics or moral values into the investment choices justifies its extraordinary development and relevance within the international investment arena. Our study analyzes the financial performance of a sample of mutual funds around the world that integrate different levels of SR attributes in their investment portfolios. These attributes are related to several concerns, such as environmental issues, governance, social matters, and sustainability. Our results lead us to reject the first study hypothesis, indicating that most of the mutual funds achieving higher scores in these SR attributes, especially those investing in less-developed areas, experience lower overall performances than other similar funds that focus less on their SR strategies. This is in line with the higher constraints these funds experience in their investments, in relation to other SR funds characterized with lower SR grades. The financial value added by fund managers, however, is essential in relation to the performance experienced in the fund portfolio, as shown in previous studies analyzing conventional funds. Then, assuming that funds that achieve greater extents of SRI in their portfolios will obtain lower performances is a distorted conclusion. In this line, we show 17.
(19) that their overall underperformance is mainly driven by the worst-performing funds in each SR category. A carefully analysis of SR fund performance over time leads us to reject the hypothesis related to the lack of persistence of SR fund performance by showing that some skilled managers are able to persistently provide investors with greater risk-adjusted returns. For instance, investing in the previous worst-performing funds usually leads to negative alphas, while investing in the previous best funds, whose managers are likely to show greater managerial skills, results in positive risk-adjusted returns. Moreover, the performance differences between the previous best and the previous worst funds are significantly positive for most of the regions and SR categories analyzed. In sum, the evidence reported in this study shows that managers, practitioners and individual investors could obtain higher risk-adjusted returns by allocating their investments to the previous best-performing funds that integrate specific levels of SR criteria in their portfolios. It follows, therefore, that a potential SR investor should be more careful when picking the SR funds for investing in. Given that some SR funds experience higher constraints in their investment decisions, the role of managers is then crucial to overcome these restrictions and to add value through their management. Hence, investors and managers willing to incorporate higher levels of SR criteria in their portfolios without experiencing worse risk-adjusted returns should invest in the previous best-performing funds in order to achieve both goals. In other words, pursuing higher ethical values in our portfolios should not imply a worsening in our financial objectives if we choose the right SR funds to invest in. 6.2.. Implications for theory and practice. This study highlights the relevance of distinguishing between SR funds achieving higher and lower SR attributes in their portfolios, such as environmental or sustainability characteristics, among others. Overall, we find that funds achieving higher scores on their SR attributes seem to underperform their non-SR intensively oriented counterparts. This evidence is, however, mainly driven by the overall behavior of the worst-performing funds, and it is not associated with the sustainable levels accomplished in the funds’ portfolios. Accordingly, several funds with high SR scores do experience greater risk-adjusted returns over time, implying that assessing correctly the financial performance is essential 18.
(20) to improve the SR funds’ results. These findings have several theoretical and practical implications. For instance, the characteristics and specific risks related to the portfolio can determine the overall returns of a mutual fund. This is especially relevant for funds aiming to invest in sustainable assets to a greater extent, achieving higher socially-conscious objectives in their investments. Therefore, managers and investors should consider the specific features and SR scores related to each portfolio when assessing the relative performance of their funds; otherwise, their results and conclusions will be biased, potentially affecting the consistency and adequacy of their subsequent decisions. Moreover, this study also highlights the importance of SR funds in the financial sector. As shown throughout the paper, several funds oriented to high levels of sustainability and SR treats are shown to persistently provide investors with greater performances. Accordingly, the access to information related to socially-responsible and financial features of these investment vehicles plays an important role in improving the investment decisions of all individuals who participate in the market. Therefore, the efforts made by policymakers must be focused towards an enhancement of the transparency, quality and availability of the data reported in the SR mutual fund industry. This implication would lead managers and investors to optimize their financial and sustainable investment decisions. Finally, it should be noted that our study only assesses the financial performance of funds with specific levels of environmental, sustainable and other SR attributes in their portfolios. Nonetheless, this perspective also offers many avenues for future research lines, especially those related to managerial perceptions. Some examples would be to assess managers’ abilities to detect “green” opportunities, or determine the sensitivity of inflows and outflows in SR portfolios to new environmental information. Moreover, given the evidence from this study about the persistence in the abnormal performance of socially-conscious portfolios, developing sustainable performance measures that combine both ethical and financial criteria in the mutual fund industry is a potentially key topic for academics, investors, and other stakeholders who want a better understanding of the behavior of sustainable portfolios.. 19.
(21) References Abdelsalam, O., Duygun, M., Matallín, J. C., and Tortosa-Ausina, E. (2017). Is ethical money sensitive to past returns? The case of portfolio constraints and persistence of Islamic funds. Journal of Financial Services Research, 51(3):363–384. Bauer, R., Koedijk, K., and Otten, R. (2005). International evidence on ethical mutual fund performance and investment style. Journal of Banking & Finance, 29(7):1751–1767. Benson, K. L. and Humphrey, J. E. (2008). Socially responsible investment funds: Investor reaction to current and past returns. Journal of Banking & Finance, 32(9):1850–1859. Bollen, N. and Busse, J. (2001). On the timing ability of mutual fund managers. Journal of Finance, 56(3):1075–1094. Bollen, N. and Busse, J. (2005). Short-term persistence in mutual fund performance. Review of Financial Studies, 18(2):569–597. Bollen, N. P. B. (2007). Mutual fund attributes and investor behavior. Journal of Financial and Quantitative Analysis, 42(03):683–708. Brown, S. J. and Goetzmann, W. N. (1995). Performance persistence. Journal of Finance, 50:679–698. Busch, T., Bauer, R., and Orlitzky, M. (2016). Sustainable development and financial markets: Old paths and new avenues. Business & Society, 55(3):303–329. Busse, J. and Irvine, P. (2006). Bayesian alphas and mutual fund persistence. Journal of Finance, 61(5):2251–2288. Busse, J. A., Goyal, A., and Wahal, S. (2010). Performance and persistence in institutional investment management. Journal of Finance, 65(2):765–790. Cai, W. and Li, G. (2018). The drivers of eco-innovation and its impact on performance: Evidence from China. Journal of Cleaner Production, 176:110–118. Capelle-Blancard, G. and Monjon, S. (2012). Trends in the literature on socially responsible investment: Looking for the keys under the lamppost. Business Ethics: a European Review, 21(3):239–250. 20.
(22) Carhart, M. M. (1997). On persistence in mutual fund performance. Journal of Finance, 52(1):57–82. Chang, C. E., Nelson, W. A., and Witte, H. D. (2012). Do green mutual funds perform well? Management Research Review, 35(8):693–708. Climent, F. and Soriano, P. (2011). Green and good? The investment performance of US environmental mutual funds. Journal of Business Ethics, 103(2):275–287. Cremers, K. J. and Petajisto, A. (2009). How active is your fund manager? A new measure that predicts performance. Review of Financial Studies, 22(9):3329–3365. Cremers, M., Petajisto, A., and Zitzewitz, E. (2013). Should benchmark indices have alpha? Revisiting performance evaluation. Critical Finance Review, 2(1):1–48. Cuthbertson, K., Nitzsche, D., and O’Sullivan, N. (2008). UK mutual fund performance: Skill or luck? Journal of Empirical Finance, 15(4):613–634. Elton, E. J., Gruber, M. J., and Blake, C. R. (1996). The persistence of risk-adjusted mutual fund performance. Journal of Business, 69(2):133–157. Elton, E. J., Gruber, M. J., Das, S., and Hlavka, M. (1993). Efficiency with costly information: A reinterpretation of evidence from managed portfolios. Review of Financial Studies, 6(1):1–22. Fama, E. F. and French, K. R. (2010). Luck versus skill in the cross-section of mutual fund returns. Journal of Finance, 65(5):1915–1947. Fama, E. F. and French, K. R. (2015). A five-factor asset pricing model. Journal of Financial Economics, 116(1):1–22. Friede, G., Busch, T., and Bassen, A. (2015). ESG and financial performance: Aggregated evidence from more than 2000 empirical studies. Journal of Sustainable Finance & Investment, 5(4):210–233. Galema, R., Plantinga, A., and Scholtens, B. (2008). The stocks at stake: Return and risk in socially responsible investment. Journal of Banking & Finance, 32(12):2646–2654. Gottesman, A. A. and Morey, M. R. (2007). Predicting emerging market mutual fund performance. Journal of Investing, 16(3):111–122. 21.
(23) Helminen, R.-R. (2000). Developing tangible measures for eco-efficiency: the case of the Finnish and Swedish pulp and paper industry. Business Strategy and the Environment, 9(3):196. Huang, J., Sialm, C., and Zhang, H. (2011). Risk shifting and mutual fund performance. Review of Financial Studies, 24(8):2575–2616. Humphrey, J. E., Lee, D. D., and Shen, Y. (2012). Does it cost to be sustainable? Journal of Corporate Finance, 18(3):626–639. Jansson, M. and Biel, A. (2014). Investment institutions’ beliefs about and attitudes toward Socially Responsible Investment (SRI): A comparison between SRI and non-SRI management. Sustainable Development, 22(1):33–41. Jensen, M. C. (1968). The performance of mutual funds in the period 1945–1964. Journal of Finance, 23:389–416. Jin, J. and Han, L. (2018). Assessment of Chinese green funds: Performance and industry allocation. Journal of Cleaner Production, 171:1084–1093. Kacperczyk, M., Van Nieuwerburgh, S., and Veldkamp, L. (2009). Rational attention allocation over the business cycle. Working Paper 15450, National Bureau of Economic Research, Cambridge, MA. Kempf, A. and Osthoff, P. (2007). The effect of socially responsible investing on portfolio performance. European Financial Management, 13(5):908–922. Koellner, T., Weber, O., Fenchel, M., and Scholz, R. (2005). Principles for sustainability rating of investment funds. Business Strategy and the Environment, 14(1):54–70. Kosowski, R. (2011). Do mutual funds perform when it matters most to investors? US mutual fund performance and risk in recessions and expansions. Quarterly Journal of Finance, 1(3):607–664. Laurel-Fois, D. (2016). Beyond appearances the risk-reducing effects of responsible investment practices. Business & Society, forthcoming. Lean, H. H., Ang, W. R., and Smyth, R. (2014). Performance persistence of socially responsible investment funds in the Asia Pacific region. In Gregoriou, G. and David, L., editors, 22.
(24) Handbook of Asian finance REITs, trading, and fund performance, volume 2, pages 377–392. Academic Press Inc. Lean, H. H., Ang, W. R., and Smyth, R. (2015). Performance and performance persistence of socially responsible investment funds in Europe and North America. The North American Journal of Economics and Finance, 34:254–266. Leite, P. and Cortez, M. C. (2013). Performance and performance persistence of European socially responsible funds: French evidence. Technical report, School of Management, Polytechnic Institute of Cavado and Ave., Portugal. Mallett, J. and Michelson, S. (2010). Green investing: is it different from socially responsible investing? International Journal of Business, 15(4):395–410. Martí-Ballester, C. P. (2015). Can socially responsible investment for cleaner production improve the financial performance of Spanish pension plans? Journal of Cleaner Production, 106:466–477. Massa, M. and Patgiri, R. (2009). Incentives and mutual fund performance: Higher performance or just higher risk taking? Review of Financial Studies, 22(5):1777–1815. Matallín-Sáez, J. C. (2006). Seasonality, market timing and performance amongst benchmarks and mutual fund evaluation.. Journal of Business Finance & Accounting, 33(9-. 10):1484–1507. Matallín-Sáez, J. C., Soler-Domínguez, A., and Tortosa-Ausina, E. (2016). On the robustness of persistence in mutual fund performance. The North American Journal of Economics and Finance, 36:192–231. Muñoz, F., Vargas, M., and Marco, I. (2014). Environmental mutual funds: Financial performance and managerial abilities. Journal of Business Ethics, 124(4):551–569. Nofsinger, J. and Varma, A. (2014). Socially responsible funds and market crises. Journal of Banking & Finance, 48:180–193. O’Rourke, A. (2003). The message and methods of ethical investment. Journal of Cleaner Production, 11(6):683–693.. 23.
(25) Palacios-González, M. M. and Chamorro-Mera, A. (2018). Analysis of the predictive variables of the intention to invest in a socially responsible manner. Journal of Cleaner Production, 196:469–477. Pástor, L. and Stambaugh, R. F. (2002). Investing in equity mutual funds. Journal of Financial Economics, 63(3):351–380. Renneboog, L., Ter Horst, J., and Zhang, C. (2008a). Socially responsible investments: Institutional aspects, performance, and investor behavior. Journal of Banking & Finance, 32(9):1723–1742. Renneboog, L., Ter Horst, J., and Zhang, C. (2008b). The price of ethics and stakeholder governance: The performance of socially responsible mutual funds. Journal of Corporate Finance, 14(3):302–322. Renneboog, L., Ter Horst, J., and Zhang, C. (2011). Is ethical money financially smart? Nonfinancial attributes and money flows of socially responsible investment funds. Journal of Financial Intermediation, 20(4):562–588. Rohleder, M., Scholz, H., and Wilkens, M. (2011). Survivorship bias and mutual fund performance: Relevance, significance, and methodical differences. Review of Finance, 15(2):441–474. Said, R. M., Sulaiman, M., and Ahmad, N. N. N. (2013). Do fund managers perceive environmental information useful? An empirical study from Malaysia. Journal of Cleaner Production, 52:281–288. Sharpe, W. F. (1992). Asset allocation: management style and performance measurement. Journal of Portfolio Management, 18(2):7–19. Sheather, S. J. and Jones, M. C. (1991). A reliable data-based bandwidth selection method for kernel density estimation. Journal of the Royal Statistical Society, Ser.B,53(3):683–690. Silva, F. and Cortez, M. C. (2016). The performance of US and European green funds in different market conditions. Journal of Cleaner Production, 135:558–566. Sun, Z., Wang, A., and Zheng, L. (2013). returns and hedge fund performance.. Only when the tide goes out: Downside Working paper, SSRN.. Available at SSRN:. http://ssrn.com/abstract=2249033 or http://dx.doi.org/10.2139/ssrn.2249033. 24.
(26) Table 1: Evolution of the number of SR funds, 2000–2018a Number of funds. % Change. Morningstar equity category. Morningstar equity category. Year. Europe. 2000 2001 2002 2003 2004 2005 2006 2007 2008 2009 2010 2011 2012 2013 2014 2015 2016 2017 2018. 216 255 285 308 325 355 401 435 467 469 487 505 508 604 654 730 805 928 925. US and Canada 229 266 275 274 286 314 345 438 505 494 497 487 473 535 653 796 963 1200 1193. Other 40 56 65 69 80 90 100 142 162 152 156 150 138 314 365 454 540 737 725. Mean % change 2000–2018 Mean % change 2000–2008 Mean % change 2009–2013 Mean % change 2014–2018 a. Total 485 577 625 651 691 759 846 1,015 1,134 1,115 1,140 1,142 1,119 1,097 1,672 1,980 2,308 2,865 2,843. — 18.06 11.76 8.07 5.52 9.23 12.96 8.48 7.36 0.43 3.84 3.70 0.59 18.90 8.28 11.62 10.27 15.28 –0.32. US and Canada — 16.16 3.38 –0.36 4.38 9.79 9.87 26.96 15.30 –2.18 0.61 –2.01 –2.87 13.11 22.06 21.90 20.98 24.61 –0.58. 8.56 10.18 5.49 9.03. 10.06 10.68 1.33 17.79. Europe. Other — 40.00 16.07 6.15 15.94 12.50 11.11 42.00 14.08 –6.17 2.63 –3.85 –8.00 127.54 16.24 24.38 18.94 36.48 –1.63. — 18.97 8.32 4.16 6.14 9.84 11.46 19.98 11.72 –1.68 2.24 0.18 –2.01 –1.97 52.42 18.42 16.57 24.13 –0.77. 20.25 19.73 22.43 18.88. 11.01 11.32 –0.65 22.15. Note, number of funds measured on December 31, except for 2018 that is measured on March 29.. 25. Total.
(27) Table 2: Survival characteristics of the mutual funds in the sample Morningstar equity category. S= 36.5a. Morningstar SR attributes scores. S ≥ 4b. S < 4c. NS ≥ 4d. NS < 4e. Total. Portfolio Sustainability. High Mid Low. 52 36 8. 316 150 36. 171 11 2. 70 64 8. 17 1 2. 626 262 56. Portfolio Environmental. High Mid Low. 48 42 6. 294 120 88. 160 16 8. 64 59 19. 16 1 3. 582 238 124. Portfolio Social. High Mid Low. 42 39 15. 320 118 64. 169 11 4. 63 47 32. 17 1 2. 611 216 117. Portfolio Governance. High Mid Low. 52 33 11. 317 145 40. 169 12 3. 65 61 16. 17 1 2. 620 252 72. Europe. Undefined Total category. 5. 91. 47. 182. 35. 360. 101. 593. 231. 324. 55. 1304. Portfolio Sustainability. High Mid Low. 8 28 35. 78 345 182. 61 268 104. 32 84 87. 5 38 9. 184 763 417. Portfolio Environmental. High Mid Low. 10 34 27. 104 331 170. 67 257 109. 52 71 80. 11 27 14. 244 720 400. Portfolio Social. High Mid Low. 10 33 28. 78 376 151. 70 270 93. 39 93 71. 4 43 5. 201 815 348. Portfolio Governance. High Mid Low. 11 30 30. 58 390 157. 64 263 106. 35 89 79. 0 43 9. 168 815 381. 1. 51. 32. 233. 37. 354. US and Canada. Undefined Total category. 72. 656. 465. 436. 89. 1,718. Portfolio Sustainability. High Mid Low. 1 3 1. 29 89 196. 13 46 175. 24 11 23. 2 7 19. 69 156 414. Portfolio Environmental. High Mid Low. 0 4 1. 22 98 194. 18 81 135. 8 27 23. 2 13 13. 50 223 366. Portfolio Social. High Mid Low. 0 4 1. 39 69 206. 6 51 177. 22 12 24. 1 13 14. 68 149 422. Portfolio Governance. High Mid Low. 2 2 1. 52 49 213. 9 41 184. 24 12 22. 4 5 19. 91 109 439. 2. 114. 56. 66. 21. 259. Total category. 7. 428. 290. 124. 49. 898. 180. 1,677. 986. 884. 193. 3,920. Other. Undefined. All funds. S = 36.5: total survivor (36.5 semesters). S ≥ 4: mature survivor (it has value for s36.5), with at least four semesters. c S < 4: new survivor (it has value for s36.5), with less than four semesters. d NS ≥ 4: no survivor (no value for s36.5), with at least four semesters. e NS < 4: no survivor (no value for s36.5), with less than four semesters.. a. b. 26.
(28) Table 3: Mutual fund summary statistics, 2000–2018 Morningstar equity category. Morningstar SR attributes scores. Number of funds. Average annualized net return (%). Average annualized s.d. (%). Average size (US$). Portfolio Sustainability. High Mid Low. 626 262 56. 7.87 6.40 4.05. 16.16 17.78 20.42. 63,493,482 125,907,792 83,442,207. Portfolio Environmental. High Mid Low. 582 238 124. 7.89 6.76 5.06. 16.03 17.90 18.83. 84,810,779 86,621,608 51,478,513. Portfolio Social. High Mid Low. 611 216 117. 7.86 6.56 5.17. 16.03 18.15 18.86. 77,698,530 101,281,895 56,924,132. Portfolio Governance. High Mid Low. 620 252 72. 7.97 6.56 3.23. 16.21 17.27 21.08. 66,753,485 110,411,021 103,147,120. Europe. Undefined Total category. 360. 3.90. 18.58. 77,112,319. 1,304. 6.31. 17.34. 80,063,077. Portfolio Sustainability. High Mid Low. 184 763 417. 8.49 9.60 8.67. 13.55 13.90 16.85. 34,120,169 71,724,629 90,319,640. Portfolio Environmental. High Mid Low. 244 720 400. 8.73 10.02 7.89. 14.04 13.98 16.60. 53,402,803 83,011,176 62,614,355. Portfolio Social. High Mid Low. 201 815 348. 9.09 9.34 8.80. 13.56 14.21 16.72. 36,635,807 78,871,351 76,265,091. Portfolio Governance. High Mid Low. 168 815 381. 8.03 9.13 9.74. 14.64 13.91 16.62. 34,312,381 78,650,540 73,956,266. 354. 1.90. 21.83. 30,345,123. US and Canada. Undefined Total category. 1,718. 7.67. 16.21. 64,080,875. Portfolio Sustainability. High Mid Low. 69 156 414. 9.93 10.27 12.90. 22.02 16.89 15.03. 29,799,194 31,846,150 32,205,593. Portfolio Environmental. High Mid Low. 50 223 366. 10.15 11.84 12.24. 18.62 18.71 14.40. 27,641,400 25,385,487 36,594,742. Portfolio Social. High Mid Low. 68 149 422. 7.79 10.56 13.09. 22.00 16.50 15.21. 22,218,351 38,225,058 31,095,988. Portfolio Governance. High Mid Low. 91 109 439. 9.02 10.87 12.80. 21.89 15.46 15.26. 23,820,437 40,431,008 31,256,875. 259. 8.55. 17.79. 32,691,782. 898. 10.96. 16.68. 32,068,387. 3,920. 7.97. 16.70. 62,086,961. Other. Undefined Total category All funds. 27.
(29) Table 4: Summary statistics for the benchmarks Average annualized net return 6.04% 4.81% 9.46%. Factors FTSE World DJ Sustain World NR USD FTSE Emerging TR USD. 28. Average annualized s.d. 16.15% 17.80% 19.22%.
(30) 29. Other. US and Canada. Europe. Morningstar equity category. 898 3920. Total category All funds. 259. 191 255 193. High Mid Low. Portfolio Governance. Undefined. 179 265 195. 188 249 202. High Mid Low. Portfolio Environmental High Mid Low. 190 255 194. High Mid Low. Portfolio Sustainability. Portfolio Social. 1718. Total category. 354. 404 548 412. High Mid Low. Portfolio Governance. Undefined. 406 545 413. 404 545 415. High Mid Low High Mid Low. 394 557 413. High Mid Low. Portfolio Social. Portfolio Environmental. Portfolio Sustainability. 1304. Total category. 360. 280 377 287. High Mid Low. Portfolio Governance. Undefined. 282 378 284. High Mid Low. 279 379 286. High Mid Low. Portfolio Environmental. Portfolio Social. 280 380 284. High Mid Low. Number of funds. Portfolio Sustainability. Morningstar SR attributes scores. 53.34%. 41.09%. 35.14%. 39.79% 52.55% 35.23%. 39.66% 47.92% 41.03%. 38.30% 46.99% 44.06%. 40.00% 52.94% 34.54%. 60.48%. 66.95%. 67.57% 57.30% 52.18%. 59.61% 64.40% 50.61%. 63.86% 56.15% 57.35%. 66.50% 60.50% 49.15%. 52.38%. 67.50%. 47.14% 48.54% 43.55%. 49.65% 49.47% 39.79%. 50.18% 50.40% 38.11%. 46.43% 48.42% 44.37%. <0. 5.46%. 1.89%. 0.77%. 3.66% 3.14% 0.00%. 3.35% 3.40% 0.00%. 3.19% 1.20% 2.97%. 3.16% 3.53% 0.00%. 7.97%. 11.58%. 11.14% 5.84% 4.61%. 10.34% 7.16% 3.63%. 8.66% 6.97% 5.54%. 10.91% 6.46% 4.12%. 4.60%. 8.33%. 0.00% 3.18% 6.27%. 0.00% 2.65% 7.04%. 2.15% 1.58% 6.29%. 1.07% 1.84% 7.04%. pvalue≤ 0.05. 46.66%. 58.91%. 64.86%. 60.21% 47.45% 64.77%. 60.34% 52.08% 58.97%. 61.70% 53.01% 55.94%. 60.00% 47.06% 65.46%. 39.52%. 33.05%. 32.43% 42.70% 47.82%. 40.39% 35.60% 49.39%. 36.14% 43.85% 42.65%. 33.50% 39.50% 50.85%. 47.62%. 32.50%. 52.86% 51.46% 56.45%. 50.35% 50.53% 60.21%. 49.82% 49.60% 61.89%. 53.57% 51.58% 55.63%. >0. 3.27%. 3.23%. 2.32%. 3.66% 1.96% 5.70%. 3.35% 1.13% 7.18%. 2.13% 1.61% 7.43%. 3.68% 1.96% 5.67%. 2.56%. 2.82%. 3.22% 0.91% 3.88%. 0.00% 3.12% 4.12%. 0.00% 3.30% 3.86%. 0.00% 2.87% 4.36%. 4.22%. 1.67%. 1.07% 6.63% 7.32%. 3.55% 4.23% 8.10%. 2.51% 4.22% 9.09%. 3.21% 4.21% 8.45%. p-value ≤ 0.05. Percentage of total number of funds in group. Table 5: Performance. -0.16%. 1.58%. 1.89%. 1.36% 0.31% 3.06%. 0.74% 0.89% 2.87%. 1.57% 0.51% 2.49%. 0.80% 0.79% 2.96%. -0.85%. -1.85%. -1.19% -1.05% 0.61%. -0.23% -1.37% 0.08%. -0.70% -0.16% -1.05%. -1.06% -0.68% -0.03%. -0.46%. -2.35%. -0.16% 0.60% 0.22%. 0.10% 0.19% 0.51%. 0.45% -0.20% 0.69%. 0.66% 0.04% 0.17%. 0.73%. 1.14%. 1.77%. 2.61% -0.74% 2.08%. 2.17% -0.07% 1.60%. 1.46% 1.02% 0.14%. 2.54% -0.02% 0.60%. 0.66%. -0.90%. -0.65% 1.64% 0.65%. -0.30% 1.00% 1.59%. -0.38% 0.85% 1.70%. -0.94% 1.27% 1.30%. 0.69%. -1.26%. 1.92% 1.15% 1.01%. 1.12% 1.63% 0.96%. 0.77% 1.37% 1.59%. 1.40% 1.39% 1.21%. Weighted average by fund size. 0.05%. 1.25%. 1.67%. 0.97% -0.09% 2.90%. 0.78% 0.39% 2.66%. 0.77% 1.09% 1.43%. 0.86% -0.05% 3.46%. -0.82%. -1.47%. -1.26% -0.45% -0.39%. -1.04% -0.91% -0.14%. -0.85% -0.58% -0.58%. -1.37% -0.68% -0.21%. 0.44%. -1.44%. 1.79% 1.43% 0.18%. 1.63% 1.25% 0.48%. 1.31% 1.17% 0.70%. 1.84% 1.29% 0.28%. Weighted average by fund life. Annualized performance Mean (unweighted average).
(31) Table 6: Comparative performance according to SR attributes’ scores Morningstar equity category. Morningstar SR attributes scores. Difference in annualized performance. p-valuea. Europe. Portfolio Sustainability Portfolio Environmental Portfolio Social Portfolio Governance. High – Low High – Low High – Low High – Low. 0.49% –0.24% –0.41% –0.38%. 0.155 0.307 0.187 0.186. US and Canada. Portfolio Sustainability Portfolio Environmental Portfolio Social Portfolio Governance. High – Low High – Low High – Low High – Low. –1.03% 0.36% –0.30% –1.80%. 0.006 0.190 0.210 0.000. Other. Portfolio Sustainability Portfolio Environmental Portfolio Social Portfolio Governance. High – Low High – Low High – Low High – Low. –2.17% –0.92% –2.13% –1.70%. 0.000 0.089 0.000 0.010. a. Tests for significance were run by boostrapping one-sided p-values.. 30.
(32) Table 7: Comparative performance according to SR attributes’ scores (only surviving funds) Morningstar equity category. Morningstar SR attributes scores. Difference in annualized performance. p-valuea. Europe. Portfolio Sustainability Portfolio Environmental Portfolio Social Portfolio Governance. High – Low High – Low High – Low High – Low. 0.48% –0.88% –0.38% –0.02%. 0.175 0.027 0.197 0.488. US and Canada. Portfolio Sustainability Portfolio Environmental Portfolio Social Portfolio Governance. High – Low High – Low High – Low High – Low. –0.94% -0.14% –0.77% –0.97%. 0.005 0.368 0.016 0.001. Other. Portfolio Sustainability Portfolio Environmental Portfolio Social Portfolio Governance. High – Low High – Low High – Low High – Low. –4.00% –1.28% –3.12% –4.17%. 0.000 0.075 0.000 0.000. a. Tests for significance were run by boostrapping one-sided p-values.. 31.
(33) Table 8: Performance persistence Morningstar equity category. Morningstar SR attributes’ scores. Performance Q1 (%). Difference Q5 − Q1 (%). p-valuea. Portfolio Sustainability. High Mid Low. 1.94% –1.38% –4.24%. 1.32% 2.89% 1.30%. –0.62% 4.26% 5.54%. 0.760 0.009 0.013. Portfolio Environmental. High Mid Low. –0.27% –0.92% –3.65%. 0.80% 1.88% 1.98%. 1.07% 2.80% 5.63%. 0.538 0.104 0.014. Portfolio Social. High Mid Low. 1.76% –0.54% –3.95%. 2.00% 1.78% 1.69%. 0.24% 2.33% 5.64%. 0.895 0.212 0.010. Portfolio Governance. High Mid Low. 2.32% –1.58% –4.04%. 1.17% 2.84% 0.98%. –1.16% 4.41% 5.01%. 0.505 0.017 0.020. –3.81%. 0.36%. 4.17%. 0.014. Europe. Undefined Portfolio Sustainability. High Mid Low. 0.45% –2.39% –1.22%. 0.83% 0.90% 0.52%. 0.38% 3.29% 1.75%. 0.861 0.022 0.239. Portfolio Environmental. High Mid Low. –1.16% –2.29% –1.74%. 0.51% 0.33% 0.99%. 1.67% 2.61% 2.73%. 0.375 0.049 0.106. Portfolio Social. High Mid Low. –1.17% –1.83% –1.49%. 0.72% 0.82% 0.63%. 1.90% 2.65% 2.12%. 0.299 0.086 0.155. Portfolio Governance. High Mid Low. 0.31% –1.80% –1.72%. 1.79% 0.81% 0.17%. 1.48% 2.61% 1.88%. 0.511 0.045 0.177. –4.52%. –2.19%. 2.33%. 0.297. Portfolio Sustainability. High Mid Low. –1.09% 0.11% 0.85%. 4.02% –6.15% 6.41%. 5.12% –6.26% 5.56%. 0.028 0.220 0.071. Portfolio Environmental. High Mid Low. –2.53% 2.64% –0.92%. 4.71% 2.88% 2.87%. 7.24% 0.24% 3.80%. 0.020 0.932 0.094. Portfolio Social. High Mid Low. –0.86% –4.14% 4.55%. 3.93% –3.35% –2.29%. 4.79% 0.79% –6.83%. 0.039 0.819 0.795. Portfolio Governance. High Mid Low. 0.40% –1.13% 0.06%. 4.56% –7.05% –4.38%. 4.16% –5.92% –4.44%. 0.087 0.782 0.572. –0.72%. –0.62%. 0.10%. 0.980. US and Canada. Undefined. Other. Undefined a. Performance Q5 (%). Tests for significance were run by boostrapping one-sided p-values.. 32.
(34) Table 9: Performance persistence, survivors Morningstar equity category. Morningstar SR attributes’ scores. Performance Q1 (%). Difference Q5 − Q1 (%). p-valuea. Portfolio Sustainability. High Mid Low. 1.73% –0.29% –4.30%. 0.38% 3.60% 2.07%. –1.35% 3.89% 6.37%. 0.523 0.010 0.005. Portfolio Environmental. High Mid Low. –1.55% 0.26% –3.34%. 0.50% 2.49% 2.76%. 2.05% 2.23% 6.10%. 0.288 0.135 0.010. Portfolio Social. High Mid Low. 1.85% 0.39% –3.80%. 1.40% 1.83% 2.52%. –0.45% 1.43% 6.32%. 0.799 0.446 0.005. Portfolio Governance. High Mid Low. 2.41% –1.33% –3.87%. 1.61% 3.19% 2.01%. –0.80% 4.53% 5.88%. 0.669 0.009 0.007. 2.14%. 3.70%. 1.56%. 0.443. Europe. Undefined Portfolio Sustainability. High Mid Low. –0.39% –1.53% –1.19%. –0.41% 1.63% 1.05%. –0.02% 3.16% 2.25%. 0.992 0.040 0.094. Portfolio Environmental. High Mid Low. –2.24% –1.85% –1.30%. –0.18% 0.50% 2.73%. 2.07% 2.34% 4.03%. 0.212 0.093 0.021. Portfolio Social. High Mid Low. –1.95% –1.56% –0.97%. 0.45% 0.36% 1.95%. 2.40% 1.92% 2.92%. 0.157 0.214 0.052. Portfolio Governance. High Mid Low. –0.49% –1.70% –0.73%. 1.18% 1.98% 0.95%. 1.67% 3.68% 1.68%. 0.379 0.024 0.177. US and Canada. Undefined. 1.29%. –2.88%. –4.17%. 0.225. High Mid Low. 0.33% –0.47% –0.75%. 4.46% –6.50% –2.48%. 4.13% –6.03% –1.73%. 0.062 0.255 0.420. Portfolio Environmental. High Mid Low. –1.33% 2.77% –3.63%. 4.87% 2.87% 3.54%. 6.20% 0.09% 7.17%. 0.057 0.974 0.147. Portfolio Social. High Mid Low. 0.60% –2.39% 3.65%. 4.32% –3.83% –2.67%. 3.73% –1.45% –6.32%. 0.088 0.731 0.855. Portfolio Governance. High Mid Low. 2.12% –1.91% –1.69%. 5.07% –7.22% –3.95%. 2.94% –5.31% –2.26%. 0.184 0.874 0.923. 0.52%. –5.13%. –5.64%. 0.334. Portfolio Sustainability. Other. Undefined a. Performance Q5 (%). Tests for significance were run by boostrapping one-sided p-values.. 33.
Figure
+7


Documento similar
In particular, we analyze how bank- a¢ liated mutual funds trade in the stock of the parent bank and show that, consistently with the price support hypothesis, a¢ liated mutual
In all the other items analysed (sustainability policy, university community engagement, education, research, urban planning, energy, water, transportation, waste management,
Our results supported our expectations, by showing a positive moderating effect of Balanced Scorecard and benchmarking controls (i.e., contemporary MACS). These findings
• Theoretical framework: The research model shows the direct relationships between the internalization of quality standards and environmental practices and performance, and
Within the framework of worldwide firms and the existing current environmental, financial and economic situation, the main aim of this project is to analyze the possible
SMEs have the opportunity to focus their hotel strategy and management based on these business models, creating competitive advantages over competing hotels.. These types of
This research makes a number of contributions to the strategic management literature by empirically exploring DC and MO and how these affect firm performance in the case of sole
Concerning related work, we are unable to compare our tool due to the fact that, as far as we know, there exist four SPE tools [3, 2, 10, 15] based on UML and none of them
