Estimating a threshold price for CO2 emissions of buildings to improve their energy performance level: case study of a new Spanish home
31
0
0
Texto completo
(2) respectively); and also through the Thermal Installation in Buildings Regulation (RITE), RD1027/2007, of 20 July, and RD 47/2007, of 19 January, which details the basic procedures to certify energy performance in new buildings. The transposition of the EPBD has been completed by RD 235/2013, which includes existing buildings. These regulations have led to the development of various simulation software systems that verify compliance with minimum requirements. They estimate the energy performance of buildings by calculating the expected value of primary energy consumed and its translation into kilograms of CO2. The use of simulation enables the implementation of measures in the design phase with a view to checking how energy performance is affected. According to Article 2 of the EPBD 2010, the cost optimal level is “the lowest cost determined by taking into account energy-related investment costs, maintenance and operating costs, including energy costs and savings, the category of the building concerned, and earnings from the energy produced”. Different constructive solutions and facilities in a building, which determine its energy performance level, will be influential on the investment cost, but also on the maintenance and operation costs during its lifespan. This is considered strictly from a private point of view, so the sum of these costs is considered private costs. However from a societal viewpoint, the costs and benefits to society must be taken into account. In the building sector, this consideration has been taken from the cost-benefit analysis viewpoint (Verbruggen, 2012) and from the compromise-programming perspective to balance private and social aspects (Ruá and Guadalajara, 2013). Based on these considerations, we chose to include CO2 emissions in our analyses. Annexe III of the EPBD 2010 presents the need for the comparative methodology framework to identify cost-optimal levels of energy performance requirements for buildings and building elements. This was supplemented in 2012 by Commission Delegated Regulation (EU) No. 244/2012, of 16 January 2012, and the Guidelines accompanying the aforementioned Commission Delegated Regulation (EU) No. 244/2012. This regulation supports the addition of the cost of CO2 when the global cost is calculated at the macroeconomic level, as we have proceeded in this work. However, this study was done in 2010 before the aforementioned regulation existed. In order to estimate the investment and maintenance costs, available data on a real development project have been used as a case study (measurements, constructive solutions, materials, facilities, etc.). Energy consumption and CO2 emissions have been estimated using the simulation software systems. Reaching a higher energy performance level may imply higher construction costs. However, the cost incurred by energy consumption will be lower. From the economic or private viewpoint, a rational purchaser would buy more economic dwellings, and possibly less energy-efficient ones. However, energy savings and reduced environmental pollution costs for society favour the promotion of energy-efficient dwellings (Ruá and Guadalajara, 2014). The objective of this paper is to calculate what CO2 prices should exist in Spain in order to stimulate building high energy performance class buildings. To do that, the total costs arising from the use of the building were estimated and, due as a market price for CO2 emissions does not exist, the threshold prices that would permit the minimisation of the total costs in the best energy performances ratings were estimated.. 2.
(3) The article is divided into six sections. The second section briefly describes the energy performance certification procedure in Spain. The third section presents the information sources, and describes the single-family dwelling selected as a case study, the preliminary study and the software systems used to obtain the values for the investment and operation costs of the house according to its energy performance, location and the CO2 emissions arising from the use of energy. The fourth section presents the hypotheses and the methodology suggested. The fifth section provides the results. Finally, the sixth section includes the conclusions and a discussion.. II. The Spanish energy performance certification procedure Comparisons made of the national implementation of the EPBD have indicated differences among countries in terms of procedures and level of implementation (CAEPBD, 2008; Perez-Lombard et al., 2009; Andaloro et al., 2010; CA-EPBD, 2011; Annunziata et al., 2013). However, the EPBD recast in 2010 includes an objective of converging requirements. According to the reports of the Concerted Action for the EPBD (CA-EPDB), most countries employ the energy demand indicator (kWh/m2.year, or MJ/m2.year in The Netherlands), while others use the CO2 emissions indicator (kg CO2/m2.year).The rating also differs from one country to another as so: while some use letters from A to F, others add numbers such as A1, A2, etc. The procedure for rating the energy performance of new residential buildings in Spain is detailed in the AICIA (2009). New buildings are assigned an energy performance score on a scale of five values indicated by letters A to E, with A being the best rating. Under RD 47/2007, which came into force in November 2007, new buildings are labelled to indicate their energy performance rating, which corresponds to this scale. These ratings are based on annual emission values in kg of CO2 per square metre and annual consumption of primary energy in kWh per square metre depending on: type of building (detached or semi-detached house or apartment building); thermal envelope; climatic zone; municipality in which the building is located; the minimum solar contribution to domestic hot water (DHW) required in the municipality and facilities to ensure inner thermal comfort (air conditioning and heating). Lower grades, F and G, can be used in existing buildings, but new buildings that meet the CTE must obtain an E grade, or above. While processing energy ratings, climate is a key factor as external conditions will greatly influence the calculation of the energy requirements for a building. In countries with significant climate variations among regions, distinct climate zones have to be defined, which is the case for Spain (see details below). The CTE divides Spain into 12 climatic zones, according to the limitation of the energy demand of buildings (Table 1). Each provincial capital is assigned a zone and the classification of the corresponding area reflects that of the provincial capital. However within the same province, different climatic zones may exist with altitudes that vary by more than 200 metres from that of the provincial capital (Appendix D.1, CTE-HE1). The naming system for the climatic zone is composed of a letter and a number which indicate severity of winters and summers, respectively. The letter A indicates mild 3.
(4) winters and E denotes the coldest winters, while number 1 suggests cool summers and 4 denotes the hottest summers. The severities of summer and winter are linked with the Cooling and Heating Degree Days (CDD and HDD), respectively, and also with solar radiation (CTE-HE1). As a result, progression from climatic zone A to E gives rise to an increased need for heating, while that from climatic zone 1 to 4 suggests an increased need for cooling. The cells in grey in Table 1 refer to nonexistent combinations. A representative city has been selected for each climatic zone. This nomenclature is applied to Spanish climatic conditions. All the cells of Table 1 show the climatic zone resulting from the letter and number combination, the selected city, HDD and CDD, considered a base temperature of 20ºC and the average temperatures for January and August for each city. For example, the HDD for the most extreme climates, A4 (Almería, SE Spain) and E1 (Burgos, N Spain), are 1122 and 3360, respectively, while the CDDs are 690 and 233, respectively. The average temperature in January is 12.3ºC in Almería and 3.0ºC in Burgos. The average temperature in August is 25.6ºC in Almería and 19.2ºC in Burgos. By the energy certification procedure, the energy performance label is obtained for a new building in two different phases: the design phase, before construction starts, as confirmed by the designer; once the building has been delivered to ensure it achieves the designed energy performance, which must be checked by an external auditor. This is compulsory in order to obtain the occupation licence. From 1 June 2013, Spanish buildings to be sold or rented must exhibit the energy efficiency label to the purchaser or renter. In Spain, the certified building must be registered in the official Register, which is dependent on the local government for each region in Spain. Local registers are responsible for the external audit of certification (by architects, technical architects and industrial engineers). From the above, it can be concluded that the completed procedure is very recent. Therefore, the relationship between energy efficiency and economic factors is still a recent issue. Examining the possible interactions between the energy performance level and the economics of a given building will be useful to understand how labelling buildings can help achieve energy savings. In some countries, where procedures have already been implemented, the effectiveness of the measures to promote energy efficiency has been analysed by various studies and from different perspectives. GramHansen et al. (2007) compared the effectiveness of energy efficiency labels between Denmark and Belgium; despite the fact that the label in Denmark is mandatory, but not in Belgium, the results show that in both cases, investment in energy efficiency is not perceived as a priority in the everyday life of families. Kjaerbye (2008) studied the average labelling effect in terms of natural gas consumption in single-family houses in Denmark, and did not find significant differences when comparing A-, B- and Clabelled houses. Amecke (2012) concluded that for existing residential dwellings in Germany, the influence of energy performance certificates on a private purchaser is limited.. III. Information sources and methodology for technical and costs calculations III.1. Case study The energy certification methodology followed in Europe, and therefore, in Spain, is based on the EPBD, which distinguishes between single-family houses and apartment 4.
(5) buildings. Although apartment buildings are more common in Spain than single-family houses (30% of residential dwellings are single-family houses according to the 2001 Spanish national census), this study was done using a single-family house because it is simpler to model for cost data and CO2 emissions. Besides, single-family houses are less energy-efficient because the thermal envelope is more exposed to external conditions (Gómez and Esteban, 2010; Garrido et al., 2011; Mercader et al., 2012). A single-family house has been selected as a case study to isolate the parameters which influence a house’s energy performance, these being the thermal envelope composition and the facilities that ensure thermal comfort (heating, air conditioning and DHW). These are the factors that can be varied to meet different energy performance levels for the same house configuration. The rest of the factors, which are linked to external conditions, are determined by climatic zone. Other factors such as orientation, influence of obstacles for solar radiation (near buildings, trees, etc.), and the geometry of the house, also influence energy performance. However, they are not considered in this study. The data required to do this study (measurements and plans) were available and can be considered representative of a standard single-family house. According to the Spanish National Statistics Institute (INE), average single-family houses in Spain cover between 120 m2 and 150 m2. Specifically, the reference dwelling used for our case study is a terraced family house with a garage and utility installations in the basement, and ground and first floors for residential use. The surface area is 68.10 m2 on the ground floor and 58.88 m2 on the first floor. Table 2 shows the area of the envelope of the house, distinguishing among façades, party walls, windows and roof. The property is located on the end of a terrace and is orientated 25°N. III.2. Simulation software systems The official government computer programmes, which were available when this work was carried out (2010), were used for calculations: Lider v.01 for compliance with minimum limits on energy demand; Calener-VYP v1.0 (residential buildings) for energy performance (energy efficiency label as specified in RD 47/2007) and CO2 emissions (IDAE, 2008, 2009). The software Lider v1.0 and Calener-VYP v.01 are the Spanish versions of DOE-2.2. These programmes simulate the real conditions of a building, although it has to be considered that real performance depends on the actual occupants’ use. Some countries have already made comparisons between theoretical and actual results regarding energy efficiency (Gram-Hansen et al., 2007; Majcen et al., 2013). In Spain, Jáber-López et al. (2011) proved that consumption predictions, calculated based on the simulation with Calener, were similar to the real consumption levels for two buildings in the Polytechnic University of Valencia (E Spain). According to the CTE, there are two options for certifying new buildings: simplified or general. The simplified option can be used provided that the building meets the minimum requirements, basically regarding the area of windows (under 60% of the façade contains openings and under 10% of the roof has skylights), or the non-existence of bioclimatic elements such as trombé walls and conservatories. Moreover, simplified options do not allow an energy performance above D (i.e., C, B or A) to be obtained because of the simplifications assumed. 5.
(6) The general option must be applied to obtain a rating higher than D and is also required when certain physical characteristics of the building exceed given thresholds (over 60% of the façade contains openings and over 10% of the roof has skylights). The results obtained with the general option are more accurate and more favourable because not many simplifications are assumed. This means that a better rate can be obtained by using the general option. However, Calener-VYP is the only official tool for certifying new residential buildings according to the general option, so it was selected for this study. Table 3 briefly presents the inputs required and the outputs obtained when using the Calener-VYP and Lider programmes. III.3. Preliminary study In this study we analyse the cost of possible energy performance levels in different climatic zones. To obtain these starting combinations, a preliminary study was done in 2010. Further details are found in Ruá and Lopez-Mesa (2012). Appendix 1 shows the procedure of the preliminary study, which was performed in three different stages. The three aforementioned stages are summarised as follows: First stage. Selection of 25 influential parameters on energy performance and prices estimation in each climatic zone: The 25 influencing factors on energy performance varied one from another, and were isolated from the rest in order to quantify their degree of influence. All the climatic zones were selected to quantify the influence on different external conditions. For example, a thicker insulation layer in walls proved more effective in cold than in mild weather, an influence which has already been reported by other authors (Al-Homoud, 2005; Laustsen, 2008; Ucar and Balo, 2009). This work led to 300 simulations (25 factors in 12 climatic zones). The energy performance level and, therefore, variation in CO2 emissions, were obtained from these simulations. Besides energy performance, the prices of the solutions were also analysed, and the ratio of variation in CO2 emissions per euro of investment was obtained. Second stage. Combination of parameters to reach E-rated energy performances in each climatic zone: The combination of the factors with the worst energy performance was used as the starting combinations, with the fulfilment of CTE requirements, in order to look for Erated energy performances. The main features of the starting combinations with the worst energy performance level, but one fulfilling CTE requirements, can be seen in Appendix 1. Third stage. Selection of final parameters and combinations reaching each energy performance from E to A: In the third phase of the preliminary study, some factors were discarded, such as orientation, which was fixed. Then the selected factors were changed one by one to improve energy performance from one level to the next upper level, and also from the 6.
(7) least costly to the most costly. These changes are found in Appendix 1. By way of example, if we consider climatic zone B4 from the worst energy performance E, we can obtain a D energy performance more cheaply by simply changing the thickness of the insulation mineral wool (MW) layer on the façade from 5 cm to 8 cm (these are standard thicknesses available on the market). Besides, two complementary measures, such as solar control glasses or back ventilated façades, are required to reach the highest energy performance levels in some configurations, so they were added. Of the 60 possible combinations for housing (5 energy performances and 12 climatic zones), only 50 were actually obtained. This was because a given combination of solutions based on commercial formats produced a D rating (i.e. it was not possible to obtain performance lower than D for some climatic zones) or it was impossible to achieve a B rating with the package of materials and utility installations used in this study. The 50 combinations obtained in the preliminary study are those that are used in the present study to perform the economic analysis linked to the level of energy performance. To make the changes required to achieve all 50 combinations of house ratings, the materials contained in the v.01 Lider programme database were used, as were the materials listed in the ‘Catalogue of Constructive Elements of the Technical Code’ (IETCC, 2010). The information published by manufacturers was used for any material that is not included in the database. Although there are numerous possible combinations of materials and building techniques, only those considered ‘standard’ (the most frequent options observed on the market) are used because they are more likely to be used under real conditions and to also reduce the number of simulations needed to a limited number; so the study is reasonably attainable. The analysis can be extended in the future to include other solutions, such as passive measures involving building orientation, ventilation, etc. III.4. Costs The construction, maintenance and energy consumption costs have been calculated in 2010 prices for the 50 combinations resulting from the preliminary study explained previously in Section III.3. III.4.1. Construction cost The construction cost of the 50 combinations of house energy performance levels is obtained by budgeting the building materials and techniques required for the minimum fulfilment of the energy demand specified by the CTE (cost of materials, labour, and other costs, excluding VAT) (Ramirez de Arellano, 2004; Bertran, 2009). In response to the climatic characteristics of each zone, there are various specification options; e.g., insulation thickness, types of glazing, exterior carpentry, air conditioning systems, etc. In addition, the substitution and repair of facilities or of any other elements in the dwelling with a shorter service life than the whole building were considered after contemplated the year when they were carried out. In order to estimate the budget for each combination, we used Excel sheets. From a base budget, we made the necessary changes to calculate the total project cost for the 50 combinations. Every budget, structured into 21 budget items, is seen in Table 4. Every section is formed by different construction works, whose costs sum the total amount per. 7.
(8) budget item. The sum of the costs of all the budget items gives the total cost of the building. III.4.2. Annual maintenance cost For residential buildings in Spain, general planned maintenance is not that common and is usually carried out when needed because either a problem arises or the service life of an element has ended. However, preventative maintenance is slowly becoming more common and is widely employed in certain types of buildings: hotels, universities, schools, public buildings, etc. Although for a single-family house this is not a common practice in the actual conditions, the maintenance costs considered in this section are those that would theoretically be necessary to maintain the building in perfect conditions, according to many sources. The maintenance cost for the type of house chosen for each energy rating and climatic zone has been calculated in accordance with the approaches suggested by various authors, Piper (1995), Brown (1996), Liska (2000), Kaiser (2001), Brathal and Langemo (2004), and with those suggested by recognised construction authorities: e.g.. the Catalan Institute of Technology (ITEC 1991a, 1991b, 1991c, 1991d, 1994, 1996, 1997, 1999). Reference has been made to the maintenance detailed in the ‘Libro del Edificio’ [Building Book] and in current national and regional regulations (O.14/02/02, Murcia; D. 35/01, Balearic Islands; D. 38/2004, La Rioja; D.158/1997, Catalonia; D.F.322/2000, Navarre; D. 349/1999, the Madrid Community). Forty-five maintenance routines, each with a different periodicity, have been considered. Every maintenance budget is divided into 19 budget items, which cover the different works found in Table 3. Every budget item is formed by different maintenance works whose costs sum the total for the item. In this case, periodicity is also a factor to consider. For example, an annual check of sewage systems, recommended for late summer before autumn rains, and other less common tasks, such as varnishing woodwork, if any, should be done every 5 years, or façade cleaning and maintenance every 10 years. The prices to conform the construction estimates of both investment and maintenance costs were obtained from the Cype Company construction prices database, which is available on the Internet (http://www.generadordeprecios.info/) and permits the selection of different climatic zones since prices depend on the selected province. This construction database covers the average prices for 2010 and is commonly used in the construction sector. It also permits the adaptation of project characteristics in overall terms by adjusting general parameters such as total built area, built area per storey, number of storeys, number of basements, type of building (single-family or apartments), etc. Despite this adjustment, the provided prices are average market prices and actual ones would probably vary depending on the conditions agreed on between buyer and supplier, and also on the actual building conditions considered. However in order to compare different energy performances, all the budgets of combinations are based on the same source. III.4.3. Annual energy consumption cost Calener VYP permits the selection of the energy type for heating, cooling and DHW. Through simulation, annual consumption can be estimated. Alternatives are: electricity, natural gas, diesel, fuel oil, LPG, coal or biomass. 8.
(9) According to the Final SECH-SPAHOUSEC Project Report1, the types of energy used mainly in Spain are natural gas (24.9%), electricity (35.1%) and renewable energies (17.7%, mainly biomass in its different forms, accounting for 94.2% of renewable energies). These data correspond to the whole building stock in Spain, with both new and existing buildings. Some differences are observed between single-family and apartment dwellings. For example when considering the Mediterranean region (E Spain), natural gas, electricity and renewable energies account for 9.1%, 28.4% and 39.7%, respectively, in single-family houses. In the same region and for the same fuel sources, these figures are 34%, 54.9% and 0.1%, respectively, in apartments dwellings. Solar heating is considered a type of renewable energy. Three types of energy are considered for heating and hot water: electricity, natural gas, and biomass. Only electricity is used for cooling. Regarding solar energy, new buildings, according to the CTE, must cover a minimum percentage of DHW requirements. This percentage depends on climatic zone; for example, 70% is required in warm zones such as A4, while only 30% is required in cold zones such as E1, where there is less solar radiation. These minimum requirements are considered in this study. The electricity and gas rates were obtained from the Spanish Official State Gazette (BOE 31.12.09) and VAT was excluded. Given the absence of official rates, biomass prices, including delivery, were obtained from various suppliers as market price averages. These rates correspond to 2010 prices and have been assumed to be constant over the years to make calculations with constant prices and real interest rates since the future price trend is unknown. Estimated prices depend on many terms: energy power contracted, price per kWh and equipment rental, and taxes are excluded. Considering all the fuel sources and all the configurations (climatic zone-energy performance), the average price of energy is €0.063/kWh, with minimum and maximum values of 0.056 and 0.079, respectively. Besides, a new scenario with a double energy price has been considered in order to estimate the influence of energy prices.. III. 5. CO2 emissions According to the previous hypotheses, and after taking into account the thermal envelope, facilities and climatic zone (50 combinations), it is possible to simulate the building and to obtain CO2 emissions. To convert kWh into CO2 emissions, Spanish Ministry of Industry data have been taken (IDAE, 2008). Regarding biomass, the software considers it is a neutral fuel. This means that it is contemplated to not emit CO2 because, although emissions will occur, they are considered to be compensated by the CO2 emissions captured by the plant where the fuel comes from (Uzsilaityte and Martinaitis, 2010). This is not very realistic because the manufacturing and transportation of biomass entail CO2 emissions, as Ruá and López-Mesa (2012) previously warned. However, Calener-VYP considers zero emissions for this fuel source. Table 5 shows the conversion factors depending on fuel source.. 1. Eurostat European Commission, Instituto de Diversificación y Ahorro de Energía, Ministerio de Industria, Energía y Turismo. 2011. Proyecto SECH-SPAHOUSEC. Análisis del consumo energético del sector residencial en España. Informe Final. Madrid.. 9.
(10) IV. Calculation method and hypotheses After analysing the impact of costs and emissions through variations in climatic zones and energy performance levels, the cost-optimal methodology was applied by taking into account the lifetime costs of the building, as suggested by the EPBD, 2010/31/EU and, more recently, by the Commission Delegated Regulation (EU) 244/2012. A simple analysis for a specific house was taken as a case study to estimate the NPV of the total costs for the building, public (social costs because of CO2 emissions) and private costs (investment, maintenance and energy consumption). Some authors (Audenaert et al., 2010; Popescu et al., 2012) have calculated the NPV only for investment in energy efficiency measures on the cost of energy savings. The NPV is calculated for the different climatic zones or locations, and for the amount of CO2 emissions associated with each energy performance rate, according to the official simulation programme. For each building located in a country with an energy certification scheme, each climatic zone or location ‘z’ and each building solution‘s’ (for each energy performance for new buildings, from E to A, in Spain), the “optimal cost” in the cost-optimality methodology, defined in Delegated Regulation (EU) No. 244/2012, is:. (1) where: INVzs is the investment cost for climatic zone z and the building solution for energy performance level s; PMANzs is the maintenance cost for climatic zone z and the building solution for energy performance level s; PENzs is the energy cost for climatic zone z and the building solution for energy performance level s; and PCO2zs is the CO2 emission cost for climatic zone z and the building solution for energy performance level s; r is the discount rate, so general inflation is not considered. Therefore, all the considered costs must be in real terms, which implies excluding general inflation and, besides, the real price increase of the cost component is taken as zero for this work. This avoids putting forward additional hypothesis about the rates for increasing the prices of the payments received and the payments made, and also the inflation rate. T corresponds to the service life of the building, if it is a new construction. When considering existing buildings, T is the remaining life. PCO2 is the result of the equation: PCO2 = KCO2 * VCO2 where: KCO2 = kilograms of CO2 and VCO2 = the CO2 emission value Private costs are determined by the construction costs in year 0, and then by the maintenance and energy costs over the lifetime of the house, as calculated above. Social costs are given by the sum of the above private costs, plus the cost to society of CO2 emissions (PCO2) for operating the house over its life time. This is in line with the macroeconomic perspective of the cost-optimality methodology, where the cost of CO2 emissions has been included. Taxes and subsides have been excluded, except for electric energy prices that are calculated according to official rates, which includes the fees for installed power 10.
(11) and an electricity tax. Consequently for each climatic zone or location ‘z’, the social optimal building solution ‘s’ is that which offers the lowest discounted social costs, thus enabling society to achieve the best economic return, as seen in Expression (1).. When it comes to calculating the value of public costs, represented by CO2 emissions, the problem is the non-existing market. The EU Emissions Trading Scheme (ETS) currently includes only the energy, aviation and industrial sectors. However, this market does not include emissions from buildings. Yet it is possible to obtain the threshold value, or a minimum CO2 emission value, which makes changing from one energy performance level to the next profitable. The minimum or threshold value of CO2 emissions (VCO2), along with each energy performance level, is given by Expression (2): (2). When considering new buildings, the investment cost (INVzf and INVzi) corresponds to the construction cost in year 0 for a given combination (climatic zone z and energy performance, respectively for solutions i and f). Regarding existing buildings, if a similar model is used, the difference (INVzf - INVzi) corresponds to the investment cost for climate zone z for the refurbishment to improve the energy performance from i to f. This permits us to build threshold prices for CO2, one per climatic zone or z location. The hypotheses for the model to perform the analysis are summarised as follows: -. -. -. -. According to the NPV methodology, receipts and payments are used instead of income or costs, and we assume that all payments are made in cash. Therefore, we simply refer to previous payments as costs. Calculations for the payments made in constant values prices were taken from year 0, and they are affected by a real discount rate afterwards, as proposed in the Spanish ECO 805/03 legislative regulations for mortgage valuations, which was later supported by Commission Delegated Regulation EU No. 244/2012 (Article 2). Therefore, prices are considered constant with no increases for energy, materials and rents prices (Drury, 2008). This eliminates the need for additional hypothesis price increases (ΔP) and inflation (α). To simplify calculations, VAT was excluded. Energy performance was not considered to influence rents (which was then taken to be constant for all the combinations tested). The service life of the building was considered, but not its occupancy period. Different users can occupy the building during its service life. Considering the average occupancy period of a dwelling implies putting forward new hypotheses for selling prices once the period has finished. Besides, this selling price is given by the future income of the building until the end of its service life; thus, the building value considers all the cash flow until the end of its lifespan. These calculations assumed a scenario where conditions were similar to current ones in terms of regulations, types of energy, etc. This is a very unlikely 11.
(12) -. -. scenario, but the future trend is unpredictable. It was assumed that buildings would be built according to current practices during the study period. This baseline scenario is called Business as Usual (BAU) (Tuominen et al., 2013). Only the environmental impact (in terms of CO2 emissions) of the building during its operational phase was taken into account. In existing buildings, this phase constituted 80-90% of energy consumption (Ruiz and Romero, 2013). More energy-efficient buildings would represent a lower percentage. The impact of the materials involved in the construction phase (e.g., possible resource depletion) or space consumption were not taken into account since they are considered to be beyond the scope of the study. Maintenance payments are necessary to maintain the energy rate of the building over its remaining life. The dwelling’s operation conditions were considered for average users by taking four occupants for calculations. Energy consumption can differ under actual conditions, depending on the number of occupants and users’ habits.. This work was applied to new buildings. We established a building lifetime of 100 years. This is consistent with the age of buildings as revealed in a Spanish housing census conducted by the National Statistics Institute (INE) (Table 6) with various legislative regulations and scientific papers (RD 1777/2004, of 30 July, on regulating corporate tax, and a table of depreciation coefficients; Rudbeck, 2002; Johnstone, 2001a, 2001b; Davies and Wyatt, 2004; and Article 19 ECO 805/2003). The maintenance costs to maintain the energy rate during the dwelling’s lifespan were considered, as was both the economic cost and the specific time when maintenance had to be done. For elements whose lifespan was shorter than that of the building, we assumed renewal every 15 years (for utility installations) and every 25 years (solar panels, sanitary ware, tiles and kitchen equipment, etc.), respectively. To obtain the real discount rate (r), we took a reference from the legislative regulation for mortgage valuations, ECO 805/03 of 27 March. As a risk-free nominal rate, we adopted the average rate of return for public debt in the secondary market, dated between 2 and 6 years for the 2003-2010 period (which was 3.18%, including inflation). In order to obtain the real term, inflation had to be deducted. To discount inflation, the consumer price index was obtained from the INE as an average value for the 2003-2010 period (which was 2.66%). This resulted in a risk-free real discount rate of 0.5%. Various sources were consulted to determine the risk premium (depending on the intended use of the building), which are shown in Table 7. It must be taken into account that the regulations for mortgage valuations offer appropriate risk premiums, but only to apply the dynamic residual method in order to calculate land values only, thus higher values were acquired. These values ranged from 1% to 8% for main residences. The discount rate was a highly influential parameter for calculations and, moreover, it could differ for each investor depending on the financial sources used (loans, mortgages, own funds, etc.). Therefore, a sensitivity analysis was performed by considering three risk premiums for calculations: 1%, 3% and 5%. As a result, three different values for the real discount rate were used: 1.5%, 3.5% and 5.5%. These values were consistent with those employed in the literature (Audenaert et al., 2010). These rates could also be considered the minimum required internal rate of return (IRR). Two decades ago, Sanstad et al. (1995) used higher nominal rates for investments in. 12.
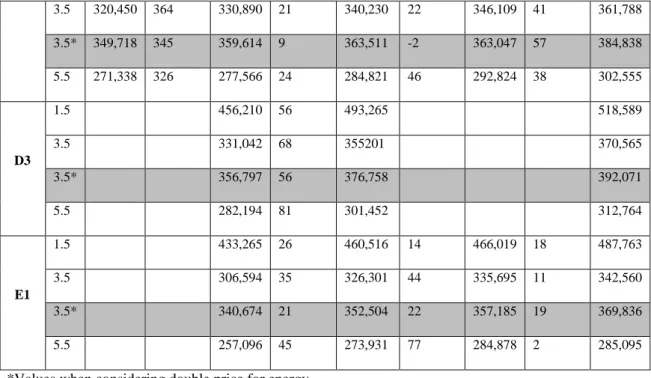
(13) energy efficiency, but new technologies have meant lower costs. Moreover, our study considered not only energy investments, but also construction and maintenance costs. Besides a new scenario was analyzed which contemplated energy prices that doubled those of 2010.. V. Results Table 8 shows the private costs, which are the sum of the construction, maintenance and energy consumption costs, expressed in euros per m2 and per year. For private costs, generally the higher the energy performance level is, the more the private cost becomes. However there were some cases where this did not happen, i.e., in zones C1, C2, D1, D2 and E1, where rate C was slightly more costly than rate B in terms of private costs, and also in climatic zone C4 if we compared rates C and A. This has to do with the energy consumption cost, which sharply dropped in those cases when back-ventilated façades were used. Table 8 also presents the values of annual emissions per m2 in kg CO2 obtained with the Calener-VYP simulator for the house under study. The cells shown in grey indicate the limit values for single-family houses per zone and energy performance level, according to the methodology published by the Spanish Institute for Energy Diversification and Saving (AICIA, 2009), which were used by the Calener-VYP programme to define energy performance levels. These limit values are expressed in kg CO2/m2 per year. As energy performance increased, the amount of CO2 emissions lowered. However, as these limit values depend on climatic area, it was not possible to relate the energy performance level to a specific value for CO2 emissions when considering the whole Spanish territory. Table 9 shows the results of the present-day private costs during the lifespan of the house in each zone and at all the energy performance levels. They were calculated for three different discount rates (1.5%, 3.5% and 5.5%) and for the 2010 prices. Besides a new scenario was added to perform a sensitivity analysis on the energy price, for an interest rate of 3.5%, where the energy consumption cost doubled the current one (2010 prices), in order to see the influence on present-day costs. These values are provided in the grey cells of Table 9. According to these results, the total present-day cost generally increases to improve the private energy performance level, which indicates that increased maintenance and construction costs exceed the reduction in energy costs. For example, for climatic zone B4 and with an interest rate of 3.5%, the lowest private cost corresponded to energy rate E (€289,457) and increased as the energy rate improved to reach the highest cost for energy rate A (€345,469). For current prices, the opposite happened, but only in two cases, although differences were slight. Private costs decreased when comparing energy performances A (€291,788) and B (2€92,897) in climatic zone C1 with an interest rate of 5.5%. A similar trend was also noted when comparing energy rates C (474,381 €) and B (473,415 €) in climatic zone C2 with an interest rate of 1.5%, for which the reduced energy consumption was responsible.. 13.
(14) For the “double price of energy” scenario (the average price of energy was €0.126/kW with minimum and maximum values of 0.112 and 0.158, respectively), present-day private costs increased compared with the 2010 prices scenario. This means that a higher energy price generally favours the promotion of better energy performance levels. Since private costs generally increase as the energy rate improves, it was feasible to suggest a threshold value for CO2 emissions for each zone to make the upgrade of an initial energy rating from ‘i’ to the next highest rating ‘f’ worthwhile. Table 9 also shows these values for CO2, which were calculated according to Equation (2). For the example of e climatic zone B4, mentioned above, they were 191, 80, 61 and €151/tCO2 for changes in energy ratings E-D, D-C, C-B and B-A, respectively. See Figure 1, where zones C1, C2, D1 and D2 are also represented. In this case, the trend for the CO2 values was variable depending on climatic zone. CO2 values and costs depended on the discount rate adopted or the minimum return required. By increasing the discount rate, the NPV lowered, but the influence it would have on the CO2 value was not clear. For the 3.5% adopted discount rate, according to the 2010 energy prices, a lifespan of 100 years and the building solutions and utility facilities available in this study, we obtained an average value of €100/tCO2 by considering an equal weight for each zone. For the double price of energy scenario, the average value was €90/tCO2. The hypothetical carbon price calculated by Equation (2) was also lower when the energy price doubled. For the 1.5% and 5.5% adopted discount rates, the average values were €78/tCO2 and €121/tCO2. We can see that they vary according to climatic zone and to the initial energy rating. On the whole, and after considering all the climatic zones, the values mostly fell within the interval between 0-200 euros per ton and year. However, some values can be considered outliers. By way of example, for the discount rate of 3.5%, the maximum value obtained was €642/tCO2 in zone B3, to improve the rating from B to A. This can be explained because the relation between the construction and operation costs, and the level of CO2 emissions, was not linear. In this case, the slight difference in emissions can be explained because rating B came very close to the upper limit for rating A. The minimum value obtained in zone C1 to improve rating B to A was €8/tCO2. This can be explained by the large difference in emissions as the rating A obtained was well below the upper rating limit. This dispersion of values would be narrower if emissions fell within the intermediate values between the limits defining each energy performance rating. However, this was not possible as these values were conditioned by the building solutions and the actual building materials and facilities adopted. Thus, it was not possible to set the CO2 emission value because it is somewhere between the upper and lower limits.. VI. Conclusions and discussion Recent European and Spanish regulations have aimed to encourage sustainable housing development in Spain. Energy labelling of dwellings permits energy performance ratings to be issued. This means that it is theoretically possible to assign a rating to 14.
(15) each housing construction and to relate it to investment costs and annual operation costs during its lifetime. Thus, the Precost&E study (Universidad Politécnica de Madrid, 2009) estimated the initial investment costs and the annual energy consumption for ratings E to B for a multifamily dwelling in climatic zone D3. This paper analyses in detail the costs for the combinations of the Spanish twelve climatic zones and the five energy performance ratings for new houses (from E to A). In addition to the initial investment costs and annual energy costs employed in the aforementioned Precost&E study, we included annual maintenance costs and renewal or replacement costs, for the 2010 prices, which would be incurred while the dwelling is being used. As in Precost&E, in most cases, the investment costs increased for better energy performances, while the energy costs fell at the same time, which also occurred in our case study for a single-family house. The NPV method was used to estimate the cost deriving from the house during its lifespan, just as the cost-optimal methodology states. This methodology implied estimating costs during the building’s service life, which was always a theoretical assumption, as stated in the hypothesis. The developed model is valid for new and existing buildings. In this study, in real terms, three different discount rates were used to perform a sensitivity analysis: 1.5%, 3.5% and 5.5%. The discount rates were considered in real terms, and the costs (energy, construction materials, salaries, etc.) data were also used in real terms. However, a sensitivity analysis was performed by considering another scenario where energy prices double the 2010 prices (Table 8). In each zone, improving energy ratings generally implied higher initial investments. In contrast, energy costs lowered as energy ratings improved, according to the simulation results using the software Calener-VYP. Better energy performance resulted in increased total private costs in each zone and, therefore, it was concluded that according to the current level of construction costs, maintenance and energy prices, the optimal energy rating from a private perspective was always the lowest (that is D or E). Therefore, the public costs represented by the CO2 emissions released from the using the house has been considered in the NPV and the cost-optimality methodology. As the CO2 emissions prices were lacking, this was a good opportunity to estimate a minimum price for CO2 emissions, which would favour the energy performance level improvement of buildings from the user viewpoint. An order of magnitude for that value was estimated from the single-family house selected as a case study. The CO2 value was monetised from the cost information for actual house development and for updated real prices. Estimating the cost of CO2 values was not only complicated and laborious, but had to be performed for each dwelling, and no general value was produced for all houses in Spain. The CO2 values provided in the case study depended on the zone, the dwelling’s energy rating and the investor’s financial conditions. For the 3.5% adopted discount rate, based on the 2010 energy prices, a 100-year lifespan and the building solutions and utility facilities available in this study, we obtained an average value of €100/tCO2 by considering an equal weight for each zone. For the double price of energy scenario, the average value was €90/tCO2. For the 1.5% and 5.5% adopted discount rates, the average values were €78/tCO2 and €121/tCO2, respectively.. 15.
(16) The long-term analysis entailed a very large number of uncertainties, which were difficult to estimate. Therefore, further research must be done to diminish the aforementioned limitations. Some relevant issues for discussion are: 1. Building typology: the values of costs and CO2 prices are applicable to the type of property analysed, and for the prices currently available on the market and the selected building solutions. This limits its general application. It would be interesting if future works analysed the private and social costs of an apartment building, which is more efficient from an energy standpoint. Moreover, only new buildings were analysed because regulations on existing buildings were still being developed when this study was carried out. 2. Energy performance procedure: analysing the energy performance of a building is. highly complex because there are many influential parameters. It entails a multidisciplinary task, and must bear in mind that many architectural and economic aspects are involved. First of all, more attention should be paid to the design phase of the building. Measures such as orientation, compactness, size, and passive measures such as shading, ventilation, etc., can improve the energy rating of a building at no cost, and would have an impact on the building’s later energy use (Verbruggen, 2012). In Spain, a comparison of the accuracy of the results obtained through simulation has still not been verified, as already done in other European countries (Majcen et al., 2013). Jáber-López et al. Moreover, the effectiveness of the certification scheme in encouraging people to improve the energy performance of their dwellings must also be verified. The results obtained in studies done in other countries vary and are not that optimistic (Gram-Hansen et al., 2007; Amecke, 2012; Popescu et al., 2012; Tuominen et al., 2013). 3. CO2 data: the analysis carried out on CO2 emissions is based on the simulation programme being used in Spain as a result of the transposition of European Directives. This means that only CO2 emissions have been taken into account, which is the main form of emission from buildings, while there are more GHG that are influential on global warming. Furthermore, it has to be pointed out that the results are based on the simulation programme, and not on actual performance. The CO2 cost could be paid through a carbon tax. Currently carbon tax is not applied to Spanish households. However, carbon taxes have existed internationally for almost 20 years and have been used before in different contexts. For example, Finland, Norway, Denmark and Sweden were the pioneers of this tax as they introduced carbon taxes in 1990, 1991, 1992 and 1996, respectively. They have been placed on different sources, depending on the country, and mainly on gasoline, coal and natural gas. The amount to be paid ranges from a maximum in Sweden of $105 per metric ton of CO2 in 1991 to a minimum in California of $0.045 in 1998. The impact of this tax is difficult to determine separately from other factors. Besides there are no common evaluation practices, so it is difficult to compare effectiveness among different countries. For example, emissions lowered by almost 9% in Sweden (1990-2006) and by 15% per capita in Denmark (1990-2005) (Sumner et al., 2009). These values are not specific for the building sector, but are influential on reduced emissions. Carbon tax should be applied according to the particular circumstances of the considered country and the economical context. For example, Dresner and Ekins (2006) 16.
(17) proposed a theoretical targeted carbon tax to be implemented in 10 years time in the United Kingdom. The direct implementation would not be convenient because it would penalise low incomes, which usually correspond to less efficient houses. This scheme consists in a council tax depending on the price of the property and a stamp duty levied at the time of purchasing a property. Besides, compensation mechanisms would be applied so as not to disfavour low-income households (pensioners, households with children). In the building sector, besides the carbon tax, there is a combination of measures that aim to help this sector improve energy efficiency. Updated regulations such as building codes, together with more energy-efficient appliances or other types of measures, e.g., national and local government subsidies, aim to promote energy efficiency. It is difficult to check the effectiveness of every measure independently of the rest. In fact, the only study that we found where such work was done, which examines the effect of carbon taxes specifically on household emissions (Larsen and Nesbakken, 1997), found that CO2 emissions from oil lowered by 3% in 1991-1992. Other market-based measures can be analysed: subsidies, tax on energy consumption or tax exemptions (RodríguezGonzález et al., 2011). Even a combination of measures can be proposed. In fact, in the years after RD 47/07 came into force, aid was available for social housing with energy ratings of A, B and C in national and regional housing programmes. However, the sums offered were rather small and they have been since cut due to the economic recession. 4. Methodology: this analysis was done after considering costs for private investors and social costs. The NPV methodology implies estimating costs during the building’s service life, which is always a theoretical assumption, as stated in the hypothesis. As, CO2 prices are lacking, one way of estimating a possible threshold CO2 value is proposed to promote better energy performances of buildings. Despite the fact that this work was done in 2010, it is partly in line with the cost-optimal methodology that appeared later, in 2012, in Commission Delegated Regulation (EU) No. 244/2012, of 16 January 2012 (Article 2), and in the Guidelines accompanying Commission Delegated Regulation (EU) No. 244/2012, which suggested this methodology for global cost estimation. It establishes a comparative methodology framework for calculating cost-optimal levels of minimum energy performance requirements for buildings and building elements. This methodology permits calculations from two different perspectives: financial and macroeconomic calculation. In this work, the methodology is in line with the macroeconomic perspective, which states that: 1. The global cost calculation must consider: initial investment cost, maintenance cost, replacement cost, energy cost, residual value and CO2 emissions. We have included them all. 2. The NPV methodology must be used. This is the methodology that we have followed. 3. Taxes must be excluded. In this work, taxes and subsides have been excluded, except for electric energy prices, which are calculated according to official rates, which includes the fees for installed power and an electricity tax. 4. At least two different discount rates must be used, expressed in real terms. Three different discount rates, in real terms, have been used in this work.. 17.
(18) According to Article 6, Member States are required to report to the Commission all the input data and assumptions used for calculations and the results of those calculations. The Report on cost optimal calculations and comparison with the current and future energy performance requirements of buildings in Spain, version 1.0, presents the calculations from financial and macroeconomic perspectives. In both cases, a sensitivity analysis has been performed. When calculating from the macroeconomic perspective, two discount rates have been used (3% and 4%). Regarding CO2 prices, Spain has adopted the minimum lower bound, which is the projected ETS carbon prices in the Commission reference scenario up to 2050 (€18.60/ton CO2 during the 2012-2020 period and €56.30/ton CO2 during the 2046-2050 period, which means an average increase of 3% per year). In reference to the energy price, it takes into account the fuel and electricity price development trends as provided by the European Commission on a biannually updated basis. The considered 2012 prices are: biomass is €0.038/kWh and it remains constant in the following years; electricity price is €0.173/kWh and increases about 0.5% per year; and the natural gas price is €0.056/kWh and increases 3.5% per year. These prices are in the same order of magnitude as those used in the study, in both the original energy price scenario (average price of €0.053/kWh) and the double energy price scenario (average price of €0.126/kWh). The remaining considered costs are believed constant (investment and maintenance), which implies excluding general inflation and, besides, the real price increase of the cost components is taken as zero for this work. Despite the sensitivity analysis performed, the report shows that changes in energy and CO2 price development do not generally influence the cost-optimal results that much for financial scenarios. In this work, the CO2 price which makes improving the energy performance rate profitable, as applied to the case study, has been estimated. It is in line with the methodology proposed by Commission Delegated Regulation (EU) No. 244/2012 which suggests using a price for CO2 in the macroeconomic perspective calculation. However, while the Spanish Report takes one value for CO2, applied to the whole of Spanish territory and for all the climatic zones (€18.60/ton CO2 in 2012), the CO2 value in this study has been calculated for each climatic zone and each energy performance. Besides three discount rates and two energy prices have been used in the sensitivity analysis. As a result, 140 values for CO2, which makes it worthwhile increasing the energy performance, have been obtained, which has implied 127 cases of over €18.60/ton.. References: AICIA (2009). Escala de calificación energética. Edificios de nueva construcción. Madrid: Instituto para la Diversificación y Ahorro de la Energía, Ministerio de Industria, Turismo y Comercio. Al-Homoud, M.S. (2005). Performance characteristics and practical applications of common building thermal insulation materials. Building and Environment, 40(3), 353360. Amecke, H. (2012). The impact of energy performances certificates: A survey of German home owners. Energy Policy, 46, 4-14.. 18.
(19) Andaloro, A., Salomone, R., Ioppolo, G. and Andaloro, L. (2010). Energy certification of buildings: A comparative analysis of progress towards implementation in European countries. Energy Policy, 38(10), 5840-5866. Annunziata, E., Frey, M. and Rizzi, F. (2013). Towards nearly zero-energy buildings: The state-of-art of national regulations in Europe. Energy, 57, 125-133. http//dx.doi.org/10.106/j.energy.2012.11.049 Audenaert, A., De Boeck, L. and Roelants, K. (2010). Economic analysis of the profitability of energy-saving architectural measures for the achievement of the EPBDstandard. Energy, 35(7), 2965-2971. Bertrán, A. (2009). Las mediciones en las obras adaptadas al CTE. 4ª Edición. Editorial Jorge Loring S.I. Granada. Brathal, D. and Langemo, M. (2004). Facilities Management: A guide for total workplace design and management. Knight Printing. Grand Forks, North Dakota. Brown, D.W. (1996). Facility Maintenance: The manager’s practical guide and handbook. New York, NY: AMACOM American Management Association. New York, NY 10019 Concerted Action EPBD (2008). Implementation of the Energy Performance of Buildings Directive. Country reports 2008. Brussels: Directorate General for Energy and Transport, European Commission (available at www.epbd.ca.eu and www.buildup.eu ). Concerted Action EPBD (2011). Implementing the Energy Performance of Buildings Directive. Country reports 2011. Brussels: European Union (available at www.epbd.ca.eu and www.buildup.eu). Davies, H. and Wyatt, D. (2004). Appropiate use or method for durability and service life prediction, Building Research and Information, 32(6), 552-553. Dresner, S. and Ekins, P. (2006). Economic Instruments to improve UK Home Energy Efficiency without Negative Social Impacts, Fiscal Studies, 27(1), 47-74. Drury, C. (2008). Management and Cost Accounting, 7th edition. London. Garrido, N., Almecija, J.C., Folch, C. and Martínez, I. (2011). Certificación energética de edificios. Grupo de Estudios de Energía para la Sostenibilidad (CEES). Cátedra Unesco Sostenibilidad, Universitat Politècnica de Catalunya. (Available at: upcommons.upc.edu/e-prints/bitstream/2117/11820/1/GAS Natural_090406.pdf Fraunhofer Institute for Systems and Innovation Research ISI (Germany), (2012). Financing the Energy Efficient Transformation of the Building Sector in the EU. Lessons from the ODYSSEE-MURE project. Gómez, J.M. and Esteban, M.A. (2010). Sostenibilidad en la edificación. Comparación de dos tipologías constructivas. Rendimiento de los recursos. Ingeniería de Edificación Universitat Politècnica de Catalunya. (Available at: upcommons.upc.edu/pfc/bitstream/2099.1/.../1/PFG_Completo.pdf) Gram-Hanssen, K., Bartiaux, F., Michael Jensen, O. and Cantaert, M. (2007). Do homeowners use energy labels? A comparison between Denmark and Belgium. Energy Policy, 35(5), 2879-2888. Instituto de Diversificación y Ahorro de Energía (IDAE), Ministerio de Industria, Turismo y Comercio (MITYC). (2008). Guía Técnica. Procedimientos y aspectos de simulación de instalaciones térmicas en edificios. Madrid. Instituto de Diversificación y Ahorro de Energía (IDAE), Ministerio de Industria, Turismo y Comercio (MITYC), Ministerio de Vivienda. (2009). Calener VYP. Viviendas y edificios terciarios pequeños y medianos. Manual del usuario (available at: http://www.minetur.gob.es/energia/desarrollo/EficienciaEnergetica/CertificacionEnerge tica/ProgramaCalener/CalenerVYP1/Manual_de_usuario.pdf) 19.
(20) Instituto de Diversificación y Ahorro de Energía (IDAE), Ministerio de Industria, Turismo y Comercio (MITYC). (2010). Guía Técnica: Condiciones climáticas exteriores de proyecto, (available at: http://www.minetur.gob.es/energia/desarrollo/eficienciaenergetica/rite/reconocidos/reco nocidos/condicionesclimaticas.pdf) Eurostat European Comission, Instituto de Diversificación y Ahorro de Energía (IDAE), Ministerio de Industria, Energía y Turismo. (2011). Proyecto SECH-SPAHOUSEC. Análisis del consumo energético del sector residencial en España. Informe Final. Madrid. Instituto Eduardo Torroja de Ciencias de la Construcción (IETCC). (2010). Catálogo de Elementos Constructivos del Código Técnico, versión CAT-EC-v06.3-MARZO10, Madrid. Institut de Tecnologia de la Construcció de Catalunya (ITEC). (1991a). Manual de uso y conservación de la vivienda. COAAT Principado de Asturias. Simancas Ediciones S.A. Valladolid. Institut de Tecnologia de la Construcció de Catalunya (ITEC). (1991b). Manteniment de l’edifici. Fitxes. 1ª Edición. Gràfiques Pacífic. Badalona, Barcelona. Institut de Tecnologia de la Construcció de Catalunya (ITEC). (1991c). Manteniment instal.lacions. Fitxes. 1ª Edición. Gràfiques Pacífic. Badalona, Barcelona. Institut de Tecnologia de la Construcció de Catalunya (ITEC). (1991d). Manteniment urbanització. Fitxes.1ª Edición. Gràfiques Pacífic. Badalona, Barcelona. Institut de Tecnologia de la Construcció de Catalunya (ITEC). (1994). L’actualitat i el cost del manteniment en edificis d’habitatge. Guia pràctic”. 1ª Edición. Gama S.L. Servicios editoriales. Barcelona. Institut de Tecnologia de la Construcció de Catalunya (ITEC). (1996). Ús i manteniment de l’habitatge. Quadern de l’usuari. 1ª Edición, Gràfiques Cometa. Zaragoza. Institut de Tecnologia de la Construcció de Catalunya (ITEC). (1997). La vivienda: manual de uso y mantenimient, COAAT de Cantabria. 1ª Edición. Institut de Tecnologia de la Construcció de Catalunya (ITEC). (1999). La vivienda: manual de uso y mantenimiento, COAAT Principado de Asturias. 2ª Edición. Simancas Edicionas S.A. Valladolid. Jáber-López, J.T., Valencia-Salazar, I., Peñalvo-López, E., Álvarez-Bel C., RiveraLópez, R. and Merino-Hernández, E. (2011). Are energy certification tools for buildings effective? A Spanish case study, Proceedings of the 2011 3rd International Youth Conference on Energetics. Leiria, July 7-9. Johnstone, I.M. (2001a). Energy and mass flows of housing: a model and example, Building and Environment, 36, 27-41. Johnstone, I.M. (2001b). Energy and mass flows of housing: estimating mortality, Building and Environment, 36, 43-51. Kaiser, H.H. (2001). The Facilities Audit. A process for improving facilities conditions. Kirby Lithographic. APPA. The Association of Higher Education Facilities Officers, Arlington VA. Larsen, B.M. and Nebakken, R. (1997). Norwegian emissions of CO2 1987-1994, Environmental and Resource Economics, 9, 275-290. Laustsen, J. (2008). Energy efficiency requirements in building codes, energy efficiency policies for new buildings. International Energy Agency information paper. Paris. La Roche, P. (2010). Calculating green house emissions for houses: analysis of the performance of several carbon counting tools in different climates, Informes de la Construcción, 62(517), 61-80.. 20.
(21) Linares, P. and Labandeira, X. (2010). Energy efficiency: Economics and Policy, Journal of Economic Surveys, 24(3), 573-592. Liska, R.W. (2000). Means Facilities Maintenance Standards. R.S. Means Company, Inc. Construction Publishers & Consultants, Kingston, MA. Majcen, D., Itard, H. and Visscher, H. (2013). Theoretical vs. actual energy consumption of labelled dwellings in the Netherlands: Discrepancies and policy implications, Energy Policy, 54, 125-136. Mercader, M.P., Olivares, M. and Ramírez de Arellano, A. (2012). Modelo de cuantificación del consumo energético en edificación. Informes de la Construcción, 62(308), 567-582. Ministry of Development of Spain. Directorate for Architecture, Housing and Planning. Report on cost optimal calculations and comparison with the current and future energy performance requirements of buildings in Spain. Version 1.1, 7th June 2013. Pérez, F., Rubio de Hita, P., Ordoñez, M., Morales, M.J. and Rodríguez C. (2013). Sustainable restoration of traditional building systems in the historical center of Sevilla (Spain), Energy and Buildings, 62, 648-659. Pérez-Lombard, L., Ortiz, J. and González, R. (2009). A review of benmarching, rating and labelling concepts within the framework of building energy certification schemes, Energy and Buildings, 41(3), 272-278. Piper, J.E. (1995). Handbook of Facility Management: Tools and Techniques, formulas and tables. Prentice Hall Inc., Upper Saddle River, NJ. Popescu, D., Bienert, S., Schützenhofer, C. and Boazu, R. (2012). Impact of energy efficiency measures on the economic value of buildings. Applied Energy, 89(1), 454463. Ramírez de Arellano, A. (2004). Presupuestación de obras. 3ª ed. Universidad de Sevilla. Secretariado de Publicaciones. Colección Manuales Universitarios, 37. Rodríguez-González, A.B., Vinagre-Díaz, J.J., Caañamo, A.J. and Wilby, M.R. (2011). Energy and Buildings, 43(4), 980-987. Ruá, M.J. and Guadalajara, N. (2014). Using the building energy rating software for mathematically modelling operation costs in a simulated home, International Journal of Computer Mathematics, doi: 10.1080/00207160.2014.892588. Ruá, M.J. and Guadalajara, N. (2013). Application of Compromise Programming to a semi-detached housing development in order to balance economic and environmental criteria, Journal of the Operational Research Society, 64, 459-468. Ruá, M.J. and López-Mesa, B. (2012). Certificación energética de edificios en España y sus implicaciones económicas, Informes de la Construcción, 64(527), 307-318. Rudbeck, C. (2002), Service life of building envelope components: making it operational in economical assessment, Construction and Building Materials, 16(2), 8389. Ruiz, M.C. and Romero, E. (2011). Energy saving in the conventional design of a Spanish house using thermal simulation. Energy and Building, 43(11), 3226-3235. Sanstad A.H., Blumstein, C. and Stoff, S.E. (1995). How high are option values in energy-efficiency investments?. Energy Policy, 23(9), 739-743. Sumner J., Bird L. and Smith H. (2009). Carbon Taxes: A review of Experience and Policy Design Consideration. Technical Report NREL/TP-6A2-47312. National Renewable Energy Laboratory. US Department of Energy. Universidad Politécnica De Madrid. Departamento de Construcción y Vías Rurales (2009). Evaluación de los costes constructivos y consumos energéticos derivados de la calificación energética de viviendas. Precost&E. Fase1.. 21.
(22) Tuominen, P., Forsström, J. and Honkatukia, J. (2013). Economic effects of energy efficiency improvements in the Finnish building stock. Energy Policy, 52, 181-189. Ucar, A. and Balo, F. (2009). Effect of fuel type on the optimum thickness of selected insulation materials for the four different climatic regions of Turkey. Applied Energy, 86(5), 730-736. Uzsilaityte, L. and Martinaitis, V. (2010). Search for optimal solution of public building renovation in terms of life cycle. Journal of Environmental Engineering and Landscape Management, 18(2), 102-110. Verbruggen, A. (2012). Financial appraisal of efficiency investments: why the good may be the worst enemy of the best. Energy Efficiency, 5, 571-582. Legislative references Commission Delegated Regulation (EU) No 244/2012 of 16 January 2012 supplementing Directive 2010/21/EU of the European Parliament and of the Council on the energy performance of buildings by establishing a comparative methodology framework for calculating cost-optimal levels of minimum energy performance requirements for buildings and buildings elements. Decree 35/01 of 9 March: measures governing the use and maintenance of building in the Balearic Islands. Decree 38/2004 of 2 July: regulations for the Building Book in La Rioja. Decree 158/1997 of 8 July: regulations for the Building Book of existing housing and creating a program for the conservation of buildings in Catalonia. Regional Decree 322/2000 of 2 October: Building Book regulations in Navarre. Decree 349/1999 of 30 December: Building Book regulations. Directive 2002/91/EC of 16 December 2002: Energy efficiency in buildings. 2010/31/UE Directive of the European Parliament and the Council of 19 May 2010 on energy efficiency in buildings. Decree 14/02/02 approving the Building Book in Murcia. ECO/805/2003 Order of 27 March on valuation of property and financial regulations. European Commission. Guidelines accompanying Commission Delegated Regulation (EU) No 244/2012 of 16 January 2012 supplementing Directive 2010/21/EU of the European Parliament and of the Council on the energy performance of buildings by establishing a comparative methodology framework for calculating cost-optimal levels of minimum energy performance requirements for buildings and buildings elements. International Valuation Standards (IVS) 2011, IVS 230 Royal Decree 1777/2004 of 30 July: approving income tax regulations. Royal Decree 314/2006 of 19 October: approving the technical building code. Royal Decree 47/2007 of 19 January: basic procedure for certification of energy efficiency in new buildings. Royal Decree 1027/2007 of 20 July: Regulation of thermal installations in buildings. Royal Decree 235/2013 of 5 April: basic procedure for certification of energy efficiency in buildings.. 22.
(23) TABLE 1 Climatic zones and representative cities. Climatic data: HDD and CDD (based on a temperature of 20ºC) and average temperatures in January and August (ºC) WINTER SEVERITY Min. SUMMER SEVERITY. Min. A. Max B. C. D. E. D1 Pamplona 2,907/301 5.4/21.1 D2 Logroño 2,658/389 5.9/22.2 D3 Madrid 2,597/646 5.2/25.1. E1 Burgos 3,360/233 3.0/19.2. B3 Castellón 1,463/695 10.6/26.0 B4 Seville 1,092/863 10.8/27.9. C1 Santander 1,999/86 10.6/20.3 C2 Barcelona 1,666/299 8.4/23.7 C3 Granada 2,387/725 5.8/25.1 C4 Badajoz 1,897/779 8.1/26.0. 1. 2. Max. 3. 4. A3 Málaga 1,217/697 12.0/26.0 A4 Almería 1,122/690 12.3/25.6. Source: The authors’ own from CTE and Technical Guide “Condiciones climáticas exteriores de proyecto”, by the IDAE. TABLE 2 Geometrical characteristics of the case study Area (m2) Ground level First floor Façade. 63.02. 53.98. Windows. 20.41. 16.20. Party wall. 25.00. 22.45. Roof. 76.43. 23.
(24) TABLE 3 Input and output data from Lider and Calener VYP INPUT DATA. OUTPUT DATA. LIDER Climatic zone. For the building and for the different rooms modelled:. Orientation Fulfilling or not the CTE requirements Building typology: Dwellings, selecting singlefamily or apartment buildings or Commercial Buildings Use intensity: Residential Commercial (low, medium, high use and select 8, 12, 16 or 24 h occupancy) Hygrometric class: 3 (HR 55%, T 20ºC): dwellings 4 (HR 62%, T 20ºC): restaurants, sport centres 5 (HR 70%, T 20ºC): swimming pool, laundry (Section 3.1.2 DB-CTE-HE-1). Air renovation: m3air/hour (calculated according to DB-CTE-HS-3 CTE). Constructive technical solutions for the thermal envelope: thickness of layers (m), conductivity (W/mK) thermal resistance (m2K/W), etc. Geometry of the building: definition of shape, areas, windows and doors location in the envelope, etc. CALENER VYP DHW demand: according to the CTE-HE4. Label with energy performance:. Contribution of thermal solar energy to domestic hot water (DHW): calculated according to CTEHE4. A, B, C, D or E. Heating and air conditioning demand (kWh/m2 and kWh/year). Final consumption (total and split in heating, air conditioning and DHW) (kWh/m2 and kWh/year). Primary energy consumption (total and split in heating, air conditioning and DHW) (kWh/m2 and kWh/year). CO2 emissions (total and split in heating, air. Heating and air conditioning facilities definition: type of energy, boiler type, air conditioning equipment characteristics, etc.. 24.
(25) conditioning kWh/year).. and. DHW). (kWh/m2. and. TABLE 4 Budget items considered in the estimates for investment and maintenance costs Budget items Investment tasks. Maintenance Tasks. 1- Groundwork. 1- Drainage. 2- Drainage. 2- Walls and floor in contact with soil. 3- Foundations. 3- Façades. 4- Structure. 4- Carpentry. 5- Walls and partitions. 5- Garage door maintenance. 6- Roofing. 6- Blinds. 7- Carpentry. 7- Glass works. 8- Iron works. 8- Lattice walls. 9- Glass works. 9- Audio-visual equipment. 10- Flooring and ceiling works. 10- DHW and heating. 11- Plumbing. 11- Air conditioning system. 11- Electrics and audio-visuals. 12- Solar energy system. 12- Solar energy. 13- Electrics. 13- Air conditioning and heating. 14- Plumbing. 14- Ventilation system. 15- Specific natural gas revisions. 15- Painting. 16- Ventilation system. 16- Quality control. 17- Roofing. 17- Protection against fire. 18- Flooring. Painting works. 18- Safety and health. 19- Protection against fire. 25.
Figure
Documento similar
Figure 1 shows the weights given to the four comfort domains by the main Building Performance Certification Programs: LEED sets 47% of credits for IAQ and 35% for lighting
The general idea of the language is to “thread together,” so to speak, existing systems that parse and analyze single web pages into a navigation procedure spanning several pages of
We argue that this approach has significantly higher potential for runtime- and energy savings than the previously proposed strategies for three reasons: (1) since the performance
Electricity is a major cost factor in the production of chlorine, and the chlorine industry accounts for about 1 % of the total European energy consumption of 3,319 TWh with
A model for analysis is therefore proposed (Figure 1) to study the financial performance from a two-fold perspective in relation to cost saving and financial resources allocated
K) is the Banach space of continuous functions from Vq to K , equipped with the supremum norm.. be a finite or infinite sequence of elements
No obstante, como esta enfermedad afecta a cada persona de manera diferente, no todas las opciones de cuidado y tratamiento pueden ser apropiadas para cada individuo.. La forma
The program is based on the following pillars: (a) students become the main agents of their learning by constructing their own knowledge; (b) the teacher must be the guide to
