Socio economic determinants and inequalities in childhood malnutrition in Sri Lanka
24
0
0
Texto completo
(2)
(3) WELL-BEING AND SOCIAL POLICY VOL. 8, NUMBER 1, pp. 1-22. SOCIO-ECONOMIC DETERMINANTS AND INEQUALITIES IN CHILDHOOD MALNUTRITION IN SRI LANKA Priyanka Jayawardena* Institute of Policy Studies of Sri Lanka [email protected]. Abstract espite countless initiatives to alleviate malnutrition over the years, it affects hundreds of thousands of children in Sri Lanka. Understanding the determinants of malnutrition and their contribution to socio-economic inequality in malnutrition is essential in targeting specific socio-economic groups to improve their nutrition levels. This study attempts to identify the socio-economic determinants and their contribution to the socio-economic inequality in childhood malnutrition, which is vitally important in reducing the disproportional burden of childhood malnutrition in Sri Lanka. The study uses the nationally representative Demographic and Health Survey (DHS) conducted in 2006/07. Decomposition analysis is carried out to measure socio-economic related inequality in childhood malnutrition as well as low weight births. Socio-economic status was measured using principal component analysis. Continuity of life cycle of malnutrition and intergenerational transmission are major causes of continuation of childhood malnutrition among lower socio-economic groups.. D. Keywords: malnutrition, socio-economic inequality, child health, decomposition. JEL Classification: I12, I32, D31, D63.. Introduction. S. ri Lanka’s overall health indicators are on track to achieve the 2015 Millennium Development Goals (MDGs). Compared to other developing countries, infant and maternal mortality rates are markedly low in Sri Lanka. Almost all children are vaccinated at the right time and the life expectancy1 of its population is considerably higher than that of populations in other developing countries. However, malnutrition continues to be a serious health concern in Sri Lanka. More than one in five under-five year olds are underweight in the country, and nearly one in six babies born have low birth weight. These numbers are worse for some population groups in the country. For. * This study was carried out as a partial fulfillment of the requirements for the degree of Masters in Economics in the University of Colombo. I would like to express my sincere gratitude to my supervisor Professor. (Mrs.) Amala de Silva, Department of Economics, University of Colombo, Sri Lanka for her conscientious guidance and invaluable support provided throughout this dissertation to fulfill this task. 1 As of 2011, life expectancy is 74.9.. 1.
(4) SOCIO-ECONOMIC DETERMINANTS AND INEQUALITIES IN CHILDHOOD MALNUTRITION IN SRI LANKA. example, children in the estate sector2 are twice as likely to be underweight than children in the urban sector, and in Nuwara-Eliya3 district, 41% of children are stunted. Despite countless initiatives to alleviate malnutrition over the years, child nutritional levels have improved only marginally in the country (see Table 1). Table 1 Percentage of Under Five Year Old Malnourished Children. Nutritional measure. 2000. 2006. Stunted. 18.5. 17.4. Underweight. 23.0. 21.4. Wasted. 15.5. 15.1. Low birth weight. 16.7. 16.6. Source: Constructed using DHS-2000 and DHS-2006/07 survey data.. Nutritional issues are an integral part of the whole development process. Poor nutrition and health will, in the long run, result in a poorly educated and unhealthy population, which will act as a drag on economic growth and development of the country. As Sri Lanka aims to set itself on a high growth trajectory, this is no doubt a cause for concern as it impacts on the quality of the country’s workforce. Malnutrition is a multi-faceted problem. Mother’s nutritional status affects the unborn child, and a low birth weight child would show a higher vulnerability to ill health, and retarded mental and physical growth, and tends to become an anemic adult (World Bank 1994). Hence the vicious cycle of malnutrition is formed. There is recognition that improved health care alone cannot improve all health outcomes. This is because there are deep-rooted socio-economic factors affecting health. For example, a child’s nutritional status in life as well as a child’s birth weight is determined by a number of factors, such as genetics, maternal characteristics, the environment in which a child lives, and social circumstances. Nutritional disparities themselves are also driven by so-called social and economic determinants, such as income level, mother’s education, and living conditions in homes and neighborhoods. Therefore, when aiming at reducing malnutrition it is important to focus not only on averages, which can blur socio-economic inequalities. To combat malnutrition, policies relating to the improvement of household socio-economic status and safe environment among the less privileged has a major role to play. However, there have been very few studies done in Sri Lanka to investigate the socio-economic problems of malnutrition, particularly in tracing the determinants of childhood malnutrition, and most of these studies have focused only on the mean effects of these determinants. Aturupane et al. (2008) have drawn attention to analyze the socio-economic determinants of child nutrition at different points. 2. The three sectors popularly used in Sri Lanka are urban, rural, and estate. The Department of Census and Statistics defines the estate sector as plantation areas having more than 20 acres (8 hectares) and more than 10 residential laborers under a single administration. 3 District in Central Province.. 2.
(5) WELL-BEING AND SOCIAL POLICY VOL. 8, NUMBER 1, pp. 1-22. of the conditional distribution of child nutrition using a quantile regression. It is important to note that according to their findings, ordinary least squares (OLS) mean effects can be misleading in predicting the effects of determinants at the lower end of the distribution of malnutrition. However, it is not clear how much each of these determinants contribute to the disproportionate burden of malnutrition. Understanding the determinants and their contribution to socio-economic inequality in malnutrition is essential in targeting specific socio-economic groups to improve their nutrition levels. This study investigates the socio-economic determinants and their contribution to the socioeconomic inequality in childhood malnutrition as well as low weight births. The study attempts to contribute to the debate on priority areas to be addressed in reducing malnutrition especially in severely affected populations. Demographic and Health Survey (DHS) -2006/07 is used as the primary source of data. The research adopts econometric techniques to identify the determinants of malnutrition and recently suggested methodologies such as decomposition analysis to measure socio-economic related inequality in childhood malnutrition.. 1. Literature Review Malnutrition is not a disease that runs its course, bringing immunity. Rather it is a process, with consequences that may extend not only into later life, but also into future generations (Gillespie and Flores 2000). Observational research and intervention studies show that the foundations of adult health are laid in early childhood and even before birth. The process of becoming malnourished often starts in utero and may last, particularly for girls and women, throughout the life cycle. It also spans generations. Poor circumstances during pregnancy can lead to less than optimal foetal development via a chain that may include deficiencies in nutrition during pregnancy, maternal stress, a greater likelihood of maternal smoking and misuse of drugs and alcohol, insufficient exercise, and inadequate pre-natal care (WHO 2003). According to Gillespie and Flores (2000), inadequate diet in youth and adolescence can lead to anemia or stunting which contribute to complications in childbirth and underweight babies. A stunted4 girl is likely to become a stunted adolescent and later a stunted woman. Besides posing threats to her own health and productivity, poor nutrition that contributes to stunting and underweight in her adult life increases the chances that her children will be born malnourished. Poor fetal development is a risk for health in later life. Maternal iron deficiency anemia is a known risk factor for the newborn. And so the cycle continues. Children of malnourished mothers are born often prematurely and often with low birth weight, are disadvantaged from birth, fail to grow normally, and face a higher risk of disease and premature death. The causes of malnutrition are complex, multi-dimensional, and interrelated. They range from factors as broad in their impact as political instability and slow economic growth to those immediate determinants of child nutritional status. The immediate determinants of child nutritional status manifest themselves at the level of the individual human being. They are dietary intake (energy, 4. Height is significantly low for age.. 3.
(6) SOCIO-ECONOMIC DETERMINANTS AND INEQUALITIES IN CHILDHOOD MALNUTRITION IN SRI LANKA. protein, fat, and micro nutrients) and health status. These factors themselves are interdependent (Smith and Haddad 2003). These conditions, in turn, are closely linked to the overall standard of living and whether a population can meet its basic needs, such as access to food, housing and health care. Assessment of malnutrition rates thus not only serve as a means for evaluating the health and nutritional status of children but also provides an indirect measurement of the quality of life of an entire population (de Onis and Blossner 1997). Malnutrition is frequently part of a vicious cycle that includes poverty and disease. These three factors are interlinked in such a way that each contributes to the presence and permanence of the others. Socio-economic and political changes that improve health and nutrition can break the cycle; as can specific nutrition and health interventions (de Onis and Blossner 1997). In general, more income leads to better nutrition. Increased income usually enables poor families to get better access to the things that matter for good nutrition: food of sufficient quantity and quality, enough time for others to get and use good information on child feeding and hygiene, adequate supplies of clean water, and sufficient preventive and curative health care of good quality. Though the relationship between poverty and malnutrition is potentially strong, if families do not spend their increased income on the factors that determine good nutrition —better food, care, and health— then malnutrition is unlikely to decrease. For example, if extra income does nothing to empower women, then nutrition levels may not improve (Haddad and Alderman 2000). Here the relationship between women’s status and child nutritional status are discussed with special emphasis on care for children and children’s birth weight. Women are the key actors in generating good nutrition and household food security. They have the greatest potential to make decisions that positively affect child survival. However, the position and status of women strongly influence their ability to make decisions to realize that potential. Women’s position and status is formed around a series of cultural and economic factors. The status and position of women is reflected by their ability to take decisions in the spending of household income, the quantity and quality of child care they are able to provide, and in health-seeking behaviors (Haddad 1999). As explained in Smith et al. (2000), women’s status affects the quality of care for children not only in a direct manner, but also indirectly through the quality of the care women themselves receive. Finally, via the medium of women’s own health and nutritional status, the care women receive influences both the quality of care for children and their birth weights. Poor women are likely to be poorly nourished, which has serious implications for the nutrition status of their yet-tobe born children, and the birth weight of newly born children. Adult female under-nutrition also constrains the ability of women to earn income, which tends to impair the nutrition status of their children. In terms of underlying factors, women’s control of income is a key promoter of household food security and nutrition (Haddad 1999). Women with more control over resources are also in a better position to provide care to children and achieve better birth weights. Six practices of child care are crucial for their nutritional well-being : (i) care for women, such as providing appropriate rest time or increased food intake during pregnancy; (ii) breastfeeding and feeding of young children; (iii) psychosocial stimulation of children and support for their development; (iv) food preparation and food storage practices;. 4.
(7) WELL-BEING AND SOCIAL POLICY VOL. 8, NUMBER 1, pp. 1-22. (v) hygiene practices; and (vi) care for children during illness, including diagnosis of illness, seeking care, and home treatment (Engle, Menon, and Haddad 1999).. 2. Data The study uses micro data from the Demographic and Health Survey (DHS) - 2006/07 conducted by the Department of Census and Statistics of Sri Lanka. A nationally representative sample of 14,692 married women aged 15-49 years, in 19,862 households are included in the survey. Due to the unsettled conditions prevailed in the country at the time of the survey, the DHS-2006/07 survey has not covered the Northern Province. The DHS collected demographic, socio-economic and health data from married women aged 15-49 and their children under five years. The sample of children for this research was chosen based on the complete and plausible information available and anthropometric data, as well as other independent variables, including characteristics of their mothers and household socioeconomic status. Children with missing data for any of the independent variables controlled for in the regression analysis were excluded. The sample analyzed for this study includes 5,679 children, under five years of age to investigate childhood malnutrition.. 3. Methodology 3.1 Measuring malnutrition This study focuses on childhood malnutrition in the context of Protein-Energy Malnutrition (PEM), which signifies the imbalance between the supply of protein and energy and the body’s demand for them to ensure optimal growth and function (de Onis and Blossner 1997). Three anthropometric measures are standardized according to the international standards and z-scores5 are created using growth standards published by WHO in 2006 (WHO 2007). Anthropometric indicators are constructed based upon anthropometric software, that is currently being made available by the WHO. A child is classified as “stunted” if the child’s height-for-age z-score is below more than two standard deviations from the median of the reference population, “wasted” if the child’s weight for height z-score is below more than two standard deviations from the international reference population and a child is considered as “underweight” if child’s weight for age z-score is less than two standard deviations from the international reference population (WHO 2006). Low birth weight is defined as a birth weight of less than 2500 g. The study considered the birth weight as recorded in the Child Health Record (CHR). A tool of Body Mass Index (BMI) classification is employed for identifying the mother’s nutritional status.. 5. Z-score (or SD-score) = observed value - median value of the reference population standard deviation value of reference population. 5.
(8) SOCIO-ECONOMIC DETERMINANTS AND INEQUALITIES IN CHILDHOOD MALNUTRITION IN SRI LANKA. 3.2 Measure of socio-economic status The DHS surveys do not provide consumption or income data but do have detailed information on household ownership and access to a variety of consumer goods and services. The questionnaire includes questions, concerning the household’s ownership of a number of consumer items ranging from a fan to a television and car; dwelling characteristics such as flooring material; type of sanitary facilities, drinking water source and toilet facilities used; and other characteristics that are related to household socio-economic status. Recent research suggests that the asset approach is a reasonably satisfactory proxy for consumption (Filmer and Pritchett 1998; Wagstaff et al. 1991). Thus, an asset approach is used throughout this study as a proxy for the standard of living of the household. To construct the asset index, each household asset was assigned a weight or factor score generated through a principal components analysis. Typically, asset index is assumed to be the first principal component; that is, the first linear combination (Gwatkin et al. 2000). These scores were summed up for each household and the asset index, Ai, for household i is defined as follows:. ( ( Ai = å fk a iks a k k k. where aik is the value of asset k for household i, a k is the sample mean and sk is the sample standard deviation. fk is the weights associated with the first principal component. Individuals were ranked according to the total score of the household in which they resided. The sample was then divided into population quintiles.. 3.3 Measurement of inequality Concentration Index (CI) is used to illustrate the existing gaps of malnutrition level among different socio-economic groups. CI is defined as twice the area between the concentration curve and the line of equality (the 45º line).. CI = m2 cov (hi , ri ) Where hi refers to the nutritional measure of the ith individual and ri is its respective fractional rank in terms of the index of household socio-economic status; µ is the mean of the nutritional measure and cov denotes the covariance. The value of the CI can vary from -1 to + 1. Negative values imply that malnutrition is more concentrated among disadvantaged children while the opposite is true for its positive values. When there is no inequality, the CI will be zero (O’Donnell et al. 2008).. 6.
(9) WELL-BEING AND SOCIAL POLICY VOL. 8, NUMBER 1, pp. 1-22. 3.4 Decomposition of the Concentration Index (CI) Measurement and explanation of inequality in nutritional status across the entire distribution of socio-economic status would be preferable. Such inequality can be explained through decomposition of the CI. CI can be decomposed into the contributions of individual factors to socio-economic related inequality. Each contribution is the product of the sensitivity with respect to that factor and the degree of income-related inequality in that factor (O’Donnell et al. 2008; Wagstaff et al. 2003). For any linear additive regression, model Y is used, such as Y= a +å b k X k + e k. The CI of Y can be written as CI=å (bk X k / m( Ck+GCe / m k. Where µ is the mean of Y, X k is the mean of X k , Ck is the concentration index for Xk, and GCe is the generalized concentration index for the error term ( e). As shown in the second equation, C is equal to a weighted sum of the concentration indices of the k regressors, where the weight for Xk is the elasticity of Y with respect to Xk. The elasticity, CI with respect to each factor and total contribution of each factor to the CI are derived from above equations. In the case of non-linear, model such as Yi = G (am + å bj x ji ) + Ui j. is used where Y, may be binary or a count, x factor variables and G will take particular forms for the probit, logit, etc. Then the decomposition is possible only if some linear approximation to the non-linear model is made. Using approximate using estimates of the partial effects evaluated at the means gives Yi = am + å bjm xji + Ui j. where the b m are the partial effects, dy/dxj of each variable treated as fixed parameters and evaluated at sample means; and Ui is the implied error term. The concentration index for Y can be written as m CI = å b j Xji Cj + GCu / m j. 7.
(10) SOCIO-ECONOMIC DETERMINANTS AND INEQUALITIES IN CHILDHOOD MALNUTRITION IN SRI LANKA. 3.5 Methodology application to Sri Lanka DHS data As the criteria of measuring long-term and short-term childhood nutritional status, the most commonly used anthropometric indices height-for-age and weight-for-height are examined, respectively. Childhood long-term versus short-term nutritional status is investigated applying linear additive regression model. Child nutritional measures (height-for-age z-score and weightfor-height z-score) are specified to be a linear function of child characteristics, maternal characteristics and household level characteristics. Then, nutritional measure’s concentration index is decomposed into the contribution of each determinant. 3.5.1 Dependent variables In the regression models, the negative of the z-score is used as dependent variable as it conveys information on depth of malnutrition. Therefore, child malnutrition is constructed by the negative of the z-score, such that a greater value indicates more malnourishment. Since children with negative z-score represents the better off than the reference population, negative z-scores are changed into zero (O’Donnell et al. 2008 and Van de Poel et al. 2007). Also it facilitates the interpretation of coefficients, with positive value meaning increasing malnutrition. Also, the study focuses on the underlying determinants of low weight births, which is itself a key underlying determinant of childhood nutritional status. In this analysis low birth weight babies is measured as a binary variable taking the value 1 or 0. In estimating correlates of a discrete (binary) state of low weight births, the analysis is carried out using a Linear Probability Model (LPM). For non-linear models, decomposition analysis is possible only if linear approximation is made to the non-linear model. Thus, partial effects are evaluated at sample means to make linear approximation. Then decomposition analysis is carried out using these partial effects. 3.5.2 Explanatory variables Explanatory variables are employed to identify the role of underlying determinants —food insecurity, inadequate maternal and child care practices, and poor health environment and services as well as the variables representing some of the basic causes such as economic and social factors. The selection of the variables was based on the relevance to the study’s research question as well as data availability. Food insecurity There is no direct variable to measure household food insecurity. The proximal determinants are closely associated with household food insecurity: whether the mother engages in an economic activity, the number of people in the household and the number of children between 0 and 5 are used as proxy measures.. 8.
(11) WELL-BEING AND SOCIAL POLICY VOL. 8, NUMBER 1, pp. 1-22. Household socio-economic status Household wealth index was used as the measure of living standards. Health environment and services Improving water quantity and quality reduces the incidence of various water related diseases, including diarrhea. To represent health environment and services, access to safe water and sanitary facilities are chosen as explanatory variables. Safe water is defined as a household with reasonable access to water that is either treated surface water or water that is untreated but uncontaminated (such as from sanitary wells). Safe sanitary facility is defined as having water sealed toilet facilities. Mothers’ education and knowledge The household decisions made in this area are influenced by women’s knowledge regarding the nutritional benefits of different food and their ability to direct household resources toward food for home consumption (Engle, Menon, and Haddad 1999). Thus, the effect of women’s education and relative status of child malnutrition will partially reflect the influences of food security as well as mother and child care. To measure mothers’ education and knowledge, the variables mother’s level of education and whether mother reads the newspapers regularly are used in this study. Mothers’ nutritional and health status Mother’s education and knowledge also influence mother’s health and nutritional status. Mother’s nutritional status is measured using mother’s height (in cm) and mother being underweight (BMI). Mother’s age at first child’s birth Past studies ACC/SCN (1992), show that adolescent girls are not physically prepared for childbirth, since linear growth is not complete until age 18 and the birth canal does not reach its mature size until two to three years later. As a result of early childbearing, their children face a higher risk of low birth weight. Child characteristics To distinguish the broader determinants of child a nutritional status characteristics such as the child’s age, sex, birth order of the child, low weight birth and child’s health status. Region Geopolitical region of residence are employed as independent variables in the explanatory analyses. Table 2 shows the descriptive statistics of child nutritional measures and all the explanatory variables with respect to DHS, 2006/07 data.. 9.
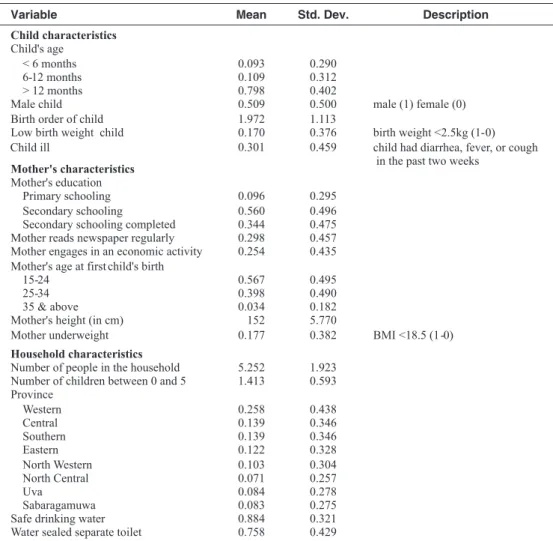
(12) SOCIO-ECONOMIC DETERMINANTS AND INEQUALITIES IN CHILDHOOD MALNUTRITION IN SRI LANKA. Table 2 Summary Statistics Variable. Mean. Std. Dev.. Child characteristics Child's age < 6 months 6-12 months > 12 months Male child Birth order of child Low birth weight child Child ill. 0.093 0.109 0.798 0.509 1.972 0.170 0.301. 0.290 0.312 0.402 0.500 1.113 0.376 0.459. 0.096 0.560 0.344 0.298 0.254. 0.295 0.496 0.475 0.457 0.435. 0.567 0.398 0.034 152 0.177. 0.495 0.490 0.182 5.770 0.382. 5.252 1.413. 1.923 0.593. 0.258 0.139 0.139 0.122 0.103 0.071 0.084 0.083 0.884 0.758. 0.438 0.346 0.346 0.328 0.304 0.257 0.278 0.275 0.321 0.429. Mother's characteristics Mother's education Primary schooling Secondary schooling Secondary schooling completed Mother reads newspaper regularly Mother engages in an economic activity Mother's age at first child's birth 15-24 25-34 35 & above Mother's height (in cm) Mother underweight Household characteristics Number of people in the household Number of children between 0 and 5 Province Western Central Southern Eastern North Western North Central Uva Sabaragamuwa Safe drinking water Water sealed separate toilet. Description. male (1) female (0) birth weight <2.5kg (1-0) child had diarrhea, fever, or cough in the past two weeks. BMI <18.5 (1-0). Source: Constructed based on DHS 2006/07 survey data.. 4. Results 4.1 Disproportionate burden of child malnutrition There are considerable disparities in child nutrition across socio-economic groups that favor the better-off. A child belonging to the “poorest” socio-economic quintile is three times more likely to be stunted and underweight than a child in the richest quintile (see Figure 1).. 10.
(13) WELL-BEING AND SOCIAL POLICY VOL. 8, NUMBER 1, pp. 1-22. Figure 1 Prevalence of Stunting, Underweight and Wasting by Wealth Quintile 35.0 30.0. % of children. 25.0 20.0 15.0 10.0 5.0 poorest. poor. middle. rich. richest. quintile Stunting. Underweight. Wasting. Source : Author’s calculations based on 2006/07 DHS survey data.. Descriptive analysis is carried out using binary indicators of stunted, wasted, underweight and low weight births. Table 3 shows the means and concentration indices of each considered anthropometric measure. Estate sector shows the higher prevalence of child malnutrition compared to country’s average figures. For instance, in the estate sector about 40% of under five year old children are stunted, 30% are underweight. Further nearly one in three babies born have low birth weight (see Table 3). Table 3 Prevalence of Child Malnutrition and Socio-economic Inequalities in Child Malnutrition. Stunted. Wasted. Underweight. Low weight births mean. CI. 0.21 (.006) -0.17. 0.16 (.005). -0.13. 0.14 (.011) -0.19. 0.17 (.012) -0.25. 0.13 (.011). -0.08. -0.21. 0.15 (.006) -0.07. 0.21 (.007) -0.15. 0.16 (.006). -0.11. -0.08. 0.15 (.016). 0.30 (.027) -0.06. 0.31 (.027). -0.06. mean. CI. mean. CI. Sri Lanka. 0.17 (.006). -0.24. 0.15 (.005) -0.08. Urban. 0.15 (.012). -0.27. Rural. 0.16 (.006). Estate. 0.40 (.028). 0.03. Source: Author’s calculations based on 2006/07 DHS survey data.. 11. mean. CI.
(14) SOCIO-ECONOMIC DETERMINANTS AND INEQUALITIES IN CHILDHOOD MALNUTRITION IN SRI LANKA. The CIs for all four childhood nutritional outcomes are negative, indicating that childhood poorer nutritional status is concentrated among the poor. The magnitude of these inequalities are higher for childhood long-term growth failure than for childhood short-term growth failures implying that long-term health and nutrition problems exist among lower socio-economic groups (see Table 3). Further, poor children are more prevalent of being in low weight births than their better off peers. In the estate sector the measured inequality in childhood malnutrition, CIs (the gap between poor and rich) are lower compared to the other two regions, indicating that in the estate sector as whole higher childhood malnutrition. The reason could be, in the estate sector household’s socioeconomic status is significantly lower than that of the urban and rural sectors. For instance, in the estate sector, almost 63% of households fall into the poorest category while in the urban and rural sectors this is 8% and 19% respectively. Figure 2 presents the distribution of childhood malnutrition as evaluated by the three anthropometric measures with regard to the household’s economic situation as measured by the wealth index. The concentration curve for stunted children under five years of age lies well above the line of equality, indicating that prevalence of stunting is concentrated among the poor. Also shown in the figure is the concentration curve for underweight which lies below that of stunting at every point, indicating that there is less inequality in under-weight levels than in stunting. The curve closer to the line of equality implies less inequality with respect to the distribution of wasted children. Figure 2 Concentration Curves for Child Malnutrition. cumul share of malnutrition. 1. .8. .6. .4. .2. 0 0. .2. .4. .6. .8. 1. cumul share of children (poorest first) wasted stunted. line of equality underweight. low weight birth. Source: Author’s calculations based on 2006/07 DHS survey data.. 12.
(15) WELL-BEING AND SOCIAL POLICY VOL. 8, NUMBER 1, pp. 1-22. 4.2 Causes of childhood malnutrition There is a need for improving child nutritional status not only in averages but also in reducing disparities. Therefore, this study examines the determinants of child malnutrition as well as why childhood malnutrition is higher amongst lower socio-economic groups. The measure of socioeconomic inequalities of malnourished children and low birth weight babies are decomposed into determining factors of malnutrition, including those associated with intergenerational transmission (low weight births and mother’s nutrition), women’s education and knowledge, and geographical location etc. 4.2.1 Underlying determinants on the prevalence of childhood malnutrition Underlying determinants of long term versus short-term childhood malnutrition (stunting vs wasting) are discussed in this section. As described in the methodology section, a linear additive regression model is applied to explain the contribution of individual factors to socio-economic related inequality of child malnutrition. Two constructed anthropometric measures height-for-age and weight-forheight z-scores are used as the dependent variables. The dependent variable is increasing in malnutrition, whereas positive coefficient should be interpreted as increasing malnutrition. Regression coefficients and their level of significance for above two discussed models are given in Table 4, column 2 and 4 respectively. Findings of this study showed that long-term growth failures increase with the child’s age. For instance, children of age above 12 months, were at a significantly higher risk of being stunted as compared with children of age below 6 months. As expected, a child’s birth weight is strongly associated with being a malnourished child. Birth characteristics such as frequent births also increase the likelihood of being a stunted and wasted child. The higher prevalence of malnutrition among boys as compared to their female peers is also signified. The child of a woman with below primary education has a significantly higher risk of longterm growth failure than the child of a woman with completed secondary school education. Further, mother’s who read newspapers regularly, which measures the mother’s knowledge, reduces the childhood long term growth failures. As in the case of mother’s education and knowledge, her nutritional status also has a stronger impact on the child’s nutrition. A child being born to an underweight mother exerts a significant impact on the long-term as well as short-term nutritional status of the child. Further, mother’s height is negatively associated with being wasted and stunted. When considering childhood malnutrition by geopolitical region, a significantly higher risk of long-term child nutritional status can be seen in the Central Province, Eastern Province, Uva Province, Sabaragamuwa, and North Western Province compared to the Western Province. Further, the conflict affected Eastern Province has a significantly higher probability of childhood shortterm growth failures as well. Households with poor sanitary facilities —unsafe drinking water or toilet facility, significantly increase the risk of long-term childhood growth failures. These findings indicate the association of childhood long-term and short-term growth failures with mother’s nutrition, education and knowledge, household socio-economic status, etc.. 13.
(16) 14 0.004 -0.230. 0.115. Mother's height (in cm) Mother underweight (BMI). -0.136. 25-34 (base) 35 & above. -0.043 0.143. -0.129. 0.069. 0.042. -0.102. 0.279 0.015. 15-24. Mother engages in an economic activity Mother's age at first child's birth. 0.253. -0.006. 0.083. -0.559. Mother's characteristics Mother's education Primary schooling. 0.050 0.057 0.489. -0.145. -0.042. Whether child ill. Secondary schooling Secondary schooling completed (base) Mother reads newspaper regularly. 0.001 -0.049 -0.129. Birth order of child Low birth weight child. 0.169 0.438. *** ***. **. **. ***. **. ***. *** ***. **. ** ***. Coefficient P>t. CI k. 0.003 -0.007. 2. 3. 16.9 4.0. 0.4. 3.6. -0.1. 6.1. 4.6. 8.3. 0.0. 3.8 7.2. 0.0. 0.0 1.7. Contribution %. Stunting 1. Male child. 6-12 months > 12 months. Child characteristics Child age (in months) < 6 months (base). Variables 4. -0.007 0.254. 0.210. -0.049. -0.021. -0.040. 0.068. 0.053. 0.082. 0.022 0.366. 0.054. -0.149 0.098. ** ***. **. *. **. **. * ***. **. ** *. 5. 8.9 23.5. -1.9. -8.4. 0.2. 7.9. 12.4. 5.8. 2.3. 4.9 17.7. -0.1. 0.1 1.3. Contribution %. Wasting. Coefficient P>t. Table 4 Regression and Decomposition Results of Childhood Malnutrition SOCIO-ECONOMIC DETERMINANTS AND INEQUALITIES IN CHILDHOOD MALNUTRITION IN SRI LANKA.
(17) 0.316 0.196 -0.069. -0.111 -0.084 -0.111 -0.307 -0.129 0.054 0.128. Eastern. North Western North Central. Uva Sabaragamuwa. Safe drinking water. Water sealed separate toilet Residual Total. 15 **. *. *** ***. *** **. **. *** **. Note: Number of observations =5679. Statistical significance at 1%, 5% and 10% levels are indicated by ***, **, * respectively.. -0.061. 0.202 0.098. 0.155. -0.206 -0.062. 0.277 0.091. 0.005 0.032. Coefficient P>t. CI k. 0.019 -0.013. 2. 3. 4.2 22.2 100.0. 2.3. 4.7 1.7. 1.4 0.5. 1.2. 4.8 0.5. -0.3 0.4. Contribution %. Stunting 1. Central Southern. Province Western. Household characteristics Number of people in the household Number of children between 0 and 5. Variables. Table 4 (continued). 0.006. 0.029. 0.087 0.017. 0.018 0.113. 0.185. -0.017 0.111. -0.010 -0.025. *. **. ***. **. Coefficient P>t. 4. 5. -1.3 16.2 100.0. -3.1. 4.2 0.5. 0.4 1.8. 4.7. -1.0 2.1. 2.1 -1.1. Contribution %. Wasting. WELL-BEING AND SOCIAL POLICY VOL. 8, NUMBER 1, pp. 1-22.
(18) SOCIO-ECONOMIC DETERMINANTS AND INEQUALITIES IN CHILDHOOD MALNUTRITION IN SRI LANKA. 4.2.2 Decomposing socio-economic inequalities in childhood malnutrition Table 4 also gives the results of decomposition analysis where the contributions of individual determinants to the overall inequality in childhood stunting and wasting are reported. The decomposition analysis involves the CI and percentage contribution of each determinant. The entries in column 1 represents the concentration index for each factor (CIk).The percentage contribution of each factor to the Concentration Index (CI) for the stunting and wasting dependent variables are given in column 3 and 5 respectively. According to the findings, socio-economic characteristics such as malnourished mother, low weight births and mother’s low education (primary or below secondary), are more prevalent among the group with lower socio-economic status. These variables are positively associated with an increase in childhood malnutrition. Therefore, the combined effect of the all the above discussed determinants on childhood malnutrition and its distribution by economic status raise the socio-economic inequality of childhood malnutrition. The large elasticities of determinants are also responsible for their large contribution to socio-economic related inequality. For instance, although mother’s height has a trivial contribution to socio-economic inequality, it is highly sensitivity to childhood nutritional measures and so makes a significant contribution to the socio-economic inequality in childhood malnutrition. According to the findings, a major part of socio-economic inequality in childhood stunting and wasting is explained by intergenerational transmission. For instance, life cycle components of malnutrition, mother’s nutritional status as measured by mother’s height, mother’s BMI measure, and low weight birth make a combined effect of 28% to total inequality in child stunting and almost 50% of the socio-economic inequality in childhood short-term growth failure. Apart from this direct contribution, another significant contributor in childhood malnutrition inequality is mother’s education and knowledge (19% of inequality in stunting and 26% of inequality in wasting). Socio-economic inequalities due to household sanitary facilities and safe drinking water also exert socio-economic inequalities in childhood long term-growth failures. When considering the regional disparities, Central Province and Uva Province considerably contributed to socio-economic inequalities of childhood long-term growth failures.. 4.3 Causes of low birth weight babies As identified in the previous section low birth weight is a significant contributor to childhood malnutrition and they are likely to suffer growth retardation throughout their childhood. In this section, determinants of babies born with low birth weight and how determinants proportionately contribute to inequality in a low birth weight babies are explored in depth. Table 5 provides the results of Linear Probability Model (LPM) and decomposition analysis.. 16.
(19) WELL-BEING AND SOCIAL POLICY VOL. 8, NUMBER 1, pp. 1-22. Table 5 Regression and Decomposition Results of Low Birth Weight Babies 1. 2. Variables. dF/dx. P>z. CI. %. Child characteristics Male child Twin birth Birth order of child. -0.038 0.672 -0.033. *** *** ***. 0.003 0.056 -0.051. 0.3 -3.3 -14.9. 0.090 0.015. ***. -0.562 -0.146. 19.2 5.3. -0.036 -0.012. **. 0.280 0.014. 13.8 0.2. -0.138. -3.1. 0.106 0.004 -0.230. -1.1 16.0 17.9. 0.017 -0.013. -0.4 -1.2. -0.197 -0.066 -0.114 -0.077 -0.112 -0.292 -0.126 0.054 0.129. 12.1 2.2 1.6 0.1 1.3 5.7 3.1 3.0 4.3 18.0 100.0. Mother's characteristics Mother's education Primary schooling Secondary schooling Secondary schooling completed (base) Mother reads newspaper regularly Mother engages in an economic activity Mother's age at first child's birth 15-24 25-34 (base) 35 & above Mother's height (in cm) Mother underweight (BMI). -0.009 0.065 -0.006 0.099. Household characteristics Number of people in the household Number of children between 0 and 5 Province Wester n Central Southern Eastern North Western North Central Uva Sabaragamuwa Safe drinking water Water sealed separate toilet Residual Total. ** *** ***. 0.001 -0.015. 0.111 0.059 0.032 0.003 0.040 0.061 0.056 -0.014 -0.010. *** *** * * ** **. Note: Statistical significance at 1%, 5% and 10% levels are indicated by ***, **, * respectively.. 17.
(20) SOCIO-ECONOMIC DETERMINANTS AND INEQUALITIES IN CHILDHOOD MALNUTRITION IN SRI LANKA. 4.3.1 Underlying determinants of low birth weight babies Marginal effects of LPM and their significance are given in the first column of Table 5. According to the estimates, being a male child decreases the likelihood of being a low birth weight for biological, rather than behavioral reasons. As expected, the other two birth characteristics are striking. Being a twin birth contributes to the probability of being low birth weight by almost 65%. Further, the birth order of the child is negatively associated with the probability of being underweight at birth. As in the case of childhood growth retardation, mother’s nutrition has a statistically significant impact on the child’s birth weight. According to the study results, children born to underweight mothers and those born to stunted mothers have a higher probability of being underweight. Mother’s knowledge also reduces the probability of having low weight babies. As in the case of childhood nutritional status, mother’s education below primary level has a statistically significant impact on the child’s birth weight. Residence in the Central, Southern, Uva and Sabaragamuwa Provinces increases the probability of being low birth weight baby. 4.3.2 Decomposition of socio-economic inequality in low birth weight babies Column 2 of the Table 5, presents the results of decomposition analysis which presents the absolute contribution of each of the explanatory variables and their percentage contribution to the overall estimated socio-economic inequality of the dependent variable. Socio-economic inequality in low weight births show similar results to inequality in child stunting. According to the estimates, about 34% of the inequality in low weight births is explained by the mother’s poor nutritional status (see Table 5). Further, less educated mothers especially below primary level education are more prevalent among lower socio-economic groups and this is positively associated with giving birth to low weight births. Having below secondary level education contributes around 25% of total inequality while around 14% of inequality is explained by mother’s knowledge which is measured by regularly reading newspapers. Further, according to the estimates, residence in the Central Province contributes to 12% of inequality in low weight births.. 5. Discussion The study findings support the literature,6 that being born underweight has a stronger impact on childhood short-term as well as long-term growth failure. Intergenerational transmission is also 6. As described in ACC/SCN 1992; World Bank 1994, malnutrition spans the life cycle as well as having intergenerational effects. When a female child begins life as an undernourished infant, with frequent illness and poor nutrition during childhood, she arrives at maturity in a less than optimal state to undertake pregnancy and lactation. Finally, as the conditions that produce malnutrition continue to affect her both she and her offspring are further disadvantaged through a vicious intergenerational cycle of under-nutrition.. 18.
(21) WELL-BEING AND SOCIAL POLICY VOL. 8, NUMBER 1, pp. 1-22. evidenced in this study; mother’s poor nutritional status is a significant contributor to the child’s short-term as well as long-term growth failures. Further, children born to stunted mothers have a higher probability of being stunted. Likewise, children born to underweight mothers and those born to stunted mothers have a higher probability of being underweight at birth. As established in Smith et al. (2000), women’s nutritional status does indeed influence children’s nutritional status in early childhood through being less successful at breastfeeding, and caring practice that is vitally important for a child’s health and proper growth. Growth retardation is a cumulative process that occurs over the course of many years of dietary inadequacy and health status. Long-term childhood growth failures may be an indication of either inappropriate food supplementation in quantity or quality during the weaning period as well as poor health status. The low risk of malnutrition during the first 6 months may also be due to the protective effect of breastfeeding. For instance, almost all children of this country (98%) are breastfed, while about 73% are exclusively breastfed during the first four to six months. Frequent births also exert a strong impact on the long-term nutritional status of the child as close spacing drains women’s nutritional resources as well as lesser time spent in feeding and caring for children. Further, it may also have a nutritional effect on the previous child, who may be prematurely weaned if the mother becomes pregnant again too early. The child of a woman with below primary education has a significantly higher risk of longterm growth failure than the child of a woman who has completed secondary school education. For instance, child stunting levels are three times higher for less educated mothers. Further, mothers who read newspapers regularly, which measures the mother’s knowledge, reduces the childhood long-term growth failures. These results suggest that educated and knowledgeable mothers might have better health seeking behavior coupled with household hygiene practices and they are likely to take appropriate actions to improve the health status of their children, which is also an important component of child nutrition. Residence in the Eastern Province, Uva Province and Central Province7 has a significantly higher risk of long-term child nutritional status. Region’s general level of underdevelopment and less access and use of health services in the less developed provinces, coupled with the lesser education and social and cultural beliefs of the region negatively affect nutrition of household members. Western Province residents have better access to facilities and are more easily reached by health services compared to residents of less developed provinces in Sri Lanka.8 The Central Province of the country is mainly comprised of the estate sector with formal plantations where Tamils of Indian descent work and live. The estate sector has the highest number of babies born at low birth weight with about one child in every three being low birth weight. There is no safe drinking water facility for 17% and poor sanitary facilities with 22% of households in the estate sector having no access to water sealed latrines; in comparison, this percentage is only about 2% in the urban sector. According to the findings, poor sanitary facilities significantly increase the risk of long-term childhood growth failures. Further, almost half of the 15-49 age women in the estate sector (46%), have below primary level of education. Poor education makes it difficult for these women to gain awareness of family health and hygiene practices imparted through the 7. According to the 2006/07 estimates, HCI was highest in Uva Province (27%), while Sabaragamuwa and Central Province have next higher poverty levels of 24 % and 22%, respectively (DSC 2009b). 8 See DCS 2009b which compares the incidence of poverty with accessibility.. 19.
(22) SOCIO-ECONOMIC DETERMINANTS AND INEQUALITIES IN CHILDHOOD MALNUTRITION IN SRI LANKA. health service.9 The conflict affected Eastern Province has a significantly higher probability of childhood short-term growth failures as well.. 6. Policy Implications According to the findings, poorly nourished, underweight and stunted mothers give birth to babies with low birth weight. Those who were born underweight are more likely to be growth retarded in childhood. Further, mother’s poor nutritional status is closely associated with childhood malnutrition. It is evidenced that malnourished mothers and low weight births, highly contributed to raise the socio-economic inequality in child malnutrition. The conclusion emerging from these findings then is that, one major aspect of socio-economic inequality in malnutrition is due to the continuity of life cycle of malnutrition among the lower categories of socio-economic groups. Therefore, measures need to be taken at each stage of the life cycle to ensure that malnutrition does not perpetuate over one’s life as well as become an intergenerational problem. Also, it is very important to break the vicious cycle of malnutrition in the lower socio-economic groups. Further, mother’s lesser education and knowledge also highly contributed to socio-economic inequalities of child malnutrition. Women’s disadvantaged social position, which is often related to less education and knowledge, also contributes to the perpetuation of poor health and hygiene practices, poor dietary practices and the continuing cycle of malnutrition. Further, poor education makes it difficult for these women to gain awareness on family health and hygiene practices imparted through the health service. Culture and traditions, especially in the estate areas are less favorable for women and most of the women in the estate sector are less educated and hence these factors adversely affect their ability to make the right nutritional choices and the empowerment to adopt such decisions. Therefore, improving female education is a must for improved child and maternal nutrition. It may also motivate mothers to send their daughters to school, especially in estate sector —thus increasing maternal literacy in the future. The observed regional difference in nutritional status could be an indication of the general level of underdevelopment and the lower access and use of health services in the less developed regions. It is proved that socio-economic inequalities exert strong pressure on long-term childhood nutrition status (stunting) as well as low birth weight. In turn, better levels of basic needs will positively affect the socio-economic development of society. The availability of safe drinking water supply, and hygienic sanitary facilities are basic needs for maintaining the health and nutrition of mother and child. In this context, it has to be emphasized that policies relating to the improvement of household socio-economic status and safe environment in under-privileged areas would have a major role to play in the well-being of mother and child. 9 As described in Samarsinghe et al. “Maternal Nutrition and Health Status of Indian Tamil Female Tea Plantation Workers in Sri Lanka” (1990); although facilities are provided for education in the estate sector, the motivation for a girl to continue in education is minimal, as they can start on wage employment at a young age. Further, women’s lesser education and social and cultural beliefs affect nutrition of pregnant women. According to their findings, pregnant women consume less food at the household level than any other female group in the plantation sector. This may be linked to the belief prevalent among less educated women that if they eat less during pregnancy they will have smaller babies which will make it easier at child delivery.. 20.
(23) WELL-BEING AND SOCIAL POLICY VOL. 8, NUMBER 1, pp. 1-22. References Haddad, L. J. “Women’s Status: Levels, Determinants, Consequences for Malnutrition, Interventions, and Policy.” Asian Development Review, vol. 17 nos. 1 and 2 (1999): 96-131.. Administrative Committee on Coordination / Sub-Committee on Nutrition (ACC/SCN). Second Report on the World Nutrition Situation. Global and Regional Results, vol. 1. Geneva: United Nations, 1992.. Haddad, L. J., and H. Alderman. “Eradicating malnutrition income growth or nutrition programs?: essay from IFPRI’s 1999-2000 Annual Report.” Annual report essays 2000, Essay 2. International Food Policy Research Institute (IFPRI), 2000.. Aturupane, H., A. B. Deolalikar, and D. Gunewardena. “The Determinants of Child Weight and Height in Sri Lanka: A Quantile Regression Approach.” Research Paper No. 53. Helsinki, Finland: United Nations University (UNU) World Institute for Development Economics Research, 2008.. O’Donnell, O., E. Van Doorslaer, A. Wagstaff, and M. Lindelow. Analyzing Health Equity Using Household Survey Data. Washington, D. C.: World Bank, 2008.. De Onis, M., and M. Blossner. WHO Global Database on Child Growth and Malnutrition. WHO/ NUT/97.4. World Health Organization (WHO), Geneva, 1997.. Samarasinghe, V., S. Kiribamune, and W. Jayatilake. Maternal Nutrition and Health Status of Indian Tamil Female Tea Plantation Workers in Sri Lanka. International Centre for Ethnic Studies (ICES), Sri Lanka, 1990.. Department of Census and Statistics. Demographic and Health Survey 2006/2007. Colombo, Sri Lanka, 2009a.. Smith, L. C., U. Ramakrishnan, A. Ndiaye, L. Haddad, and R. Martorell. “Explaining Child Malnutrition in Developing Countries - A crosscountry analysis.” Research Report No. 111. Washington, D. C.: International Food Policy Research Institute (IFPRI), 2000.. Department of Census and Statistics. Poverty in Sri Lanka. Colombo, Sri Lanka, 2009b. Engle, P., P. Menon, and L. Haddad. “Care and Nutrition: Concepts and Measurement.” World Development, vol. 27 no.8 (1999): 1309–1337.. Smith, L. C., and L. Haddad.. “The Importance of Women’s Status for Child Nutrition in Developing Countries.” Research Report No. 131. Washington, D. C.: International Food Policy Research Institute (IFPRI), 2003.. Filmer, D., and L. Pritchett. “Estimating Wealth Effects without Income or Expenditure Data-or Tears: Educational Enrollment in India.” Policy Research Working Paper No. 1994, Development Economics Research Group. Washington, D. C.: World Bank, 1998.. Van de Poel, E., A. Hosseinpoor, C. JehuAppiah, J. Vega, and N. Speybroeck. “Malnutrition and the Disproportional Burden on the Poor: The Case of Ghana.” International Journal for Equity in Health, vol. 6 no. 21, 2007.. Gillespie, S., and R. Flores. “Life cycle of Malnutrition: essay from IFPRI’s 1999-2000 Annual Report.” Annual report essays 2000, Essay 1. International Food Policy Research Institute (IFPRI), 2000.. Wagstaff, A., E. Van Doorslaer, and N. Watanabe. “On Decomposing the Causes of Health Sector Inequalities, with an Application to Malnutrition Inequalities in Vietnam.” Journal of Econometrics, vol. 112 no. 1 (2003): 27-219.. Gwatkin, D., S. Rutstein, K. Johnson, R. Pande, and A. Wagstaff. Socio-economic Differences in Health, Nutrition and Population in India (HNP). Poverty Thematic Group of The World Bank, 2000.. 21.
(24) SOCIO-ECONOMIC DETERMINANTS AND INEQUALITIES IN CHILDHOOD MALNUTRITION IN SRI LANKA. Wagstaff, A., E. Van Doorslaer, and P. Paci. “On the Measurement of Inequalities in Health.” Social Science and Medicine, vol. 33 no. 5 (1991): 57-545.. World Health Organization (WHO). Social Determinants of Health: the Solid Facts. 2nd Edition, edited by R. Wilkinson and M. Marmot. WHO, 2003.. World Bank. A New Agenda for Women’s Health and Nutrition Development in Practice. Washington D. C.: World Bank, 1994.. World Health Organization (WHO). WHO Anthro for Personal Computers Manual: Software for Assessing Growth and Development of the World’s Children. Geneva: WHO, 2007.. World Health Organization (WHO). Child Growth Standards. Geneva: WHO, 2006.. 22.
(25)
Figure


Documento similar