TítuloEffect of adhesive application on the shear bond strength using different cementing agents in molar and premolar attachments
13
0
0
Texto completo
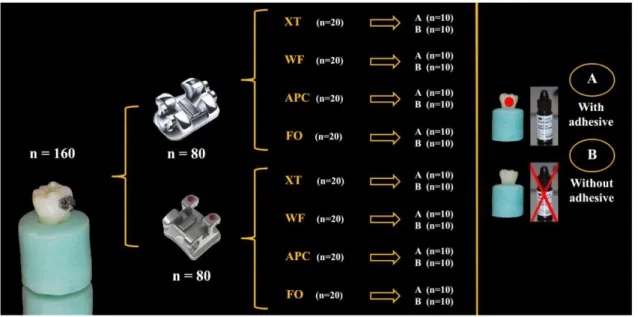
(2) Currently, flowable composites are applied for orthodontic use.[15–19] These composites show two desirable clinical handling characteristics: (1) non-stickiness and (2) fluid injectability. These characteristics are associated with the low viscosity of this type of flowable resin.[18] Flowable composites were created by retaining the same small particle sizes of traditional hybrid composites while reducing the filler content and allowing the increased resin to reduce the viscosity of the mixture.[18] Precoated attachments are those including cement, which provides a more uniform adhesive thickness and a reduction in the number of bonding procedures.[7,12] The properties of precoated brackets and tubes with composite resins have improved in recent years.[20] The introduction of the APC Plus system (3M Unitek Dental Products) allowed for greater tolerance to humidity than its predecessors had, as this adhesive is a compomer – a mixture of BIS-GMA resin and conventional glass ionomer – that possesses unique properties.[21] In addition, the product contains fluoride.[21] GICs have been considered an alternative adhesive in direct orthodontic brackets; however, no study has yet been done on the efficacy of adhesive bonding in tubes. The use of these cements for direct bonding of orthodontic attachments has been proposed because of their ability to adhere to base metal alloys.[22] One major characteristic would be their fluoride release capacity over a period of months,[23] acting as a reservoir for fluoride ions [24] and reducing the potential risk of enamel decalcification.[25] Searching for improved physical characteristics has led to the development of RMGICs which are hybrid materials of traditional GICs with a small addition of light-cured resin.[26] They should have the advantages of both materials, such as adhesion to tooth structure, fluoride release, rapid hardening by visible light, and enhanced mechanical and physical properties.[26] When bonding an orthodontic attachment, the bond strength should be adequate to withstand the chewing forces of mastication and stresses exerted by the archwires. Thus, if flowable composites, compomer precoated orthodontic attachments, and RMGICs could guarantee clinically acceptable bond strength for acid-etched enamel without applying an adhesive system prior to application, they would provide an important savings of chair-side time by reducing the number of intermediate steps in the attachment bonding procedures and this would lower the cost. In the case of orthodontic precoated compomer attachments and RMGICs, they also reduce the risk of decalcification. On the other hand, tubes bonded to molars support greater occlusal forces than brackets bonded to teeth situated more anteriorly in the mouth.[27] Because of this, it is necessary to know whether the difference in tube design, accompanied by the same cementing agents that are used to bond brackets, is giving consistently higher bond strength to withstand increased forces. Until today, there has been no literature from any study comparing the bond strengths of brackets vs. tubes using different families of cements that are employed routinely in a dental clinic. Therefore, this study aimed to evaluate the effect of adhesive application on the shear bond strength (SBS) of orthodontic brackets and tubes to acid-etched human enamel when using as cementing agents, a traditional orthodontic cement (Transbond XT), a flowable composite (Wave MV Flow), an orthodontic precoated attachment compomer (APC Plus), and a RMGICs (Fuji Ortho LC). The study also evaluates the adhesive remnant index (ARI) score assessment of orthodontic tubes and brackets. The null hypothesis to be tested is that neither the application of an adhesive nor the type of attachments or cement selection modifies the SBS to human enamel.. 2. Materials and methods 2.1. Preparation of specimens One hundred and sixty sound extracted teeth (80 human third molars and 80 premolars) (Figure 1) were collected and were stored in a 0.5 chloramine T solution for a maximum of six months after extraction. Exclusion criteria included previously restored teeth and teeth with enamel defects or cracking and delamination of the enamel. The samples were mounted in a self-cured acrylic block. The buccal crown surface of each tooth was polished with fluoride-free pumice slurry for 15 s, and then was rinsed and dried. Two groups were made, the first formed with 80 molars and the second with 80 premolars, which were then divided into four equal subgroups (n = 20), employing one of the four different cements selected for the study: (1) a composite resin for bonding in orthodontics: Transbond XT ® (3M Unitek; St. Paul, MN, US -XT-); (2) a flowable composite: Wave MV (SDI; Cologne, Germany -WF-); (3) a compomer precoated composite: APC Plus System (3M Unitek; Monrovia, CA, US -APC-); and (4) a RMGICs: Fuji Ortho LC (GC America Inc, Chicago, I11 -FO-)..
(3) Figure 1. Schematic of the different groups and subgroups used in the study. The sample was divided into 2 groups: 40 brackets and 40 tubes, and both groups were divided into four subgroups depending on the cement used. Finally, each group was divided into two by applying an adhesive system to half of the specimens and not to the other half.. The orthodontic attachments employed in the study were: (1) for molars, 60 stainless steel Smart Clip metal molar tubes with a micro-etched base (3M Unitek; Monrovia, CA, US) and 20 precoated composite APC Plus System tubes cemented in molar buccal surfaces; and (2) for premolars, 60 premolar metal brackets (Victory Series, 3M Unitek) and 20 precoated composite APC Plus System brackets cemented in premolar buccal surfaces. We calculated the area of each Smart Clip metal molar tube as having an approximate value of 15.8 mm². Each tube was measured using the mathematical formula for calculating the area, where the area is equal to its length multiplied by its width, with the lowest value being 15.4 mm² and the highest being 16.2 mm². We repeated the measurements for the rest of the orthodontic attachments. The average surface area of the bases was approximately 15.3 mm2 for the precoated composite APC Plus System tubes, 9.4 mm2 for the Victory brackets, and 9.79 mm2 for the precoated composite APC Plus System brackets. The enamel of all bonding surfaces was etched with a 37% phosphoric acid gel (Etch-37, Bisco, Schaumburg, IL, US) for 30 s, was rinsed for 15 s, and then was dried with oil-free and moisture-free air for 20 s until the enamel showed a faintly white appearance. The same operator bonded all attachments at the same temperature (room temperature). For each experimental subgroup, half of the specimens (n = 10) were bonded with Transbond XT primer (3M Unitek) prior to cementation, while the other half were directly bonded to the acid-etched enamel surfaces with the resin composites tested. The attachments were positioned on the buccal surface and were pressed firmly with a Hollenback carver to expel the excess adhesive. Each attachment was subjected to a 300 g compressive force using a force gauge (Correx Co; Berne, Switzerland) for 10 s, after which the excess bonding resin was removed using a sharp scaler. Then, the composite was light-cured for 40 s (20 s each from occlusal and gingival aspects of the bonded attachment). Curing time is a fundamental factor in the SBS values obtained, so that each additional second of photopolymerization increased bond strength by 0.077 MPa.[1] Most of the remaining studies used 40 s for polymerizing the adhesive; this corresponds to the routine clinical standard.[1] The bonding adhesive was light-cured with a curing light (XL300; 3M/Unitek Dental Products; Monrovia, CA, USA), with a light intensity of 1000 mW/cm 2 measured with a built-in radiometer that was calibrated every 10 m to ensure consistent light intensity. The attachments were immersed in sealed containers of deionized water and were placed in an incubator at 37 °C for 72 h to allow adequate water absorption and equilibration before the SBS test was performed..
(4) 2.2. SBS test The specimens were secured in a jig attached to the base plate of a universal testing machine (Instron Corp; Canton, MA, USA). A chisel-edged plunger was mounted in the movable crosshead of the testing machine and positioned such that the leading edge was aimed at the enamel-composite interface before being brought into contact, exerting a force parallel to a flat interface in the occlusal-apical direction. This force attempts to imitate the force that makes the orthodontic arch during treatment. A crosshead speed of 0.5 mm/min was used. The force required to dislodge the brackets and tubes was measured in kilonewtons, and the SBS (1 MPa = 1 N/mm2) was calculated by dividing the force values by the bracket base area. An increase in crosshead speed of 1 mm/min yielded an increase in average bond strength of 1.3 MPa. Moreover, no effect was observed on bond strength with crosshead speed variations between 0.1 and 5 mm/min.[1] The SBS values in MPa were obtained by dividing the maximum load (N) by the base area (mm2). We used I vb image analysis equipment (Sony DXC-151-ap video camera, connected to an Olympus SZ11 microscope) and the MIP-4 (Micom Image Processing Software. Digital Image Systems, Barcelona, Spain) software to estimate an average of the samples.. 2.3. Failure mode analysis After debonding, each specimen was examined under a stereoscopic zoom microscope (SMZ800, Nikon Corporation; Tokyo, Japan) to identify the location of the bond failure. The residual composite remaining on the molar or premolar surface was assessed using the ARI.[28] Each specimen was scored according to the amount of material remaining on the enamel surface, as follows: 0 = no adhesive remaining; 1 = less than 50% of the adhesive remaining; 2 = more than 50% of the adhesive remaining; and 3 = all adhesive remaining, with a distinct impression of the attachment base.. 2.4. Scanning electron microscope (SEM) analysis A representative molar and premolar surface from the 16 experimental subgroups was selected and was examined under a SEM. The specimens were stored for two days in absolute alcohol, air-dried for 2 h, were mounted on SEM stubs (enabling the inspection of the relevant area of interest), sputter-coated with 10 nm of platinum in a Polaron E5100 SEM coating unit (Polaron Equipment Ltd. Hertfordshire, England, UK), and were finally examined under SEM (DSM 940, Zeiss; Oberkochen, Germany). Specific surface areas were considered, focusing with different magnifications (from 10× to 1000×) at an accelerating voltage of 20 kV to identify possible differences among the experimental groups, with respect to the surface topography of the attachments.. 2.5. Statistical analysis Descriptive statistics, including means (MPa) and standard deviations (SD), were used to describe the central tendency of the SBS data. A two-way analysis of variance (ANOVA) test was used to compare the mean SBSs among the 16 subgroups, in order to evaluate the effect of both the composite and the adhesive factors after the Bonferroni post hoc intergroup analyses. A step-wise linear regression model for all the potential predictors was carried out. The ARI was analyzed using the χ2 test for comparing the distribution of the fracture types, grouping together within the same category ARI scores from 0 to 1 and from 2 to 3. The significance for all statistical tests was predetermined at p < 0.05. All the statistical analyses were conducted using the SPSS 15.0 package for Windows (SPSS Inc., Chicago, IL, USA)..
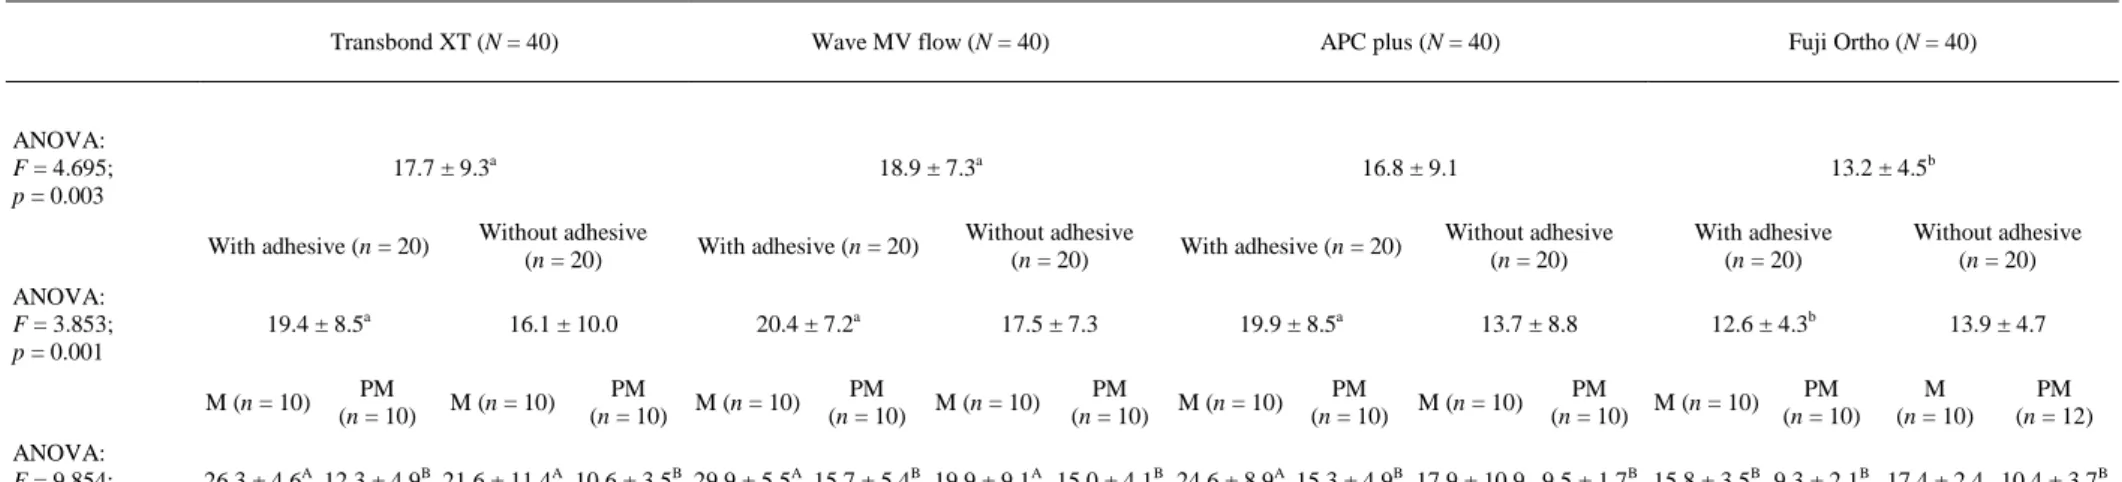
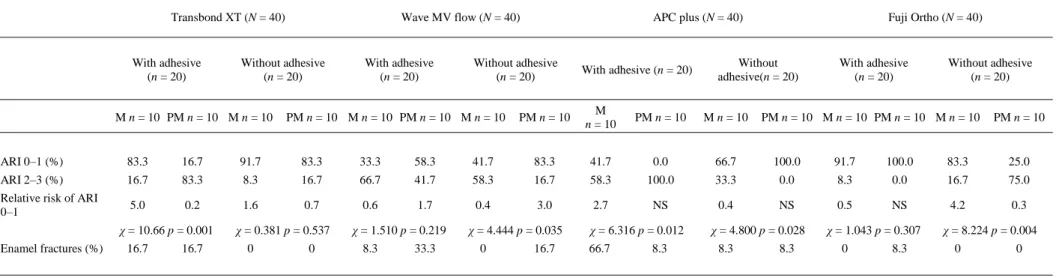
(5) 3. Results 3.1. SBSs Results from the ANOVA tests depicted in Table 1 showed that in comparing only the use of cement (Table 1, first row), we can see that they are equal between each other at this stage, with XT, WF, and APC on the other side and, FO and APC on the other. Cements XT and WF showed statistically greater SBS values (p = 0.003) than FO did (13.2 ± 4.5). If we include the variable ‘adhesive’ to see how it influences each cement (Table 1, row 2), we can see that the application of adhesive holds the same values in all groups without increasing their SBS values as without adhesive. If we do not apply adhesive, all cements have similar values, but if we do apply adhesive, the cements XT, WF, and APC show significantly higher SBS values (p = 0.001) than FO does. Comparing the SBS values between the tubes and brackets of each cement with and without adhesive (Table 1, row 3), the tubes were observed to show higher values than the brackets in cements XT and WF, with or without adhesive, as well as APC with adhesive. The results obtained by cementing the brackets with any of the cements were equal, regardless of the use of adhesive. In contrast, the results obtained by cementing the tubes showed statistically lower values (p < 0.001) than the rest of the APC without adhesive cement and FO with and without adhesive cement.. 3.2. Linear regression models (data not shown) If we were to perform a linear regression model to predict the values of adhesion (MPa) depending on the presence of the adhesive and the type of tooth to be treated within each composite, we would find that all significant regression models, except in APC, where only significantly influences the type of orthodontic attachment that is applied to each tooth (brackets for premolars and tubes for molars), obtained better adhesion in tubes than in brackets. For XT, the employment of a tube or bracket determines the adhesion values. XT put in a bracket instead of a tube significantly reduces adhesion values between −165 and 85.7 MPa. Applying adhesive seems to increase the bond strength between 7.2 and 72.1 MPa, but it does not become significant. The same can also be said for the other groups, because they have the same tendency. If we performed a linear regression model including the type of composite used as another predictor variable, and if we consider the cement FO, we see that for this group, and in tubes without adhesive, an average value of 162.6 can be achieved. If we add adhesive, the values increase to 27.7 MPa. If we put in brackets, we reduce the value to 88.05 MPa. If we use other composites, it increases to 35.8 MPa (APC) and 56.8 MPa (WF).. 3.3. ARI ARI scores were used to evaluate the adhesive residuals left on the enamel surfaces, with the results presented in Table 2. In grouping residual adhesives into little adhesive remaining on the tooth surface (0–1) and much adhesive remaining (2–3), we observed significant differences when comparing tubes and brackets within each group composite when we applied XT with adhesive (p = 0.001), WF without adhesive (p = 0.035), APC with (p = 0.012) and without (p = 0.028) adhesive, and FO without adhesive (p = 0.004)..
(6) Table 1. Descriptive statistics of SBS (MPa) within subgroups tested by one-way ANOVA tests and student t-test using XT.. Transbond XT (N = 40). Wave MV flow (N = 40). APC plus (N = 40). Fuji Ortho (N = 40). 17.7 ± 9.3a. 18.9 ± 7.3a. 16.8 ± 9.1. 13.2 ± 4.5b. ANOVA: F = 4.695; p = 0.003. ANOVA: F = 3.853; p = 0.001. With adhesive (n = 20). Without adhesive (n = 20). With adhesive (n = 20). Without adhesive (n = 20). With adhesive (n = 20). Without adhesive (n = 20). With adhesive (n = 20). Without adhesive (n = 20). 19.4 ± 8.5a. 16.1 ± 10.0. 20.4 ± 7.2a. 17.5 ± 7.3. 19.9 ± 8.5a. 13.7 ± 8.8. 12.6 ± 4.3b. 13.9 ± 4.7. M (n = 10) ANOVA: F = 9.854; p < 0.001. PM (n = 10). M (n = 10). PM (n = 10). M (n = 10). PM (n = 10). M (n = 10). PM (n = 10). M (n = 10). PM (n = 10). M (n = 10). PM (n = 10). M (n = 10). PM (n = 10). M (n = 10). PM (n = 12). 26.3 ± 4.6A 12.3 ± 4.9B 21.6 ± 11.4A 10.6 ± 3.5B 29.9 ± 5.5A 15.7 ± 5.4B 19.9 ± 9.1A 15.0 ± 4.1B 24.6 ± 8.9A 15.3 ± 4.9B 17.9 ± 10.9 9.5 ± 1.7B 15.8 ± 3.5B 9.3 ± 2.1B 17.4 ± 2.4 10.4 ± 3.7B. Different letters are significant comparisons in rows data having the letter ‘a’ are higher that data having the letter ‘b’ data have no letter are indistinguishable from both groups..
(7) Table 2. ARI: scores registered on the enamel surface after debonding composite groups (n = 160).. Transbond XT (N = 40). With adhesive (n = 20). Wave MV flow (N = 40). Without adhesive (n = 20). M n = 10 PM n = 10 M n = 10. With adhesive (n = 20). APC plus (N = 40). Without adhesive (n = 20). PM n = 10 M n = 10 PM n = 10 M n = 10. With adhesive (n = 20). PM n = 10. M n = 10. Fuji Ortho (N = 40). Without adhesive(n = 20). PM n = 10. M n = 10. With adhesive (n = 20). Without adhesive (n = 20). PM n = 10 M n = 10 PM n = 10 M n = 10. PM n = 10. ARI 0–1 (%). 83.3. 16.7. 91.7. 83.3. 33.3. 58.3. 41.7. 83.3. 41.7. 0.0. 66.7. 100.0. 91.7. 100.0. 83.3. 25.0. ARI 2–3 (%). 16.7. 83.3. 8.3. 16.7. 66.7. 41.7. 58.3. 16.7. 58.3. 100.0. 33.3. 0.0. 8.3. 0.0. 16.7. 75.0. Relative risk of ARI 0–1. 5.0. 0.2. 1.6. 0.7. 0.6. 1.7. 0.4. 3.0. 2.7. NS. 0.4. NS. 0.5. NS. 4.2. 0.3. χ = 10.66 p = 0.001 Enamel fractures (%). NS: no sense.. 16.7. 16.7. χ = 0.381 p = 0.537 0. 0. χ = 1.510 p = 0.219 8.3. 33.3. χ = 4.444 p = 0.035 0. 16.7. χ = 6.316 p = 0.012 66.7. 8.3. χ = 4.800 p = 0.028 8.3. 8.3. χ = 1.043 p = 0.307 0. 8.3. χ = 8.224 p = 0.004 0. 0.
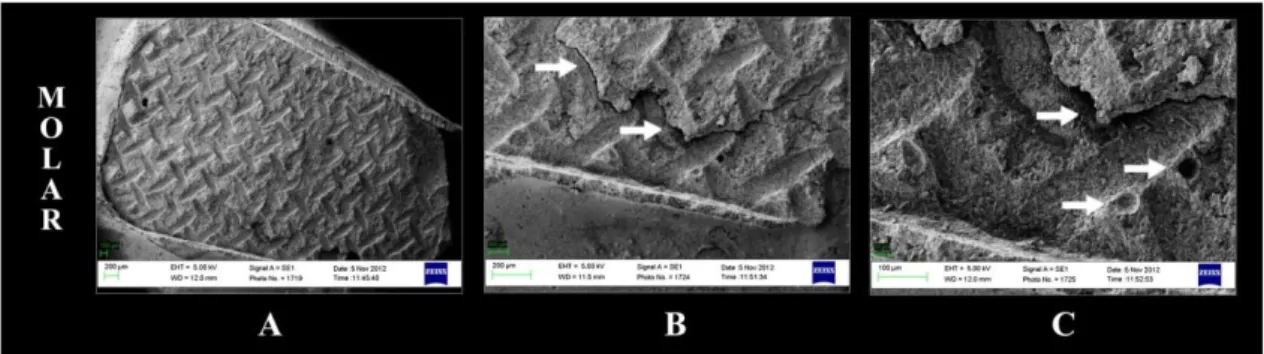
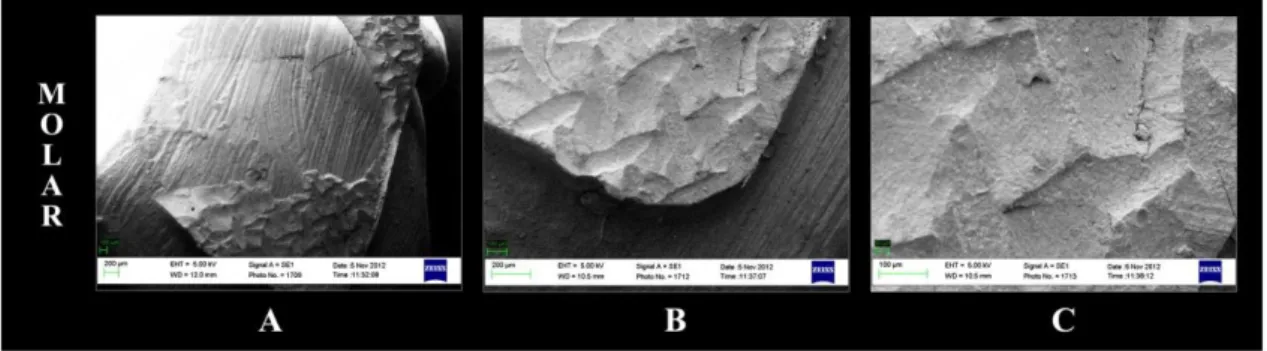
(8) Moreover, the highest number of fractures (66.7% of the sample) occurred when cementing molars with APC and adhesive.. 3.4. SEM Representative SEM micrographs of debonded enamel surfaces after SBS testing are reported in Figures 2–7. Figure 2 shows the representative SEM images of the enamel premolar surfaces after the shear bond testing. The specimen was bonded with APC with adhesive. More than 50% of the adhesive remained on the tooth surface (ARI score: 2) (Figure 2(A)). The APC showed transverse cracks (Figure 2(C)) across the interface in the residual composite (labeled in white). Figure 3 shows the representative SEM images of the enamel molar surfaces after the shear bond testing. The specimen was bonded with APC with adhesive. More than 50% of the adhesive remained on the tooth surface (ARI score: 2) (Figure 3(A)). The APC showed voids/bubbles (Figure 3(B) and (C)) and transverse cracks (Figure 3(B) and (C)) across the interface in the residual composite (labeled in white). Figure 4 shows the representative SEM images of the enamel premolar surfaces after the shear bond testing. The specimen was bonded with FO. Less than 50% of the adhesive remained on the tooth surface (ARI score: 1) (Figure 4(A)). The FO showed transverse cracks (Figure 4(A)–(C)) across the interface in the residual cement (labeled in white). Figure 5 shows the representative SEM images of the enamel molar surfaces after the shear bond testing. The specimen was bonded with FO with adhesive. Less than 50% of the adhesive remained on the tooth surface (ARI score: 1) (Figure 5(A)). The FO showed transverse cracks (Figure 5(A)–(C)) across the interface in the residual cement (labeled in white).. Figure 2. Representation of SEM images of the fractured enamel surface of a premolar specimen bonded with APC Plus with adhesive at 5 kV: (A) 50, (B) 100, and (C) 500 times magnification. More than 50% of the adhesive remained on the tooth surface (ARI score: 2). APC Plus showed transverse cracks (C) across the interface in the residual composite (labeled in white).. Figure 3. Representation of SEM images of the fractured enamel surface of a molar specimen bonded with APC Plus with adhesive at 5 kV: (A) 50, (B) 100, and (C) 500 times magnification. More than 50% of the adhesive remained on the tooth surface (ARI score: 2). APC Plus showed voids/bubbles (B and C) and transverse cracks (B and C) across the interface in the residual composite (labeled in white)..
(9) Figure 4. Representation of SEM images of the fractured enamel surface of a premolar specimen bonded with Fuji Ortho with adhesive at 5 kV: (A) 50, (B) 100, and (C) 500 times magnification. Less than 50% of the adhesive remained on the tooth surface (ARI score: 1). Fuji Ortho showed transverse cracks (A–C) across the interface in the residual cement (labeled in white).. Figure 5. Representation of SEM images of the fractured enamel surface of a molar specimen bonded with Fuji Ortho with adhesive at 5 kV: (A) 50, (B) 100, and (C) 500 times magnification. Less than 50% of the adhesive remained on the tooth surface (ARI score: 1). Fuji Ortho showed transverse cracks (B and C) and voids/bubbles (C) across the interface in the residual composite (labeled in white).. Figure 6. Representation of SEM images of the fractured enamel surface of a premolar specimen bonded with Wave MV Flow without adhesive at 5 kV: (A) 50, (B) 100, and (C) 500 times magnification. Less than 50% of the adhesive remained on the tooth surface (ARI score: 1)..
(10) Figure 7. Representation of SEM images of the fractured enamel surface of a molar specimen bonded with Wave MV Flow without adhesive at 5 kV: (A) 50, (B) 100, and (C) 500 times magnification. Less than 50% of the adhesive remained on the tooth surface (ARI score: 1).. 4. Discussion A review of the literature identified a large variety of methods used to measure the bond strength of orthodontic attachments. Therefore, in the present study, the suggestions made by Fox et al. [29] for in vitro bond strength testing in orthodontics were followed. The nature of the forces exerted onto orthodontic brackets in vivo and the nature of the stress distribution generated within the adhesive is complex, and likely to combine shear, tensile, and compressive force systems. In the present study, a shear method of testing was chosen as this was most likely to represent the clinical situation. The results of the current experiment partly reject the null hypothesis because the type of attachments and the cement selection modifies the SBS to human enamel, but otherwise the adhesive system application does not affect the effectiveness of adhesion (see the results from ANOVA in Table 1). When considering only the variable of cement, we found that among the new cements proposed in this study for bonding orthodontic attachments to the enamel surface, flowable composites showed the same values as the composite resin orthodontic XT and the compomer precoated. They also showed greater SBS values than the RMGICs. Flowable resins can flow easily onto a tube and bracket base and into an etched tooth structure, enhancing the potential of mechanical retention, so the permeability of the demineralized enamel microporosity adhesive and composite fluid is similar.[30] On the other hand, the RMGICs FO obtained the lowest SBS values on average. These findings are in agreement with previous studies that report lower SBS for RMGICs than composites.[16,23] However, a study by Bishara [7] reported the SBS for FO as not statistically different from XT. Another study reported FO as not statistically different from composite adhesives, as long as the enamel is etched.[31] Variations in the results between studies may be due to differences in research protocol and the technique sensitivity of the materials. Further investigation in this area is warranted. APC finally showed the same values as that of WF and XT. This precoated compomer displayed a well-defined resin penetration into the demineralized enamel (without the presence of voids/bubbles) and showed high ‘humectancy’ with all of the adhesive remaining on the enamel surface after debonding of the bracket (Figure 2(A)–(C)) and the tube (Figure 3(A)–(C)). In addition, it has the advantage of including fluoride and it decreases the potential risk of enamel decalcification.[24] When including the variable ‘adhesive’ to cement used, it was observed that it does not influence the SBS obtained, regardless of the cement used. Several studies performed on tubes agree with our data; [12,13] however, brackets have demonstrated higher SBS when using an intermediate adhesive.[14,17,18] Few studies are related to brackets and with the same characteristics of our study because cements proposed, or include chemical adhesion with the metal of orthodontic attachments and enamel hydroxyapatite being a compomer,[22] in the case of APC and FO. In the case of WF, it is able to penetrate the microporosity created by acid etching.[18] This causes for both brackets and tubes not to influence on the SBS values shown. In our study, the variant that really affected the adhesion values was the type of tooth (molar or premolar) and the type of attachment (bracket/tube) placed on it. When cementing a tube and bracket with the same cement, the tube showed higher SBS values, which are clinically desirable because tubes bonded to molars support greater occlusal forces than attachments bonded to teeth situated more anteriorly in the mouth.[27] This increase occurred in all SBS values except APC, WF without adhesive, and FO with and without adhesive. Tubes have a larger surface area (15.8 mm² – Smart Clip metal molar tube – and 15.3 mm2 – precoated composite APC Plus System tubes) than brackets (9.4 mm 2 – Victory brackets –.
(11) and 9.79 mm2 – precoated composite APC Plus System brackets), so it appears to be a relationship between the base surface area and the force to failure. Authors argue that each mm² increase in base surface area required an additional force of 3.11 N to debond the tube.[32] Moreover, all the elements used in this study had the same base mesh, both the Victory brackets as Smart Clip brackets/tubes and the APC showed a micro-etched 80-gauge mesh, along with the buccal indent and a correct anatomical fit.[33] For this reason, we exclude that the differences in SBS values among different subgroups may be due to variations in the base mesh attachment. No surface conditioning was applied that may influence on SBS values obtained, such as ceramic bracket silanization.[34] The ARI index provides information that has considerable clinical implications for clean-up following the debonding of brackets and tubes, so ARI and bond factors to consider. Clinicians should get a good adhesion of orthodontic attachments that preserve the enamel. A high ARI score implies that there is a higher risk of iatrogenic damage to the enamel surface when the residual resin composite is removed following debonding and clean-up procedures.[35,36] The ARI [28] data registered in Table 2 grouped residual adhesive on little adhesive remaining on the tooth surface (0–1 means that all or most of the resin is removed during debonding) (Figure 4(A)–(C); Figure 5(A)– (C)) and much adhesive remaining (2–3) (Figure 6(A)–(C); Figure 7(A)–(C)). Many SBS studies reported that metal tubes failed predominantly at the tube-adhesive interface.[37] Our results are in disagreement with these studies because it is shown that the failure occurred in almost all groups of tubes predominantly at the enamel-adhesive interface, though possibly a different tube base may adhere better. Smart Clip tubes have a new mesh called Optimesh XRT, a 100-mesh screen with additional notches that has been shown to increase up to 35% the resistance of cemented tubes.[38] Failure type showed differences when comparing tubes and brackets with XT with adhesive, WF and FO without adhesive and APC with and without adhesive, finding that ARI 0–1% was higher in molars that in premolars, except WF without adhesive (Figure 6(A); Figure 7(A)) and APC without adhesive. When we studied the percentage of enamel fractures to debonding orthodontic attachments, it was observed that the highest number of fractures (66.7% of the sample) occurred when cementing molars with APC and adhesive. This high percentage of fractures may be associated with the high number of mixed failures occurring (58.3%), due to high SBS values, which can be made at tube debonding. The large area occupied has difficulty in debonding from the resin tags formed by the chemical union of cement with hydroxyapatite,[22] producing numerous voids/bubbles, pores, and transverse cracks (Figure 3(C); Figure 4(B) and (C)) across the interface in the residual composite (labeled in white).. 5. Conclusion The use of an adhesive system when bonding brackets and tubes does not influence the SBS obtained, independently of the cement, so the adhesive can be discarded, saving clinical time and money. Under the tested experimental conditions, flowable composites and precoated compomers may be recommended to bond orthodontic brackets and tubes to provide an adhesive effectiveness similar to traditional cements, with the added advantage that the precoated compomer tube reduces the potential risk of enamel decalcification. Putting orthodontic composite cement and flowable composite on a molar tube instead of a premolar bracket significantly increases adhesion values, which is clinically desirable because tubes bonded to molars support greater occlusal forces than attachments bonded to teeth situated more anteriorly in the mouth. Failure type showed differences when comparing tubes and brackets applying traditional cements with adhesive, flowable composites and RMGICs without adhesive and precoated compomers with and without adhesive. Moreover, the highest number of fractures occurred when cementing molars with precoted tubes and adhesive..
(12) Acknowledgments The authors thank ‘Centro de láseres pulsados (CLPV)’ for their help with the scanning electron microscopy (SEM) and to 3M Unitek and GC America for providing the materials for this study.. References 1. Finnema KJ, Özcan M, Post WJ, Ren Y, Dijkstra PU. In-vitro orthodontic bond strength testing: a systematic review and meta-analysis. Am. J. Orthod. Dentofacial Orthop. 2010;137:615–622. 2. Millett DT, Mandall NA, Mattick RCR, Hickman J. Glenny A-M. Cochrane Database Syst. Rev. 2011;6:CD008236. doi: 10.1002/14651858 3. Banks P, Macfarlane TV. Bonded versus banded first molar attachments: a randomized controlled clinical trial. J. Orthod. 2007;34:128–136. 4. Viwattanatipa N, Prasertsangwal J, Juntavee N. Weibull analysis of shear/peel bond strength of orthodontic buccal tubes bonded to five resin composites. Orthod. Waves. 2008;67:100–127. 5. Newman GV. Epoxy adhesive for orthodontic attachments: progress report. Am. J. Orthod. 1965;51:901–912. 6. Eliades T, Eliades G, Brantley WA, Johnston WM. Polymerization efficiency of chemically cured and visible light cured orthodontic adhesives: degree of cure. Am. J. Orthod. Dentofacial Orthop. 1995;108:294–301. 7. Bishara SE, Gordon VV, Von Wald L, Olsen M. Effect of an acidic primer on shear bond strength of orthodontic brackets. Am. J. Orthod. Dentofacial Orthop. 1998;114:243–247. 8. Uysal T, Basciftci FA, Usumez S, Sar Z, Buyukerkmen A. Can previously bleached teeth be bonded safely? Am. J. Orthod. Dentofacial Orthop. 2003;123:628–632. 9. Park SB, Son WS, Ko CC, García-Godoy F, Park MG, Kim HI, Kwon YH. Influence of flowable resins on the shear bond strength of orthodontic brackets. Dent. Mater. J. 2009;28:730–734. 10. Albaladejo A, Montero J, Gomez de Diego F, López-Valverde A. Effect of adhesive application prior to bracket bonding with flowable composites. Angle. Orthod. 2011;81:716–720. 11. Vercelino C, Pinzan A, Gurgel JA, Bramante FS, Pinzan LM. In vitro study of shear bond strength in direct bonding of orthodontic molar tubes. Dent. Press J. Orthod. 2011;16:60.e1–60.e8. 12. Lobato M, Montero J, Ceballos L, Oyagüe R, Fuentes V, Sánchez JM, Albaladejo A. Effect of adhesive application on the shear bond strength of flowable composite resins and APC plus to orthodontic molar tubes. J. Adhes. Sci. Technol. 2012;27:811–819. 13. Lobato M, Montero J, Fuentes V, Albaladejo A. Effect of adhesive application on the shear bond strength of refrigerated and pre-heated of different composite resins to orthodontic molar tubes. J. Adhes. Sci. Technol. 2013;1–14. 14. Vicente A, Bravo LA. Evaluation of different flowable materials for bonding brackets. Am. J. Dent. 2009;22:111–114. 15. Lalani N, Foley TF, Voth R, Banting D, Mamandras AH. Polymerization with the argon laser: curing time and shear bond strength. Angle Orthod. 1999;69:525–534. 16. Meehan PM, Foley TF, Mamandras AH. A comparison of the shear bond strengths of two glass ionomer cements. Am. J. Orthod. Dentofacial Orthop. 1999;115:125–132. 17. D’Attilio M, Traini T, Di Iorio D, Varvara G, Festa F, Tecco S. Shear bond strength, bond failure, and scanning electron microscopy analysis of a new flowable composite for orthodontic use. Angle Orthod. 2005;75:410–415. 18. Tecco S, Traini T, Caputi S, Festa F, de Luca V, D’Attilio M. A new one-step dental flowable composite for orthodontic use: an in vitro bond strength study. Angle Orthod. 2005;75:672–677. 19. Ryou DB, Park HS, Kim KH, Kwon TY. Use of flowable composites for orthodontic bracket bonding. Angle Orthod. 2008;78:1105–1109. 20. Cal-Neto JP, Miguel JA, Zanella E. Effect of a self-etching primer on shear bond strength of adhesive precoated brackets in vivo. Angle Orthod. 2006;76:127–131. 21. Brennan JV, James D, Soo PP, Tzou S. The APC plus adhesive coated appliance system: features and technical review. Orthod. Perspect. 2004;11:5–9. 22. White LW. Glass ionomer cement. J. Clin. Orthod. 1986;20:387–391. 23. Cook PA. Direct bonding with glass ionomer cement. J. Clin. Orthod. 1990;24:509–511. 24. Forsten L. Fluoride release from a glass ionomer cement. Scand J. Dent. Res. 1977;85:503–504. 25. Trimpeneers LM, Verbeeck RMH, Dermaut LR, Moors MG. Comparative shear bond strength of some orthodontic bonding resins to enamel. Eur. J. Orthod. 1996;18:89–95. 26. Toledano M, Osorio R, Osorio E, Romeo A, Higuera B, Garcı’a-Godoy F. Bond strength of orthodontic brackets using different light and self-curing cements. Angle Orthod. 2003;73:56–63. 27. Millett DT, Cattanach D, McFadzean R, Pattison J, McColl J. Laboratory evaluation of a compomer and a resin modified glass. Am. J. Orthod. Dentofacial Orthop. 1999;69:58–63. 28. Artun J, Bergland S. Clinical trials with crystal growth conditioning as an alternative to acid etch enamel pretreatment. Am. J. Orthod. 1984;85:333–340. 29. Fox N, McCabe J, Buckley J. A critique of bond strength testing in orthodontics. Br. J. Orthod. 1994;21:33–43 30. Frankenberger R, Lopes M, Perdigão J, Ambrose WW, Rosa BT. The use of flowable composites as filled adhesives. Dent. Mater. 2002;18:227–238. 31. Lippitz SJ, Staley RN, Jakobsen JR. In vitro study of 24-h and 30-day shear bond strengths of three resin-glass ionomer cements used to bond orthodontic brackets. Am. J. Orthod. Dentofacial Orthop. 1998;113:620–624..
(13) 32. Talpur M, Cunningham S, Moles D, Jones S. The relationship between base dimensions, force to failure, and shear bond strengths of bondable molar tubes. Angle Orthod. 2012;3:536–540. 33. Weinberger GL. Utilizing the smartclip self-ligating appliance. In: 3M Unitek, editor. Orthodontic perspectives: the system approach. Vol. 23. Monrovia, CA: 3M Unitek Publication; 2005. p. 3–7. 34. Özcan M, Finnema K, Ybema A. Evaluation of failure characteristics and bond strength after ceramic and polycarbonate bracket debonding: effect of bracket base silanization. Eur. J. Orthod. 2008;30:176–182. 35. Zarrinnia K, Eid NM, Kehoe MJ. The effect of different debonding techniques on the enamel surface: an in vitro qualitative study. Am. J. Orthod. Dentofac Orthop. 1995;108:284–293. 36. Lorenzo MC, Portillo M, Moreno P, Montero J, Castillo-Oyagüe R, García A, Albaladejo A. In vitro analysis of femtosecond laser as an alternative to acid etching for achieving suitable bond strength of brackets to human enamel. Lasers Med. Sci. 2013. doi:10.1007/510103-013-1278-5. 37. Ostertag AJ, Dhuru VB, Ferguson DJ, Meyer RA. Shear, torsional, and tensile bond strengths of ceramic brackets using three adhesive filler concentrations. Am. J. Orthod. Dentofacial Orthop. 1991;100:251–258. 38. Reynolds IR. A review of direct orthodontic bonding. Br. J. Orthod. 1975;2:171–178..
(14)
Figure
+3

Documento similar