Automated sample preparation methods for the determination of trace level concentrations of environmental pollutants
227
0
0
Texto completo
(2) Automated sample preparation methods for the determination of trace level concentrations of environmental pollutants. Ph.D. in Science and Chemical Technology Department of Chemistry, Analytical Chemistry Area University of the Balearic Islands, Spain. Supervisors. Dr. Manuel Miró Lladó. Dr. Víctor Cerdà Martín. (Associate Professor). (Professor). Miss Warunya Boonjob Candidate.
(3) Associate Professor Doctor Manuel Miró Lladó and Professor Doctor Víctor Cerdà Martín at Department of Chemistry, Analytical Chemistry Area of the University of the Balearic Islands, Spain, as the supervisors of this Ph.D. dissertation. CERTIFY THAT: Miss Warunya Boonjob with X9237823-B has written herself the Ph.D. dissertation entitled “Automated sample preparation methods for the determination of trace level concentrations of environmental pollutants” which has been developed at the Department of Chemistry, Analytical Chemistry Area, University of the Balearic Islands, Spain, as a requirement to receive the Doctor of Philosophy (Ph.D.) in Science and Chemical Technology with International Mention.. Palma de Mallorca, 14 May 2012. Dr. Manuel Miró Lladó. Dr. Víctor Cerdà Martín. (Associate Professor). (Professor).
(4) i. ACKNOWLEDGMENTS I would like to express my sincerest gratitude to those who made it possible for me to complete this thesis. I’m grateful to each of them for the contributing to my graduate experience in science.. I would like to thank my supervisor, Dr. Manuel Miró, for being my supervisor and supporting me over the years. I also owe him lots of gratitude for valuable support, encouragement, inspiration, advices and supervision throughout my Ph.D. study. He has reached me to the stage of finalizing this long journey and also introduced me to the opportunity of participating in an internationally recognized research groups to gain knowledge and experiences. Many thanks also to the other supervisor, Dr. Víctor Cerdà, for my participation in “the analytical chemistry, automation and environment group” and for all his support.. I would like to extend my appreciation to Dr. Marcela A. Segundo for her encouragement and guidance and thoughtful advices during my research stay at the Physical-Chemistry Department, Faculty of Pharmacy, University of Porto, Portugal. I would like to thank Prof. Dr. José Luiz Fontes Costa Lima for his support, guidance and assistance.. I am grateful to Dr. José Benito Quintana and Dr. Rosario Rodil for their good counsels. Besides of being excellent supervisors, they were also very good friends in coffee break moment. I must admit that there were more friends in the Institute of Food Analysis and Research in Santiago de Compostela who deserve my acknowledgement and I would like to thank them all here for the good moment. I am thankful to Prof. Dr. Rafael Cela for his support and excellent facilities during my research stay at the Institute of food analysis and research, department of analytical chemistry at the University of Santiago de Compostela, Spain.. My appreciation also goes to Prof. Dr. Ari Ivaska for providing me with the Johan Gadolin fellowship during my stay in Turku, Finland, and thank him for the encouragement and appreciation of my research work.. My sincere gratitude is expressed to Prof. Dr. Spas D. Kolev at the School of Chemistry at the University of Melbourne, Australia, for the opportunity given to me to work in his laboratory,.
(5) ii. encouragement, guidance and interest in my work and thanks for being available whenever I needed help and advices and also students and staff in his group for being good friends and colleagues during my research stay there. A research paper is under preparation but wouldn’t be integrate in this thesis because of time constraints.. I would also like to thank the Conselleria d’Educació, Cultura i Universitats, Direcció General d´Universitats, Recerca i Transferència del Coneixement from the Government of the Balearic Islands for financial support through European Social Fund (ESF) during the time frame 20082012. Also thanks to Conselleria for travel grants to conduct research in different Universities, namely, University of Porto (Portugal), University of Santiago de Compostela (Spain) and the University of Melbourne (Australia). Furthermore, I wish to acknowledge the Johan Gadolin program for financial support during my research stay at Åbo Akademi University, Finland.. My compliments also go to the friends, colleagues and technical staffs at UIB, particularly to Dr. María Rosende, Mr. Josep Pablo Cánaves (HPLC), Ms. Maria Bel Cabra Jaume, Ms. Trinidad García Barceló, Dr. Ferran Hierro (SEM), Mr. Joan Cifre (XRD), Dr. Jose Gonzalez Morey (ICP) for their invaluable assistance in the laboratory.. Most importantly, I would like to express my love and deepest appreciation to my family, to Maneta and his family, and to friends for their continual support. Throughout my academic career, they always provided their love, support, and encouragement. Without them I would not be where I am today. Thank you so much.. Palma de Mallorca, 21-05-2012. Warunya Boonjob.
(6) iii. PREFACE. This thesis represents a part of the requirements for obtaining the International Ph.D. degree in Science and Chemical Technology at the Department of Chemistry of the University of the Balearic Islands (UIB). The study was financed with a Ph.D. stipend granted by the Conselleria d’Educació, Cultura i Universitats, Direcció General d´Universitats, Recerca i Transferència del Coneixement from the Government of the Balearic Islands through European Social Fund (ESF) during the time frame 2008-2012.. The papers presented in this thesis have been conducted in different Universities, namely: (i) Department of Chemistry at UIB, Spain, (ii) Physical-Chemistry Department, University of Porto, Portugal, (iii) Institute of Food Analysis and Research, Department of Analytical Chemistry, University of Santiago de Compostela, Spain, and (iv) Process Chemical Centre Laboratory of Analytical Chemistry, Åbo Akademi University, Finland.. This thesis is based on the following 7 publications in peer-reviewed journals, which are integrated parts of the thesis, describing the development of automatic sample preparation methodologies for extraction, fractionation, preconcentration, separation and determination of trace levels concentration of organic and inorganic priority pollutants in environmental samples exploiting flow-through based analytical approaches.. i.. Multiple Stirred-Flow Chamber Assembly for Simultaneous Automatic Fractionation of Trace Elements in Fly Ash Samples Using a Multisyringe-Based Flow System, Warunya Boonjob, Manuel Miró, and Víctor Cerdà, Analytical Chemistry, 2008, 80, 7319-7326.. ii.. Critical Evaluation of Novel Dynamic Flow-Through Methods for Automatic Sequential BCR Extraction of Trace Metals in Fly Ash, Warunya Boonjob, Maria Rosende, Manuel Miró, Víctor Cerdà, Analytical and Bioanalytical Chemistry, 2009, 394, 337-349.. iii.. On-line Hyphenation of Multimodal Microsolid Phase Extraction Involving Renewable Molecularly Imprinted and Reversed-Phase Sorbents to Liquid Chromatography for Automatic Multiresidue Assays, Warunya Boonjob, Yongliang.
(7) iv. Yu, Manuel Miró, Marcela A. Segundo, Jianhua Wang and Víctor Cerdà, Analytical Chemistry, 2009, 82, 3052-3060.. iv.. Flow-through Dispersed Carbon Nanofiber-Based Microsolid-Phase Extraction Coupled to Liquid Chromatography for Automatic Determination of Trace Levels of Priority Environmental Pollutants, Warunya Boonjob, Manuel Miró, Marcela A. Segundo, Víctor Cerdà, Analytical Chemistry, 2011, 83, 5237-5244.. v.. Automatic Dynamic Chemical Fractionation Method with Detection by Plasma Spectrometry for Advanced Characterization of Solid Biofuels, Warunya Boonjob, Maria Zevenhoven, Paul Ek, Mikko Hupa, Ari Ivaska, Manuel Miró, Journal of Analytical Atomic Spectrometry, 2012, 27, 841-849.. vi.. On-Line Coupling of Bead Injection-Lab On Valve Analysis to Gas Chromatography (BI-LOV-GC): Application to the Determination of Trace Levels of PolyChlorinated Biphenyls (PCBs) in Solid Waste Leachate Samples, Jose Benito Quintana, Warunya Boonjob, Manuel Miró, and Víctor Cerdà, Analytical Chemistry, 2009, 81, 48224830.. vii.. Elucidation of associations of ash-forming matter in woody biomass residues, Warunya Boonjob, Maria Zevenhoven, Paul Ek, Mikko Hupa, Ari Ivaska, Manuel Miró, Fuel, 2012 (Submitted)..
(8) v. ABSTRACT Automatic sample preparation methods are nowadays imperative to meeting compressed analytical timeline. As a result, mechanized sample preparation methods hyphenated with analytical techniques exploiting the different generations of flow analysis were in this dissertation developed and characterized for determination of organic and inorganic pollutants in environmentally relevant samples and industrial wastes. The thesis consists of two parts; the first is devoted to the development of automatic methods for dynamic chemical fractionation and investigation of bioaccessibility of inorganic trace contaminants in solid samples including coal fly ash and biomass fuels. The second part involved the development of automatic sorptive methods prior to chromatographic assays for extraction, preconcentration, separation and determination of trace concentration levels of selected pesticides (namely, triazine and metabolites thereof, and polychlorinated biphenyl compounds (PCBs)) in environmental samples at levels below those endorsed in current Directives. Dynamic flow-through fractionation is proven to afford more accurate evaluation of potentially bioaccessible metal pools under environmentally changing conditions than the equilibrium-based counterparts as a consequence of the solid/liquid equilibria shift and absence of metal redistribution effects. In fact, natural processes are occurring under dynamic rather than static conditions as assumed in classical methods. In this context, a novel miniaturized flow-based configuration capitalized on stirred-flow cell extraction was devised for automatic assessment of bioaccessible pools of trace metals (namely, Cu, Cd, Ni, Pb and Zn) in three samples at a time with no limitation of sample amount up to 1.0 g. A two-step sequential extraction scheme involving water and acetic acid (or acetic acid/acetate buffer) was utilized for reliable estimation of readily mobilisable fractions of trace elements in fly ash under worst-case conditions following the US-Toxicity Characteristic Leaching Test (TCLP), the results of which are reported in chapter 3 entitled “Multiple stirred-flow chamber assembly for simultaneous automatic fractionation of trace element in fly ash samples using a multisyringe-based flow system”. In dynamic extraction approaches, the solid sample under investigation is loaded into a suitable container, and exposed continuously to fresh extractant volumes by resorting to flow-based approaches. In this thesis, two dynamic extraction systems, the so-called sequential injection microcolumn extraction (SI-MCE) and sequential injection stirred-flow chamber extraction (SI-SFCE) were critically compared on the basis of the sample-containing container, sample representativeness, homogeneity of the sample, and analytical results aimed at further harmonization of this novel leaching methodology..
(9) vi. The three-step EU approved BCR sequential extraction scheme was performed in both automatic dynamic fractionation systems to evaluate the extractability of Cr, Cu, Ni, Pb and Zn in a standard reference material of coal fly ash (NIST 1633b) as detailed in chapter 4 entitled “Critical evaluation of novel dynamic flow-through methods for automatic sequential BCR extraction of trace metals in fly ash”. On-line coupling of SI-SFCE with ICP-OES was resorted to the exploration of the potential availability of ash-forming elements (e.g., K, Ca, Na and Mg) of biomass fuels (namely, bark and twigs) in flue gases, which is regarded as indicative of potential fireside problems (fouling and slagging in combustion devices). Experimental results are compiled in chapter 5 entitled “Automated dynamic chemical fractionation method with detection by plasma spectrometry for advanced characterization of solid biofuels”. The ultimate aim is to have a reliable system at hand to assist in deciding on a short notice whether or not firing biomass fuels on the basis of potential corrosion risks in combustion devices. For elucidation of metal-biomass/ash associations and investigation of the actual selectivity of extractants, dynamic extraction data was judiciously combined with spectroscopic characterization techniques, namely, scanning electron microscopy with energy dispersive X-ray fluorescence spectrometry (SEM-EDX) and X-ray diffraction (RXD) assays. These studies are shown in chapter 6 entitled “Elucidation of associations of ash-forming matter in woody biomass residues”.. In the second part of the thesis, automatic sample preparation methods have been developed using solid-phase extraction (SPE) approaches in flowing stream systems as a “front end” to chromatography techniques (GC or LC). Selective µSPE in a Bead-Injection (automatic renewable SPE) mode in the so-called multi-dimensional SPE combining molecular imprinted polymers (MIP) and reversed-phase sorbents (Oasis HLB) was utilized in Chapter 7 (Multimodal bead injection-based flow-through microextraction involving renewable molecularly imprinted and reversed-phase sorbents as a front end to liquid chromatography for automatic multiresidue assays) for selective preconcentration of triazine residues and their metabolites in crude soil extracts. The hyphenated µSPE-HPLC system was proven to provide sufficient sensitivity and reliability for determination of the target herbicides (namely, atrazine, simazine and propazine) and their dealkylated metabolites (namely, deisopropyltriazine (DIA) and deethylatrazine (DEA)) at concentration levels below those specified by current legislations for human water consumption and surface waters. In chapter 8 entitled “Flowthrough dispersed carbon nanofiber-based microsolid-phase extraction coupled to liquid chromatography for automatic determination of trace levels of priority environmental.
(10) vii. pollutants” dispersed carbon nanomaterials were handled as sorptive surfaces in an automatic flow-mode with minimum nanoparticle agglomeration and negligible pressure drop. The proof-of-concept of the method was demonstrated for µSPE and clean-up of chlorotriazine residues (namely, atrazine, simazine and propazine) and their dealkylated metabolites (namely, deisopropyltriazine (DIA) and deethylatrazine (DEA)) in both environmental waters and soil extracts. In Chapter 9 entitled “On-line coupling of bead injection-lab on valve analysis to gas chromatography (BI-LOV-GC). Application to the determination of trace levels of polychlorinated biphenyls (PCBs) in solid waste leachates” is for the first time demonstrated the coupling of mesofluidic platforms with renewable µSPE to GC for monitoring of organic pollutants. This new approach fostered the isolation, concentration, separation and determination of PCBs from raw landfill leachates..
(11) viii. RESUMEN La automatización de métodos de preparación de muestra es un tema de gran actualidad para reducir tiempos de análisis y mejorar las propiedades analíticas de ensayos químicos. Como consecuencia, en esta tesis doctoral se proponen nuevos métodos de preparación de muestra automáticos y acoplados a técnicas analíticas usando las diferentes generaciones de análisis en flujo para la determinación de contaminantes inorgánicos y orgánicos en muestras de interés ambiental y en residuos industriales.. La tesis doctoral se compone de dos partes: La primera se centra en el desarrollo de nuevos métodos automáticos de fraccionamiento químico dinámico e investigación de la bioaccesibilidad de trazas de contaminantes inorgánicos en muestras sólidas, como por ejemplo, cenizas volantes y biomasa vegetal. La segunda parte incluye nuevos métodos automáticos de (ad/ab)sorción previos a ensayos cromatográficos para la extracción, preconcentración, separación y determinación de niveles traza de varias familias de pesticidas (ej., triazinas y sus metabolitos, y compuestos bifenilos policlorados (PCBs)) en muestras ambientales a concentraciones inferiores a las legisladas.. A diferencia de los métodos de fraccionamiento basados en equilibrio, los métodos dinámicos en flujo son capaces de cuantificar con mayor exactitud la fracción de metales potencialmente bioaccesible al cambiar las condiciones ambientales como consecuencia del desplazamiento de los equilibrios sólido/líquido y la inexistencia de efectos de readsorción de metales. De hecho, los procesos naturales ocurren en condiciones dinámicas en vez de estáticas, que son asumidas en los métodos clásicos. En este contexto, se diseñó un sistema en flujo miniaturizado basado en la extracción en un reactor agitado para la cuantificación de forma automática de la fracción bioaccesible de elementos traza (Cu, Cd, Ni, Pb y Zn) en tres muestras simultáneamente y con cantidades de muestra variable hasta 1.0 g. Se utilizó un método de extracción secuencial de dos etapas basado en el uso de agua y ácido acético (o tampón ácido acético/acetato) como extractantes para la determinación de las máximas fracciones móviles de elementos traza en cenizas volantes mediante el procedimiento americano de lixiviación característica de toxicidad (US-TCLP). Los resultados experimentales se detallan en el capítulo 3 titulado “Fraccionamiento automático y simultáneo de elementos traza en cenizas volantes usando.
(12) ix. un sistema múltiple de reactores agitados”. En las extracciones dinámicas la muestra a analizar se coloca en un recipiente adecuado y se expone continuamente a nuevos volúmenes de extractante mediantes sistemas en flujo. En esta tesis, se comparan dos sistemas de extracciones dinámicas basados en el uso de microcolumnas o reactores agitados en sistemas en flujo (Inyección secuencial, SIA) en cuanto al tipo de recipiente para la muestra, representatividad y homogeneidad de la muestra y resultados analíticos, con el objetivo final de armonizar esta nueva metodología de lixiviación. Para ello se evaluó la extractabilidad de Cu, Ni, Pb and Zn en un material de referencia certificado de cenizas de carbón (NIST 1633b) utilizando el método BCR de tres etapas recomendado por la UE. Este trabajo se incluye en el capítulo 4 títulado: “Evaluación crítica de nuevos métodos dinámicos en flujo para la extracción automática de metales traza en cenizas usando el método BCR de extracción secuencial”. Para investigar la posible disponibilidad de elementos responsables de la generación de cenizas (ej., K, Ca, Na y Mg) en biomasa (corteza y ramas de árboles) en gases de combustión se diseñó un sistema en-línea acoplando extracción dinámica basada en reactores agitados a un espectrómetro de plasma acoplado inductivamente con detección óptica. Las fracciones móviles de metales alcalinos y alcalino-térreos son indicadoras de posibles problemas en los sistemas de combustión (formación de depósitos y pérdida de eficacia del reactor) dónde se utilice la biomasa como combustible. Los resultados experimentales se describen en el capítulo 5 titulado: “Método de fraccionamiento químico dinámico con detección elemental por espectrometría de plasma para la caracterización avanzada de biocombustibles sólidos”. El objetivo final de este trabajo es disponer de un método analítico fiable para decidir a la mayor brevedad posible si diferentes tipos de biomasa podrían ser utilizados como combustibles en base a los riesgos de corrosión en reactores. Para elucidar asociaciones entre ceniza/biomasa y metales e investigar la selectividad real de los extractantes, se combinaron los resultados de extracción dinámica con técnicas de caracterización espectroscópica, como por ejemplo, la microscopía electrónica de barrido con espectrometría de fluorescencia de rayos X dispersiva (SEM-EDX) y difracción de rayos X (RXD). Estos estudios se incluyen en el capítulo 6 titulado: “Elucidación de asociaciones de elementos responsables de la generación de cenizas en residuos de biomasa”.. En la segunda parte de la tesis se incluyen nuevos métodos automáticos de preparación de muestra basados en la extracción en fase sólida (SPE) en sistemas en flujo acoplados a técnicas cromatográficas (GC o LC) para la determinación de contaminantes orgánicos. En el capítulo 7 titulado: “Microextracción en fase sólida basada en bead-injection multimodal.
(13) x. usando polímeros de impresión molecular y materiales de fase reversa para análisis automático de multi-residuos de herbicidas/pesticidas” se propone un método µSPE selectivo con fase sólida renovable de forma automática, denominado Bead-Injection-SPE multidimensional, combinando polímeros de impresión molecular (MIP) y materiales de fase reversa (Oasis HLB) para la preconcentración selectiva de residuos de triazinas y sus metabolitos en extractos crudos de suelos. Se demostró que el acoplamiento µSPE-LC proporciona suficiente sensibilidad y fiabilidad para la determinación de los analitos a niveles de concentración inferiores a los legislados en aguas de consumo humano y aguas superficiales. En el capítulo 8 titulado: “Método de extracción en fase sólida miniaturizado basado en la dispersión de nanofibras de carbono en sistemas en flujo para la determinación automática de niveles traza de contaminantes orgánicos prioritarios mediante LC” se utilizaron nanomateriales de carbono como adsorbentes en técnicas en flujo sin problemas de aglomeración ni aumento de la sobrepresión en el sistema automático. Para demostrar el potencial analítico de este método se analizaron trazas de herbicidas de la familia de las clorotriazinas (atrazina, simazina y propazina) y sus metabolitos (desisopropiltriazina (DIA) y desetilatrazina (DIA) en aguas y extractos de suelos previa preconcentración por µSPE. En el capítulo 9 titulado: “Acoplamiento en-línea de bead-injection-Lab-on-Valve a cromatografía de gases (BI-LOV-GC). Aplicación a la determinación de niveles traza de bifenilos policlorados (PCBs) en lixiviados de residuos sólidos” se propone por primera vez en la bibliografía el acoplamiento de plataformas mesofluídicas con µSPE renovable a GC para la monitorización de contaminantes orgánicos. Mediante este nuevo método se determinaron PCBs en lixiviados crudos de residuos en vertederos previa extracción y concentración automática seguida de separación por GC..
(14) xi. CONTENTS Page Acknowledgements. i. Preface. iii. Abstract (English). v. Abstract (Spanish). viii. Table of contents. xi. List of abbreviation. xv. List of figures. xviii. List of table. xxiv. CHAPTER 1. INTRODUCTION. 1. Process analytical chemistry…………….. ………………………………………….... 1. 2. Sample preparation techniques …………………………………….…………………. 4. 2.1. Sample preparation techniques for the determination of organic pollutants in environmental samples………………………………………………………….. 4. 2.1.1 Liquid-liquid extraction (LLE) and liquid-phase microextraction (LPME)………………………………………………………………….. 5. 2.1.2 Solid phase extraction (SPE)……………………………………………. 8. 2.1.2.1. Molecular imprinted polymers SPE (MISPE)……………...... 14. 2.1.2.2. Carbon nanotubes SPE (CNT-SPE)………………………….. 16. 2.1.2.3. Mixed-mode and multi-dimensional SPE……………………. 18. 2.1.2.4 Automated and on-line SPE…………………………………….. 19. 2.1.2.4.1. Sequential injection SPE…………………….…………... 19. 2.1.2.4.2. Bead injection (BI)………..…………………………….. 22. 2.1.2.4.3. Lab-on-valve (LOV)…….…..…………………………... 24. 2.1.2.4.4. Bead injection - Lab-on-valve (BI-LOV)……………….. 26. 2.1.2.4.5. On-line coupling of SPE to column separation systems... 28. 1) On-line coupling of SPE with HPLC……………….. 28. 2) On-line coupling of SPE with GC………………….. 29.
(15) xii. CONTENTS (CONT.) Page 2.1.2.4.6 Automatic SPE using disposable extraction cartridges... 29. 2.1.2.4.7 Automatic SPE using traditional 96-well microplates.... 31. 2.1.2.4.8 Comparison of off-line versus on-line SPE methods….. 31. 2.1.3 Solid phase micro extraction (SPME)…………………………………. 32. 2.1.3.1. 35. 2.1.3.1.1. Direct immersion SPME mode………………………... 35. 2.1.3.1.2. Headspace SPME mode……………………………….. 36. 2.1.3.1.3. Membrane protected SPME mode…………………….. 36. Extraction modes with in-tube SPME…………………….... 37. 2.1.3.2. 2.1.3.2.1. Dynamic in-tube SPME………………………………... 37. 2.1.3.2.2. Static in-tube SPME time-weighted sampling………... 37. Interface to analytical instruments………………………….. 40. 2.1.3.3. 2.2. Extraction mode with coated fiber…………………………. 2.1.3.3.1. SPME-GC…………………………………………….... 40. 2.1.3.3.2. SPME-HPLC………………………………………....... 43. 2.1.3.3.3. In-tube SPME capillary-HPLC……………….……….. 44. 2.1.3.3.4. Automated SPME in 96-well plate…………………….. 45. 2.1.4 Stir bar sorptive extraction (SBSE)……………………………………. 46. 2.1.5 Microextraction by packed sorbent (MEPS)…………………………... 47. 2.1.6 Comparison of microextraction techniques………………………….... 48. Sample preparation techniques for metal fractionation and/or speciation for solid samples……………………………………………………………........ 49. 2.2.1 Extraction/leaching tests………………………………………………. 49. 2.2.1.1. Static leaching tests……………………………………….... 50. 2.2.1.1.1. Agitated single leaching tests………………………….. 51. 2.2.1.1.2. Non-agitated leaching tests……………………………. 53. 2.2.1.1.3. Sequential extraction tests……………………………... 53. 2.2.1.1.4. Concentration buildup tests……………………………. 54. Dynamic leaching tests……………………………………... 54. 2.2.1.2. 2.2.1.2.1. Serial batch leaching tests……………………………... 55.
(16) xiii. CONTENTS (CONT.) Page 2.2.1.2.2. Flow-around leaching tests…………………………….. 55. 2.2.1.2.3. Flow-through leaching tests………………………….... 56. 2.2.2 Speciation and fractionation of trace elements………………………... 57. 2.2.3 Bioavailability and bioaccessibility………………………………….... 59. 2.2.4 Targeted phases in environmental solid samples…………………….... 65. 2.2.4.1. Water-soluble fraction…………………………………….... 65. 2.2.4.2. Exchangeable fraction………...……………………………. 66. 2.2.4.3. Acid soluble fraction……………………………………….. 67. 2.3.4.4. Reducible fraction………………………………………….. 68. 2.3.4.5. Oxidisable fraction…………………………………………. 69. 3. Samples and target compounds investigated in this thesis…………………………... 70. 3.1. Fly ash……………………………………………………………………….. 70. 3.2. Woody biomass…………………………………...…………………………. 71. 3.3. Landfill leachate……………………………………………………………... 71. 3.4. Soil and water samples………………………………………………………. 72. 3.5. Inorganic trace contaminants in environmental solids…….………………... 72. 3.6. Organic trace level contaminants……………………………………………. 74. 3.6.1 Triazine and its methabolites………………………………………….. 75. 3.6.2 Polychlorinated biphenyls (PCBs)…………………………………….. 78. 4. References ……….………………………………………………………………….. 81. CHAPTER 2. Aims of thesis………………………….………………………….... 93. CHAPTER 3. Multiple. stirred-flow. chamber. assembly. for. simultaneous. automatic fractionation of trace elements in fly ash samples using a multisyringe-based flow system…………………………………. CHAPTER 4. Critical evaluation of novel dynamic flow-through methods for automatic sequential BCR extraction of trace metal in fly ash….…. CHAPTER 5. 97. 106. Automatic dynamic chemical fractionation method with detection by plasma spectrometry for advanced characterization of solid biofuels……………………………………………….….…………. 120.
(17) xiv. CONTENTS (CONT.) Page CHAPTER 6. Elucidation of associations of ash-forming matter in woody biomass residues…………………………….…………….………... CHAPTER 7. 130. On-line hyphenation of multimodal microsolid phase extraction involving renewable molecularly imprinted and reversed-phase sorbents to liquid chromatography for automatic multiresidue assays…..………………………………………………………….... CHAPTER 8. Flow-through dispersed carbon nanofiber-based microsolid-phase extraction coupled to liquid chromatography for determination. of. trace. levels. of. priority. automatic. environmental. pollutants…………………..…………………………………..…… CHAPTER 9. 157. 167. On-line coupling of bead injection-lab-on-valve analysis to gas chromatography(BI-LOV-GC):Application to the determination of trace levels of polychlorinated biphenyls (PCBs) in solid waste leachate samples…………………………..………....……….…….. 176. CHAPTER 10. Conclusions……………………….….…………..…………………. 186. APPENDIX. Curriculum vitae……………………………………..……………... 191.
(18) xv. LIST OF ABBREVIATIONS Abbreviation. Definition. A. surface area. AA. ascorbic acid. AAS. atomic absorption spectroscopy. ACE. automated cartridge exchange. AEDT. additional expenditure due to treatment. BCR. the commission of the european communities bureau. BI. bead injection. BI-SPE. bead injection solid phase extraction. CAR. carboxen. CC. central communication conduit. CL. central communication line. CMS. chromatographic mode sequencing. CNF. carbon nanofibers. CNTs. carbon nanotubes. C0. the initial concentration of a given analyte in the sample. CW. carbowax. D. detector. DCB. dithionite-citrate system buffer with NaHCO 3. DDD. dichlorodiphenyldichloroethane. DDE. dichlorodiphenyldichloroethylene. DDT. dichlordiphenyltrichloroethane. DLLME. dispersive liquid-liquid micro-extraction. DVB. divinylbenzene. EP TOX. extraction procedure toxicity. FAAS. flame atomic absorption spectroscopy. FC. flow cell. FIA. flow injection analysis. GF. gas filtration. HC. holding coil. HCH. hexachlorocyclohexanes.
(19) xvi. LIST OF ABBREVIATIONS (CONT.) HF-LPME. Hollow fiber-liquid phase microextraction. HLB. hydrophilic-lipophilic-balanced. HPD. high-pressure dispenser. HPLC. high-performance liquid chromatography. ICP-AES. inductively coupled plasma - atomic emission spectroscopy. ICP-MS. inductively coupled plasma - mass spectrometry. IR. infrared spectroscopy. ITEX. in-tube extraction. IUPAC. pure and applied chemistry. Kd. diffusion constant. K fs. a fiber coating/sample matrix distribution constant. L/S. liquid-to-solid ratio. LC-GC. liquid chromatography-gas chromatography. LC-MS/MS. liquid chromatography-mass spectrometry/mass spectrometry. LLE. liquid-liquid extraction. LogP ow. partition octanol-water logarithm. LOV. lab-on-valve. LPME. liquid-phase microextraction. M.P.. melting point. M.W t. molecular weight. MEPS. microextraction by packed sorbent. MIPs. molecular imprinted polymers. MISPE. molecularly imprinted solid-phase extraction. MRLs. maximum residue limits. MS. mass spectrometry. µSPE. micro solid phase extraction. MWCNTs. multi-walled carbon nanotubes. n. the number of moles extracted by the coating. NRC. national research council. OCI. on-column injector. OCPs. organochlorine pesticides. OSP. on-line sample preparation.
(20) xvii. LIST OF ABBREVIATIONS (CONT.) OX. oxalate. PA. polyacrylate. PAHs. polycyclic aromatic hydrocarbons. PCBs. polychlorinated biphenyls. PDMS. polydimethylsiloxane. PLE. pressurized liquid extraction. POPs. persistent organic pollutants. PROSPEKT. programmable on-line solid phase extraction. PTFE. polytetrafluoroethylene. PTV. programmable temperature vaporizer. RAM. restricted access materials. SBSE. stir bar sorptive extraction. SDME. single drop microextraction. SDU. solvent delivery unit. SES. sequential extraction schemes. SFOE. solidified floating organic drop microextraction. SIA. sequential injection analysis. SI-MC. sequential injection microcolumn extraction. SI-SFC. sequential injection stirred-flow cell extraction. SI-SPE. sequential injection solid phase extraction. SLME. supported liquid membrane extraction. SM&T. standards, measurements and testing program. SPE. solid-phase extraction. SPME. solid-phase microextraction. SVE. solvent vapour exit. SWCNTs. single-walled carbon nanotubes. TCLP. toxicity characteristic leaching procedure. TWA. time-weighted average. USEPA. united stated environmental protection agency. Vf. the fiber coating volume. Vs. the sample volume.
(21) xix. LIST OF FIGURES Figure 1. page Coupling of the analytical process with analyzer: a) off-line, b) at-line, c) inline, d) on-line methods; (S: sample, D: detector)……………………………... 2. 3. Diagram of the flow-based analysis system. S: sample, Rm: reagent; V1, V2, . . ., V5: three-way solenoid valves; B: reaction coil, Sc: glass separation chamber, Det: spectrophotometer, Vs1, Vs2 and Vs3: storing vessels; BP: peristaltic pump; x: joint device; W: waste. T1, T2, . . ., T5: valves timing course, Sp: sampling cycle, Ds: sample zone displacing step, St: phases separation step, Od: organic phase displacing step, Rs: signal reading step, and Ep: separation chamber emptying step. The shadow surface beneath of lines indicated that the associated valve was switched on……………………... 6. 3. Schematic diagram of microextraction system on a glass chip……………….... 7. 4. Schematic representation of automated LPME on a well plate………………... 7. 5. Conventional steps of manual SPE procedures……………………………….... 8. 6. Interactions between analytes and non polar bonded silica sorbents via van der Waals forces………………………………………………………………... 7. Interactions between analytes and polar sorbents via dipolar attraction or hydrogen bonding………………………………………………………………. 8. 10. 11. Interactions between analytes and ion-exchange sorbents (a) strong cation exchange sorbent and (b) strong anion exchange sorbent…………………….... 12. 9. Schematic illustration of SPE formats…………………………………………. 13. 10. Schematic depiction of the preparation of molecular imprints……………….... 14. 11. Carbon nanotubes structures; single-walled carbon nanotubes (SWCNTs), multi-walled carbon nanotubes (MWCNTs) and nano-stacked or nano-cone carbon nanofibers, CNF: carbon nanofibers………………………………….... 12. 16. Example of a mixed-mode sorbent consisting of silica modified with octyl (C8) alkyl chains and strong cation-exchange sites bonded on the same sorbent particle…………………………………………………………………. 18. 13. Multi-dimensional SPE mode approaches……………………………………... 19. 14. A typical SIA manifold. CC: central communication conduit, CL: central communication line, D: detector……………………………………………….. 19.
(22) xx. LIST OF FIGURES (CONT.) Figure. Page. 15. Potential of SIA for automated sample pretreatment…………………………... 16. Jet ring cell and SI system. (a) A narrow gap in the ring traps the beads and. 21. creates a jet. The resulting carrier flow travels radially from the jet, as shown in the experimental protocol, (1) the beads arrive and are trapped, and (2) a baseline is established during the wash period. The beads are (3) exposed to a sample solution, and (4) either the sample is eluted, or auxiliary reagents are perfused. At the end of the analysis, (5) the beads are discarded, (b) An SIA system modified for BI. Typically, the system uses a 1-mL syringe, a 2-uL jet ring cell, and 20-500 uL of injected sample and/or reagent…………………… 17. 24. Lab-on-valve shown mounted atop a six position valve. P1, P2 are channels leading to holding coils and syringe pumps. Sample (S) is shown in a flow through sampling port (#5) that is connected to the sample container and peristaltic pump. The flow cell (FC) is shown in absorbance configuration using two optical fibers facing each other. Arrows leading from P1 through #2 and into the flow cell indicate the valve position during the transport and measurement of reaction product………………………………………………. 18. 25. Diagram of a LOV system for bead injection (BI) incorporating two microcolumn positions (C1 and C2), along with a close-up of a packed renewable microcolumn………………………………………………………... 19. Schematic diagram of LOV microsystem incorporating a multipurpose flow cell configured for real time measurement of absorbance……………………... 20. 25. 26. Multipurpose flow cell, which is integrated in LOV, uses optical fibers encased in stainless steel tubing that is proportioned to leave a 30 μm gap between the casing and channel walls. The fibers can be readily reconfigured for absorbance (A, B) and fluorescence (C) measurement. Since the 30 μm gap allows liquid to escape, but retains beads, the flow cell can also be assembled to a jet ring cell configuration for absorbance (D), fluorescence (E) and reflectance (F) measurement. Black blocks indicate filled and closed. 21. channels…………………………………………………………………………. 27. Schematic diagram of valves configuration for on-line SPE-HPLC system….... 28.
(23) xxi. LIST OF FIGURES (CONT.) Figure 22. Page Scheme of an automated on-line SPE-GC system consisting of three switching valves. (V1-V3), two pumps (SDU pump and syringe pump) and. a GC system equipped with an SVE, and a mass-selective detector; 1, solvent channels; 2, purge leak restriction; 3, waste; 4, single-piston LC pump; 5, SPE precolumn; V1-V3, PROSPEKT valves; SDU, solvent delivery unit; SVE, solvent vapour exit; OCI, on-column injector…………………………... 23. 29. Schematic diagram of an on-line SPE-LC-MS system with Prospekt-2 device which is composed of an autosampler, a dual syringe high-pressure dispenser (HPD) and an automatic cartridge exchange (ACE) module…………………... 31. 24. Schematic comparison of off-line versus on-line SPE coupled to HPLC…….... 32. 25. Commercial SPME device……………………………………………………... 33. 26. Microextraction with SPME, 𝑉𝑓 : volume of fiber coating; 𝐾𝑓𝑠 : fiber/sample. partition coefficient, 𝑉𝑠 : volume of sample, 𝐶0 : initial concentration of analyte in the sample………………………………………………………………….... 27. 34. Two different implementations of the SPME technique: (a) polymer coated on outer surface of fiber, (b) polymer coated on internal surface of capillary tube……………………………………………………………………………... 34. 28. Configurations of SPME……………………………………………………….. 35. 29. Fiber SPME modes with coated fiber, (a) direct extraction, (b) headspace SPME, (c) membrane-protected SPME………………………………………... 30. In-tube extraction SPME modes; (a) passive in-tube SPME (b) dynamic in-tube SPME…………………………………………………………………... 31. 38. Different implementations of flow-through in-tube SPME. The position of the SPME capillary is highlighted with a solid dot in figures a and b……………... 32. 36. 38. Use of SPME for in-tube time weighted average sampling; a) schematic, b) adaptation of commercial SPME fibers……………………………………... 39. 33. Schematic diagram of GC-SPME injectors…………………………………….. 41. 34. Commercial SPME-GC autosampler (CTC Analytics CombiPAL); A: sample preparation/injection arm, B: sample trays, C: needle heater, D: heater/ agitator………………………………………………………………………….. 42.
(24) xxii. LIST OF FIGURES (CONT.) Figure. Page. 35. Principle and operation of in-tube extraction (ITEX)………………………….. 43. 36. Solvent desorption using for SPME-HPLC interface………………………….. 43. 37. Schematic diagram of automatic in-tube SPME-LC-MS with column switching………………………………………………………………………... 44. 38. SPME with modified needle to allow automatic in-tube extraction (ITEX)….... 45. 39. A schematic representation of the multi-fibre top plate used to automate SPME and desorption on a 96-well plate format. (a) For simplification, one row and one column of SPME fibers are shown to be inserted into the top plate. Fibers are constructed from PDMS-coated flexible wire, which is glued by high temperature epoxy resin into a section of 24 gauge needle. This construction can be press-fit into a Teflon block with holes of similar diameter. (b) The multi-fiber top plate can then be placed into commercial multi-well plates for extraction and desorption………………………….……... 45. 40. Schematic representation of a stir bar resorted to SBSE…………………….…. 46. 41. Schematic representation of the desorption unit for SBSE…………………….. 46. 42. Schematic picture of microextraction by packed sorbent (MEPS)…………….. 47. 43. A scheme of MEPS (the process is fully automated.)………………………….. 48. 44. Classification of sample preparation techniques……………………………….. 49. 45. Agitated leaching tests..……………………………………………………….... 51. 46. Static leaching tests…………………………………………..……………….. 53. 47. Sequential extraction tests……………………………………………………. 53. 48. Concentration buildup tests………………………………………………….... 54. 49. Serial batch tests………………………………………………………………... 55. 50. Flow-around leaching tests……………………………………………………... 55. 51. Flow-through leaching tests………………………………………………….. 56. 52. Diagram illustrating the bioavailable and bioaccessible fractions of a contaminant in soil as defined by physical location. It also describes the relationship of soil-associated contaminant molecules in relation to bioaccessible fraction…………………………………………………………….... 60.
(25) xxiii. LIST OF FIGURES (CONT.) Figure 53. Page In both soil and sediment, processes that determine exposure to contamination include release of a solid-bound contaminant (A) and subsequent transport (B), transport of bound contaminants (C), uptake across a physiological membrane (D), and incorporation into a living system (E). Note that A, B, and C can occur internal to an organism, such as in the lumen of the gut……... 54. 61. Relationship between metal mobility in the different operationally-defined phases and leachant strength of common chemical reagents used for sequential extraction……………………………………………………………. 55. 65. Potential interactions between fly ash as alternative material and the environment…………………………………………………………………….. 71. 56. Fate of organic contaminant residues in environmental soil………………….... 75. 57. Chemical structure of s-triazine with substituent positions……………………. 76. 58. Chemical structure of PCBs……………………………………………………. 78.
(26) xxiv. LIST OF TABLES Table. Page. 1. Extraction method fundamentals…………………………………………. 2. Some representative sequential extraction schemes for trace element fractionation………………………………………………………………. 3. 49. 64. Selected characteristics of some s-triazine herbicides and their derivatives…………………………………………………………………. 77. 4. Toxicity of selected triazine………………………………………………. 78. 5. IUPAC numbers and chloride atom positions of all PCB congeners……... 80.
(27) CHAPTER 1 INTRODUCTION.
(28) Chapter 1 INTRODUCTION 1. Process analytical chemistry The aim of process analytical chemistry is to provide both quantitative and qualitative information about a chemical process. Such information can be used not only to monitor and control a process, but also to optimize its efficient use of energy, time, and raw materials. Consequently, while saving costs and minimizing effluent release the product quality and consistency is improved.. Flow injection analysis (FIA) and sequential injection analysis (SIA) are techniques which are well suited for automation of traditional wet chemical methods. Because of their reliability, robustness and miniaturization of the entire analytical setup, flow techniques have found their path in the laboratory and as continuous process analytical methods. As a result of the increasing degree of automation in the chemical industry together with increasing demand of continuous effluent control by authorities, the concept of process analytical chemistry emerged within the traditional field of analytical chemistry [1]. Under sometimes very harsh conditions, with chemical and mechanical stresses, the analyzing equipment should deliver precise results at a 24/7 operation mode. The reproducibility of the analytical method is of greater importance than the absolute accuracy, because the calibration interval can be less frequent and most often changes in the process are of greater interest of process control reasons. Sampling is a key factor in process analytical chemistry, regardless if the sampling is done manually or automatically. No analytical method can compensate for non-representative samples [2].. In the concept of process analytical chemistry, five different ways of coupling the analytical process with the analyzer should be distinguished and will be later used in this dissertation for method development exploiting flow-based approaches. These are off-line, at-line, on-line, in-line and non-invasive methods (Fig. 1). The first two methods, off-line and at-line methods are distinguished by the requirement of manual removal of the sample and transport to the measuring instrument. In off-line methods, the sample is analyzed in a centralized facility with sophisticated, and perhaps even automated instrumentation (Fig. 1a). The advantages of this Chapter 1 Introduction. 1.
(29) Warunya Boonjob PhD dissertation. Science and Chemical Technology. approach include the economy and efficiency of time-sharing and availability of an expert staff for consultation, methods development, and maintenance. The disadvantages, which include the delay between submission of sample and reporting of results, the competition among users for the resources, have led to a second method that is at-line method. In this type of analysis a dedicated instrument is installed in close proximity to the process line (Fig. 1b). The advantages include faster sample processing, closer control of the analysis by the personnel, and employment of a simpler instrument with less cost and maintenance, and greater ease of use.. In on-line methods, an automated sampling system is used to extract the sample, condition it, and present it to an analytical instrument. Hereby the response time is very short allowing the operators to adjust process parameters before the quality goes out of given specifications. On-line methods can be divided into two subcategories (Fig. 1d): continuous and intermittent methods. In continuous on-line methods, a sample stream is continuously directed through the analytical instrument. Most gas analyses based on IR absorption, chemiluminescence, fluorescence and colorimetric methods belongs to this category. Intermittent methods require discrete sampling and a continuous method that permit the sample to flow continuously through the instrument. The analysis is performed by an automatic instrument, but the main difference compared to the continuous methods is that the result is not obtained continuously, but at discrete times. Gas chromatography, titrations and flow injection analysis are examples of intermittent on-line methods.. In-line methods are based on chemical analysis done in-situ, inside the process line, using a probe that is chemically sensitive (Fig. 1c). The in-line methods enable continuous monitoring of the process without any time delays. Such methods are for example pH and other ion selective electrodes. Disadvantages of in-line methods including difficulties of keeping the probe clean and making calibrations and maintenance.. Finally, the non-invasive methods include those methods where the probe or instrument does not need to be in physical contact with the sample. Hereby, the sometimes very difficult problems associated with process sampling can be omitted. This method obviously has a great deal in common with remote sensing and non destructive analysis.. Chapter 1 Introduction. 2.
(30) Department of Chemistry. University of the Balearic Islands. a). b) OFF-LINE. AT-LINE. Analytical Process line. Analytical Process Line Sampling. Sampling. transfer process. Analyzer c). Analyzer. IN-LINE. Central Laboratory Analytical Process Line. Analyzer. d) ON-LINE a) Continuous methods Analytical Process Line. Main stream flow. D. Sampling Analyzer. b) Intermittent methods Sample Injection. S Carrier stream flow. D. Figure 1. Coupling of the analytical process with analyzer: a) off-line, b) at-line, c) in-line, d) on-line methods, (S: sample, D: detector).. Chapter 1 Introduction. 3.
(31) Warunya Boonjob PhD dissertation. Science and Chemical Technology. 2. Sample preparation techniques In cases where the analytes of interest are present in complex matrices of, for example, environmental or biological origin, the sample is usually not suitable for direct introduction into the analytical instruments [3]. Sample preparation is aimed to transform target species to a form and concentration suitable for analysis and it is often considered to be a critical step in the analytical procedure [4] because it not only helps to achieve the low detection limits set by regulatory authorities by cleaning up the sample matrix but also acts to preconcentrate analytes of interest from a dilute sample matrix to a level of detection by an instrument of choice. In most of the analytical procedures, sample preparation is very often the slowest and the most costly part of the analytical process particularly when multi-step procedures are utilized which takes about 50-75% of the total time of the analysis [3]. For this reason, the faster this procedure can be done, the more quickly the analysis will be completed. This procedure must be highly reproducible and without appreciable loss of the analytes. The ideal of sample preparation method should involve a minimum number of working steps, be easy to learn, be environmentally friendly according to green chemical principles and be economical [5]. Further, as the number of samples grows high-throughput and fully automated analytical techniques becomes required.. 2.1 Sample preparation techniques for the determination of organic pollutants in environmental samples Several sample preparation techniques are available that offer different degrees of selectivity, enrichment capability, speed of operation and convenience to the analyst and environment. Modern techniques of sample preparation address the need for the reduction of organic solvent consumption, miniaturization, automation and ultimately on-site, in-situ or in-vivo sampling. Currently used sample preparation methods for assays of organic pollutants include liquidliquid extraction (LLE), liquid-phase microextraction (LPME), solid-phase extraction (SPE) and solid-phase microextraction (SPME). These approaches are usually easy to carry out and call for optimization of several parameters to enhance the performance of the overall analysis. Criteria for choosing a suitable method includes the physico-chemical properties of analytes, available time and equipment, specificity, and sensitivity. In general, several approaches are possible depending on the analytical problem.. Chapter 1 Introduction. 4.
(32) Department of Chemistry. University of the Balearic Islands. 2.1.1 Liquid-liquid extraction (LLE) and liquid-phase microextraction (LPME) Liquid-liquid extraction (LLE) is based on the partition of organic compounds between the aqueous sample phase and an immiscible organic solvent, which is non- or just slightly polar. Hexane and cyclohexane are frequently used for compounds with aliphatic moieties, whereas dichloromethane and chloroform are popular solvents for non- to medium-polar contaminants. After the extraction step concentration down to a few milliliters by rotary evaporation is performed.. Advantages are the simplicity of the procedure and inexpensive equipment (mostly glassware). Numerous methods have been developed for almost any analyte. Disadvantages include contamination and loss of sample (by adsorption to the glassware) due to several sample handling steps. Large volumes of solvents (sometimes chlorinated) are used and have to be disposed of. Solvents with high purity have to be used in trace analysis contributing to the high costs of the analyses. Usage in the field is not easy and methods are usually performed off-line in a manual or semi-automated mode [6]. Nowadays, LLE methods [7] are more and more replaced by sorptive extraction techniques (such as solid phase extraction (SPE) with advanced materials and solid phase microextraction (SPME), see next section) because they require minimal handling and consumption of organic solvents as well as offer high selectivity and enrichment factors.. Analysts performing LLE have experienced difficulties such as exposure to large volumes of organic solvents, formation of emulsions, and generation of mountains of dirty. To address these problems, scaling-down the size of LLE is more applicable than scaling-up, which is critical for productive preparation. In this context, miniaturization of LLE techniques has led basically to new methodologies i.e., single drop microextraction (SDME) [8-10], supported liquid membrane extraction (SLME), hollow-fiber liquid phase microextraction (HF-LPME) [9-12], dispersive liquid-liquid microextraction (DLLME) [9,10,13-15] and solidified floating organic drop microextraction (SFOE) [8-10] with extremely reduction of extraction solvent volume. The developments and advantages of these methods have been discussed in some comprehensive reviews published lately [3,16,17].. Representative examples of miniaturized systems for LPME including flow approaches, chipbased technology and 96-well robotic stations are given below. A cost-effective automatic flow-based system with on-line optical detection based on multicommutation and exploiting Chapter 1 Introduction. 5.
(33) Warunya Boonjob PhD dissertation. Science and Chemical Technology. the liquid-liquid extraction methodology has been published recently to meet green chemical principles [18]. The schematic diagram of the system is shown in Fig. 2.. Figure 2. Diagram of the flow-based analysis system. S: sample, Rm: reagent; V1, V2, . . ., V5: three-way solenoid valves; B: reaction coil, Sc: glass separation chamber, Det: spectrophotometer, Vs1, Vs2 and Vs3: storing vessels; BP: peristaltic pump; x: joint device; W: waste. T1, T2, . . ., T5: valves timing course, Sp: sampling cycle, Ds: sample zone displacing step, St: phases separation step, Od: organic phase displacing step, Rs: signal reading step, and Ep: separation chamber emptying step. The shadow surface beneath of lines indicated that the associated valve was switched on [18].. A LPME system on a glass chip was proposed for continuous solvent extraction, phase separation, and detection of atropine in synthetic urine, and of atropine and scopolamine in standard pharmaceuticals [19] but also for separation of Fe [20]. To this end, an aqueous Fe complex (Fe-4,7-diphenyl-1,10-phenanthroline-disulfonic acid) and a chloroform solution of capriquat (tri-n-octylmethylammonium chloride) were introduced separately into a microchannel (250 mm) to form a parallel two-phase laminar flow producing a liquid-liquid aqueous-organic interface (Fig. 3). The authors noted that in the microchannel, the aqueousorganic interface did not attain the upper-lower arrangement produced by differences in specific gravity normally observed in LLE. The extraction system required no mechanical stirring, mixing, or shaking.. Chapter 1 Introduction. 6.
(34) Department of Chemistry. University of the Balearic Islands. Figure 3. Schematic diagram of microextraction system on a glass chip [20].. Fully automated 96-well plate LPME extraction was reported by Peng et al. [21-23] in the last decade for processing of biological samples. They exploited the efficiency of 96-channel, programmable, robotic liquid handling workstation technology to automate methodology for this LLE variation. A LPME plate was prepared by adding inert diatomaceous earth particles to a 96-well plate with hydrophobic GF/C glass fiber bottom filters. Samples and solvents were added to the plate sequentially (Fig. 4). LPME occurred in the interface between the two liquid phases and on the surface of individual particles in each well plate. The organic phase extracts were eluted under gentle vacuum into a 96-well collection plate. The approach was used for initial purification of combinatorial library samples and for quantitative analysis of carboxylic acid-based matrix metalloprotease inhibitor compounds in rat plasma [23].. Figure 4. Schematic representation of automated LPME on a well plate [23].. Chapter 1 Introduction. 7.
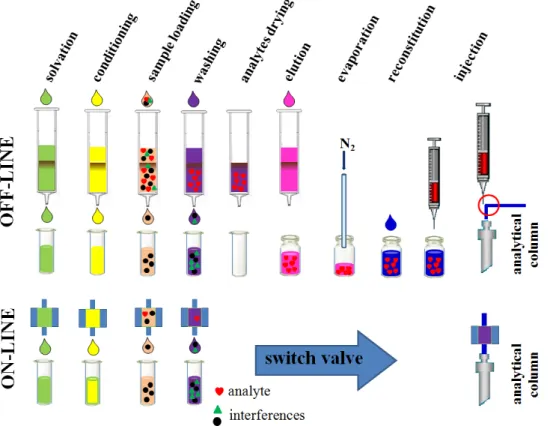
(35) Warunya Boonjob PhD dissertation. Science and Chemical Technology. 2.1.2 Solid phase extraction (SPE) Solid phase extraction (SPE) is a sample preparation technique based on principles similar to those of HPLC and is employed for the selective sorption of analytes of interest from liquid matrices. This transfer of analytes from the liquid sample matrix to the solid sorbent is influenced by the selection of appropriate conditions of the liquid matrix and the sorbent according to the physico-chemical properties of the analytes. A typical SPE protocol involves four steps; conditioning, loading, washing, and elution (Fig. 5) and defined in the following: i.. Conditioning - the sorbent is wetted with a suitable solvent to activate the functional groups on its surface. This step may be followed by an equilibration step whereby the wetting solvent is replaced by water.. ii.. Loading - the sample is percolated through the sorbent.. iii. Washing - interfering components of the matrix are removed while taking care not to elute the analytes as well. iv. Elution - analytes of interest are eluted with an appropriate solvent and further preconcentration takes place by evaporation with N 2 .. conditioning. loading. washing. elution. analyte interferences. 1. 2. 3. 4. Figure 5. Conventional steps of manual SPE procedures. Chapter 1 Introduction. 8.
(36) Department of Chemistry. University of the Balearic Islands. Several factors influence the efficiency of the SPE process but the two most important are retention and capacity. Retention of analytes on the sorbent should be maximum during the loading and washing steps but minimal during the elution step. To understand these, knowledge of the hydrophobic, polar and/or ionogenic properties of both the analytes and sorbent are required. The most common retention mechanisms in SPE are based on van der Waals forces (non-polar interactions), hydrogen bonding, dipole-dipole forces (polar interactions) and cation-anion interactions (ionic interactions). As a result, separation on SPE sorbents can be referred to as reversed phase, normal phase or ion exchange, respectively.. Reversed phase separation Reversed phase separation involves a polar or moderately polar sample matrix (such as water) and a non-polar sorbent. The analyte of interest is usually mid- to non-polar (such as pesticides), retention of the organic analytes onto the sorbent is mainly due to the attractive weak forces between the carbon-hydrogen bonds in the analyte and the functional groups on the sorbent surface (van der Waals forces). A non- to mid- polar (less polar than the sample matrix) solvent is then employed to disrupt the interaction between the analyte and sorbent.. Sorbent materials based on carbon, chemically modified silica and polymers have been employed as reversed phase SPE sorbents. Carbon-based media consist of graphitic, non-porous carbon with a high affinity for organic polar and non-polar compounds. Two types of graphitized carbon sorbents, graphitized carbon blacks and porous graphitic carbons, are commercially available for SPE applications. Retention of analyte is based primarily on the structure of the analyte rather than on the interactions of functional groups of the analyte with the sorbent surface. Bonded-silica is currently the most commonly used solid phase for reversed phase SPE. Reversed-phase bonded silica sorbents having alkyl groups covalently bonded to the silica gel backbone interact primarily with analytes via van der Waals forces (Fig. 6). Bonded silica sorbents are commercially available with many variations in the organic ligand group (R). Common bonded phases produced for reversed-phase applications include hydrophobic, aliphatic alkyl groups, such as octadecyl (C 18 ), octyl (C 8 ), ethyl (C 2 ), or cyclohexyl, covalently bonded to the silica gel backbone. Aromatic phenyl groups can also be attached. The R ligand can contain cyanopropyl or diol hydrophilic functional groups that result in polar sorbents used in normal-phase applications. Ionic functional groups, including carboxylic acid, sulfonic acid, aminopropyl, or quaternary amines, can also be bonded to the silica sorbent to produce ion exchange sorbents. Polymeric sorbents (e.g. Amberlite XAD Chapter 1 Introduction. 9.
Figure


![Figure 4. Schematic representation of automated LPME on a well plate [23].](https://thumb-us.123doks.com/thumbv2/123dok_es/3034244.562139/34.892.246.696.112.362/figure-schematic-representation-automated-lpme-plate.webp)

+7


![Figure 19. Schematic diagram of LOV microsystem incorporating a multipurpose flow cell configured for real time measurement of absorbance [73]](https://thumb-us.123doks.com/thumbv2/123dok_es/3034244.562139/53.892.238.705.325.609/figure-schematic-microsystem-incorporating-multipurpose-configured-measurement-absorbance.webp)


Documento similar
In the preparation of this report, the Venice Commission has relied on the comments of its rapporteurs; its recently adopted Report on Respect for Democracy, Human Rights and the Rule
The draft amendments do not operate any more a distinction between different states of emergency; they repeal articles 120, 121and 122 and make it possible for the President to
Astrometric and photometric star cata- logues derived from the ESA HIPPARCOS Space Astrometry Mission.
The photometry of the 236 238 objects detected in the reference images was grouped into the reference catalog (Table 3) 5 , which contains the object identifier, the right
Penelitian ini bertujuan untuk mendapatkan asal daerah bahan baku yang terbaik untuk pembuatan sirup gula kelapa dan untuk mendapatkan konsentrasi arang aktif yang
As a proof-of-concept, the trace determination of fourteen organic UV filters of a very wide polarity range (log P ow values from − 0.234 to 16.129) in environmental water
The Dome of the Rock does attest the existence, at the end of the seventh century, of materials immediately recognisable as Koranic in a text that not infrequently
It is generally believed the recitation of the seven or the ten reciters of the first, second and third century of Islam are valid and the Muslims are allowed to adopt either of
