Species delimitation and DNA barcoding of Atlantic
Ensis
(Bivalvia, Pharidae)
Joaquín Vierna
a,b, Joël Cuperus
c, Andrés Martínez-Lage
a, Jeroen M. Jansen
c, Alejandra Perina
a,b,
Hilde Van Pelt
c, Ana M. González-Tizón
aa Evolutionary Biology Group (GIBE), Department of Molecular and Cell Biology,Universidade da Coruña, A Fraga
10, A Coruña, E-15008, Spain
b
AllGenetics, Edificio de Servicios Centrales de Investigación, Campus de Elviña s/n, A Coruña, E-15008, Spain
c IMARES Wageningen UR, Ambachtsweg 8a, Den Helder, NL-1785 AJ, The Netherlands
Zoologica Scripta Volume 43, Issue 2, pages 161–171, March 2014
Issue online: 17 February 2014, Version of record online: 3 September 2013, Manuscript Accepted: 11 August 2013, Manuscript Received: 17 May 2013.
This is the peer reviewed version of the following article:
Vierna, J., Cuperus, J., Martínez-Lage, A., Jansen, J.M., Perina, A., Van Pelt, H. & González-Tizón, A.M. (2013). Species delimitation and DNA barcoding of Atlantic Ensis (Bivalvia, Pharidae). Zoologica Scripta, 43, 161–171.
which has been published in final form at https://doi.org/10.1111/zsc.12038. This article may be used for non-commercial purposes in accordance with Wiley Terms and Conditions for Self-Archiving.
Abstract
Ensis Schumacher, 1817 razor shells occur at both sides of the Atlantic and along the Pacific coasts of tropical west America, Peru, and Chile. Many of them are marketed in various regions. However, the absence of clear autapomorphies in the shell and the sympatric distributions of some species often prevent a correct identification of specimens. As a consequence, populations cannot be properly managed, and edible species are almost always mislabelled along the production chain. In this work, we studied whether the currently accepted Atlantic Ensis morphospecies are different evolutionary lineages, to clarify their taxonomic status and enable molecular identifications through DNA barcoding. For this, we studied 109 specimens sampled at 27 sites, which were identified as belonging to nine of those morphospecies. We analysed nucleotide variation at four nuclear (18S, 5.8S, ITS1, and ITS2) and two mitochondrial (COI and 16S) regions, although the 18S and 5.8S regions were not informative at the species level and were not further considered. The phylogenetic trees and networks obtained supported all morphospecies as separately evolving lineages. Phylogenetic trees recovered Ensis at each side of the Atlantic as reciprocally monophyletic. Remarkably, we confirm the co-occurrence of the morphologically similar E. minor (Chenu, 1843) and E. siliqua (Linné, 1758) along the NW Iberian coast, a fact that has been often overlooked. In South America, a relevant divergence between E. macha (Molina, 1792) individuals from Chile and Argentina was unveiled and suggests incipient speciation. We also confirm the occurrence of the North American species E. directus (Conrad, 1843) as far south as north-eastern Florida. Among the genomic regions analysed, we suggest COI as the most suitable DNA barcode for Atlantic Ensis. Our results will contribute to the conservation and management of Ensis populations and will enable reliable identifications of the edible species, even in the absence of the valves. The name Ensis coseli Vierna nom. nov. is proposed to replace E. minor Dall, 1899 non (Chenu, 1843).
Introduction
Ensis Schumacher, 1817 razor shells are a group of marine bivalve molluscs, characterised by their elongated shells, which are often found along the coasts at both sides of the Atlantic Ocean and along the Pacific coasts of tropical west America, Peru, and Chile. Several species are considered a delicacy and are marketed in some European, South American, and North American regions. For instance, in Chile alone, almost 6000 tons of E. macha (Molina, 1792) were landed in 1999 (Barón et al. 2004) and 1400 tons during 2005 (Ariz Abarca et al. 2007).
In the Atlantic, the genus is composed of 9–10 extant morphospecies that inhabit sandy and fine gravel substrata with limited exposure to wave action, from the intertidal to a depth of ca. 80 m (Cosel 2009). Ensis goreensis (Clessin, 1888) occurs in tropical West Africa, from the southern part of West Sahara to southern Angola (Lucira) and the Cape Verde Islands (Cosel 2009; and references therein). In Europe, there are four extant native Ensis, namely E. magnus Schumacher, 1817 [syn. E. arcuatus (Jeffreys, 1865)], E. ensis (Linné, 1758), E. minor (Chenu, 1843), and E. siliqua (Linné, 1758) (Cosel 2009). The American E. directus (Conrad, 1843) [syn. E. americanus (Gould, 1870)] is native to Atlantic North America, but was introduced to European coastal waters in 1978 (Cosel et al. 1982), where it now occurs from the North Sea to the Cantabrian Sea (Arias & Anadón 2012; Vierna et al. 2012). Another representative from Atlantic North America is the recently discovered E. terranovensis Vierna & Martínez-Lage, 2012, which was found off Newfoundland (Canada) and whose possible co-occurrence with E. directus is still unknown (Vierna et al. 2012). Ensis macha occurs along the southern coasts of Argentina, Peru, and Chile, and the remaining two taxa, E. minor Dall, 1899, and E. minor megistusPilsbry & McGinty 1943, are native to the south-eastern coast of the USA (mainly Florida and the Gulf of Mexico).
The name E. minor Dall, 1899 is a junior homonym of the European E. minor (Chenu, 1843), but so far, material and having compared it with specimens from some museum collections identified as E. minor sensu Dall (J. Vierna, A. M. González-Tizón, and A. Martínez-Lage, unpublished), we found a clear difference between both taxa in the position of the posterior adductor scar, which is a relevant taxonomic character in Ensis (see Cosel 2009; and Vierna et al. 2012). This scar is situated much more anterior to the pallial sinus in E. minor megistus than in the E. minor sensu Dall specimens examined. Therefore, we reject the synonymy in Huber (2010), which was provided without evidence, and we maintain E. coseli coseli and E. coseli megistus Pilsbry & McGinty, 1943 as subspecies, pending further studies, which may reveal species status for both. Molecular data of E. coseli megistus are currently unavailable, because to our best knowledge, there are no specimens available other than the valves that comprise the type material (see Pilsbry & McGinty 1943).
Despite their economic value, Ensis taxonomy is not well defined, due to the absence of clear autapomorphies in the shell and the sympatric distributions of some species. In fact, Cosel (2009) found some specimens that he considered as ‘intergrades’ of some European morphospecies, based on the analysis of the valves. This poorly defined taxonomy seems to be the cause of the mislabelling of specimens sold in European markets, where razor shells are often labelled as ‘Ensis ensis’ even though they usually are either E. magnus, E. siliqua, E. minor, or E. directus (pers. obs).
E. siliqua occur sympatrically along Atlantic Europe. According to the review by Cosel (2009) based on shell morphology, E. minor occurs in both Atlantic and Mediterranean Europe, whereas E. siliqua is restricted to the Atlantic. However, the Galician Regional Government (‘Xunta de Galicia’, NW Spain), does not distinguish between these two taxa, even though fishing and commercialisation of these bivalves are strictly regulated in the area. Interestingly, González-Tizón et al. (2013) supported both taxa as separate species according to cytogenetics.
Phylogenetic analysis of DNA sequences is a common and useful approach for species delimitation (e.g. Fontaneto et al. 2011; Puillandre et al. 2012; Ornelas-Gatdula et al. 2012; Esselstyn et al. 2012) that should be considered in the light of other evidences such as morphology, biogeography, and ecology (integrative taxonomy, see Dayrat 2005). Even though the term ‘species delimitation’ is sometimes used in a similar way to ‘DNA barcoding’ (the use of standard genomic regions for identifying organisms to the species level, Hebert et al. 2003), for clarity reasons, in this paper, we make the distinction between these approaches.
Hebert et al. (2003) proposed to use a fragment of the so-called COI mitochondrial gene as the standard barcode for animals, but they recognised that supplemental analyses of one or more nuclear genes could be required when hybridisation or introgression occurs. Therefore, to delimit species and to select a suitable genomic region that can be used as a DNA barcode, in this paper, we analyse variation not only at COI, but also at other mitochondrial and nuclear regions, in more than one hundred specimens that were identified as belonging to the Atlantic morphospecies. If this work is taken into account by policymakers, it will contribute to the conservation and management of Ensispopulations and will also enable a reliable labelling of the edible species, even in the absence of the valves (i.e. when processed as seafood), as well as a reliable identification of larvae and juvenile stages.
Materials and methods
Specimen identifications
We considered all currently known extant Atlantic Ensis morphospecies according to Cosel (2009) and Vierna et al. (2012). We studied a total of 109 specimens from 27 sampling sites (Table S1). Razor shell samples were obtained from museum collections and from colleagues, or they were directly sampled by us. Initial morphological identification of specimens was performed following Cosel (2009) and Vierna et al. (2012), and these were confirmed after phylogenetic analyses. Specimens were deposited in the collections of various natural history museums (see Table S1).
DNA isolation, PCR, and sequencing
Razor shell specimens were preserved either frozen or in 100% ethanol, except the E. goreensissample. In this case, dry tissue was obtained from the interior part of the shell and rehydrated in sterile milli-Q water.
DNA was extracted from muscle tissue using the NucleoSpin Tissue kit (Macherey-Nagel GmbH and Co. KG, Düren, Germany). The mitochondrial regions studied were fragments of the cytochrome oxidase subunit I gene (COI) and the 16S ribosomal RNA gene (16S). The nuclear ribosomal DNA genes and spacers considered were the internal transcribed spacers 1 and 2 (ITS1 and ITS2), the 5.8S ribosomal gene (5.8S), and a fragment of the 18S ribosomal gene (18S). The ITS1-5.8S-ITS2 region was amplified, cloned, and sequenced as a whole. The COI region was sequenced in all 109 specimens, whereas the five other regions were sequenced in a subset of specimens (Table S1).
species-specific internal primer pairs (COI-Europe-1-F, 5′ GGG ATT AGT TGG GAC TAG G; COI-Europe-1-R, 5′ GTT AAA GCC CCT GCC AA; COI-Europe-2-F, 5′ TAG AGT TAG CTC GTC CT; COI-Europe-2-R, 5′
AAA TAG GGT CAC CAC CA; COI-macha-F, 5′ TAG TTG GGA CTA GGT TGA GA; COI-macha-R, 5′
TAG GAT CTC CTC CAC CTC T; COI-coseli-F, 5′ GAT TCG GTT AGA GTT AGC TCG A; and
COI-coseli-R, 5′ GTT AAA GCA CCA GCT AGT ACA G). These new primers and the COI-directus ones (Vierna et al. 2012) were used in all COI amplification reactions. The primers used to amplify the 16S region were 16Sar and 16Sbr (Palumbi 1996). For the ITS1-5.8S-ITS2 region, we used the primers by Heath et al. (1995). Finally, for the 18S, we used the primers annealing at the 5′ and 3′ ends of the gene (Winnepenninckx et al. 1994). With the sequences obtained, we designed a pair of internal primers (18SintF, 5′ GAT CGT ACA ATC CTA CTT GG; and 18SintR, 5′ GCT CAT TAA CGG GAA CGA T) in GeneFisher. These new primers were employed in one of the E. magnus specimens analysed.
Each PCR (25 μL) contained ~25 ng of genomic DNA, 0.625 U of Taq DNA polymerase (Roche Diagnostics, Switzerland), 5 nmol of each dNTP (Roche Diagnostics), 20 pmol of each primer and the buffer recommended by the polymerase supplier. The general reaction conditions were as follows: an initial denaturation step at 94 °C for 3 min followed by 35 cycles of denaturation at 94 °C for 20 s; annealing at the following temperatures (LCO1490/HCO2198, 45 °C; Europe-1, 57 °C; Europe-2, 49 °C; COI-macha, 55 °C; COI-coseli, 52 °C; COI-directus, 48 °C; 16Sar/16Sbr, 44 °C; ITS1-5.8S-ITS2 region, 59 °C; 18S (Winnepenninckx et al. 1994), 56 °C; and 18Sint, 55 °C) for 20 s; extension at 72 °C for 30–50 s; and a final extension at 72 °C for 5 min. PCR products were run on 1 % agarose gels, stained with either ethidium bromide or Real Safe (Real, Valencia, Spain) and imaged under UV light.
All PCRs yielded single-band patterns, and therefore, amplicons were directly sequenced (except the ITS1-5.8S-ITS2 region ones), after being purified with ExoSAP-IT (USB, Santa Clara, CA, USA). PCR primers were used to sequence amplicons in both directions. In the case of 18S amplicons, we designed internal sequencing primers (18SseqF, 5′ CCC GTA ATT GGA ATG AGT AC; and 18SseqR, 5′ CGA ATC AAG AAA GAG CTC TC) to cover the whole amplified region. Due to the occurrence of intragenomic variation (Vierna et al. 2010), ITS1-5.8S-ITS2 PCR products were cloned using the TOPO TA cloning kit (Invitrogen, Paisley, UK). Transformant colonies were selected, and insert size was checked by PCR. We spread one clone per individual on an LB plate and let it grow overnight at 37 °C. Plasmids were purified with the QiaPrep Spin Miniprep Kit (Qiagen, Hilden, Germany), and they were sequenced using the M13 forward and reverse primers (supplied with the cloning kit). In addition to the sequences generated, some E. directus and E. terranovensis COI, ITS1, and ITS2 sequences (Vierna et al. 2012) from specimens sampled at Cobscook Bay, Long Pond, and The Wash were included in our data sets (see Table S2 for
accession numbers). New DDBJ/EMBL/GenBank accession numbers are
HF970346-HF970575 and HF975604-HF975627.
Bioinformatic analyses
The software BioEdit 7.0.9.0 (Hall 1999) and Geneious Pro 5.4.6 (Drummond et al. 2011) were used to examine the electropherograms. To search for stop codons that would be indicative of the presence of pseudogenes, the COI amino acid sequences were obtained from MEGA 5.03 (Tamura et al. 2011) using the ‘invertebrate mitochondrial genetic code’.
COI and 16S alignments were carried out in ClustalW 2.0 (Larkin et al. 2007) under default parameters. ITS1 and ITS2 sequences were aligned using the Q-INS-i strategy as implemented in MAFFT, version 7 (Katoh & Toh 2008; Katoh & Standley 2013). Highly variable regions were deleted from ITS1 and ITS2
alignments using Gblocks (Castresana 2000; Talavera & Castresana 2007) available
aligned each genomic region independently; then, we concatenated the sequences obtained from each specimen, and finally, we collapsed identical multigene sequences into sequence-types.
Phylogenetic trees were inferred under Bayesian (BA) and maximum-likelihood (ML) methods. BA was carried out using the software MrBayes 3.1.2 (Huelsenbeck & Ronquist 2001) from the CIPRES Science Gateway (Miller et al. 2010). Models of evolution for each partition (Table S3) were obtained from MrModelTest 2.3 (Johan Nylander, http://www.abc.se/~nylander/). The analysis was performed with 15 000 000 generations initiated with a random starting tree, sampling every 1000 generations, and allowing the program to estimate the likelihood parameters required. Stationarity was assessed using the Web-based software AWTY (Nylander et al. 2008). Results collected prior to stationarity were discarded as burn-in. ML phylogenies were obtained using RAxML 7.2.8 (Stamatakis 2006; Stamatakis et al. 2008) that was run from the same bioinformatic platform. This software is capable of assigning and estimating separate model parameters for individual genes of multigene alignments (Stamatakis 2006) and implements the general time-reversible (GTR) substitution model for all partitions. Node confidence was assessed using 1000 nonparametric bootstrap replicates (Felsenstein 1985). All phylogenetic trees were edited in Dendroscope 3 (Huson & Scornavacca 2012).
The best resolved phylogenetic trees based on the CO1+16S and ITS1+ITS2 data sets were subjected to a general mixed Yule coalescent analysis (GMYC) (Pons et al. 2006; Fontaneto et al. 2007). The model was performed with R 2.15.3 (R Development Core Team 2011) package splits (SPecies' LImits by Threshold Statistics) available at http://r-forge.r-project.org/projects/splits/. The required ultrametric phylogenetic trees were generated using penalised likelihood in r8s 1.70 and mid-point rooted (Sanderson 2003; Obertegger et al. 2012).
Even though we considered the possibility of including Pharus legumen (Linné, 1758) and Siliqua patula (Dixon, 1789) sequences as outgroups, they were too much divergent to reliably align them in the case of some genomic regions (ITS1 and ITS2). Therefore and considering that it is not necessary to use outgroups to check whether morphospecies are separately evolving lineages (e.g. Ley & Hardy 2010; James et al. 2010), we decided against using outgroup sequences, and thus, all the phylogenetic trees we present here are unrooted.
We also obtained phylogenetic networks for each alignment using the Neighbor-Net algorithm (Bryant & Moulton 2004) and uncorrected p-distances in SplitsTree4 (Huson & Bryant 2006). Finally, the mean intraspecific and interspecific uncorrected p-distances were obtained from MEGA 5.03. Their standard errors were calculated by 1000 bootstraps.
Results
In general, morphological identifications were confirmed by molecular data. However, the morphologically similar E. minor and E. siliqua were rather difficult to identify reliably in terms of shell morphology using available keys (Cosel 2009). Nonetheless, we were able to clearly differentiate them from the other European morphospecies E. magnus and E. ensis. Therefore, they were identified both using phylogenetic clustering and geographic information: because according to Cosel (2009), E. siliqua is restricted to the Atlantic, whereas E. minor occurs both in the Atlantic and in the Mediterranean, the Atlantic specimens that clustered with the Mediterranean ones were considered as E. minor.
These specimens are, to our knowledge, the first confirmed record of E. directus as far south as north-eastern Florida.
The COI alignment (303 bp) did not display, as expected, any gap. No stop codons were found, and there were only three mutations (from three different sequences) that lead to amino acid substitutions. The proportion of variable sites (s) for this region was s = 0.337. Alignments of 16S (340 bp), 18S (1271 bp) and 5.8S (157 bp) sequences were straightforward. The proportion of variable sites was s = 0.126, s = 0.009 and s = 0.032, respectively. There was only one gap position, in the 18S region.
Regarding the alignments of ITS1 and ITS2 sequences, 285 (44 % of the original 636 positions) were retained after the Gblocks filtering in the case of ITS1. For ITS2, 228 (62 % of the original 364 positions) were kept after filtering. The proportion of polymorphic sites after filtering was s = 0.154 and s = 0.224, respectively.
The number of haplotypes obtained from the COI alignment was 81 of 109 sequences (74.3 %), whereas the 16S alignment yielded 29 haplotypes of 80 sequences (36.2 %). The 18S region produced six sequence-types of 13 sequences (46.1 %), the 5.8S region yielded only five sequence-types of 41 sequences (12.2 %), and both ITS1 and ITS2 regions yielded 19 of 41 sequences (46.3 %) each. The COI+16S multigene alignment produced 70 haplotypes of 80 sequences (87.5 %), whereas the ITS1+ITS2 alignment yielded 29 sequence-types of 41 sequences (70.7 %).
Sequence-type distributions of the 18S and 5.8S regions (that due to their conservation, lacked resolution at the species level and were not considered in the subsequent analyses) were as follows: E. magnus, E. siliqua, and E. minor shared the same 18S sequence-type. However, E. directus, E. terranovensis, E. macha, E. coseli coseli, and E. ensis had one (non-shared) sequence-type each. The two individuals of E. macha from Chile and Argentina whose 18S region was sequenced displayed the same sequence. In the case of the 5.8S region, one of the five sequence-types obtained was shared by all North and South American species. Another one was shared by all European species. The remaining three corresponded to one E. terranovensis, one E. directus, and one E. magnus sequence.
All phylogenetic trees obtained, based either on mitochondrial or on nuclear DNA, recovered morphospecies at each side of the Atlantic as reciprocally monophyletic (Figs 1 and 2; Figs S1-S6).
Trees based on the COI alignment recovered all morphospecies as monophyletic, with the exception of E. terranovensis in the BA analysis, and both E. terranovensis and E. magnus in the ML analysis (Fig. S1). The morphospecies E. goreensis was represented by only one haplotype.
The 16S alignment produced one haplotype that was shared between E. terranovensis and E. directus. Both BA and ML phylogenetic trees clustered E. magnus and E. ensis sequences on monophyletic groups. As for E. coseli coseli and E. goreensis, only one haplotype was obtained per morphospecies. In the BA analysis, sequences from E. macha, E. siliqua, and E. minor were clustered in monophyletic groups as well (see Fig. S2).
Figure 1. Phylogenetic relationships among mitochondrial (COI+16S) haplotypes. Haplotype frequencies are shown in parentheses in the tree, and at each terminal node, in the network. Terminal nodes are coloured according to which Ensis species the sequence was obtained from. —A. Unrooted Bayesian phylogenetic tree. Node confidence
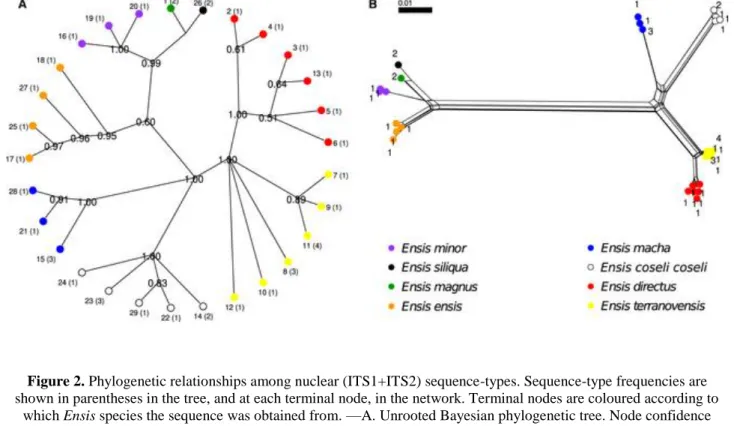
Figure 2. Phylogenetic relationships among nuclear (ITS1+ITS2) sequence-types. Sequence-type frequencies are shown in parentheses in the tree, and at each terminal node, in the network. Terminal nodes are coloured according to
which Ensis species the sequence was obtained from. —A. Unrooted Bayesian phylogenetic tree. Node confidence values below 0.5 are not shown. —B. Phylogenetic network constructed using the Neighbor-Net algorithm and
uncorrected p-distances.
No E. goreensis ITS1-5.8S-ITS2 sequences could be obtained, probably due to degradation of the extracted DNA, and therefore, we lack nuclear DNA data for this morphospecies. Regarding the ITS1 analysis, sequences from E. macha, E. siliqua, E. magnus, and E. minor yielded only one sequence-type per species. Sequences from the other morphospecies were clustered into monophyletic groups, in both BA and ML phylogenetic trees (see Fig. S4).
In the ITS2 analysis, E. siliqua, E. magnus, and E. ensis yielded one sequence-type each. The BA tree recovered all morphospecies as monophyletic with the exception of E. directus and E. terranovensis, which formed two polytomies. These two species showed a paraphyletic pattern in the ML phylogeny, whereas all others were recovered as monophyletic (see Fig. S5).
Finally, in the ITS1+ITS2 analysis, there were two morphospecies (E. magnus and E. siliqua) that yielded only one sequence-type each. The BA phylogenetic tree recovered all other morphospecies as monophyletic, with the exception of E. terranovensis, which formed a polytomy. Support values for each of these clades ranged between 0.95 and 1.00. In the ML tree, all morphospecies were recovered as monophyletic, and support values were high (94–100) except for E. terranovensis and E. minor (see Fig. 2; Fig. S6).
The GMYC analysis based on the BA COI+16S phylogenetic tree revealed a model with eight different entities (confidence interval 8–11) as the most likely (likelihood of the null model, 338.693; maximum likelihood of the GMYC model, 352.236; likelihood ratio, 27.085; LR test < 0.0001). The number of morphospecies included in the analysis (nine) falls within the confidence interval. Therefore, the GMYC analysis based on the COI+16S phylogeny is consistent with the existence of the nine different species.
way as for the CO1+16S phylogeny, the GMYC analysis based on the ITS1+ITS2 data set is consistent with the existence of eight different species (in this case, there were no E. goreensis sequences available).
The phylogenetic networks obtained based on the COI, COI+16S, ITS1, and ITS1+ITS2 alignments clearly supported the existence of groups that perfectly matched the currently described morphospecies (Figs S1 and S4; Figs 1 and 2).
The 16S region was not able to completely differentiate among North American species because, as already mentioned, there was one haplotype shared by two of them. Regarding European species, the two E. siliqua haplotypes were not clustered together in the network (see Fig. S2).
The ITS2 phylogenetic network clustered the sequence-types obtained from E. terranovensis and E. directus specimens and also the ones obtained from E. siliqua, E. magnus, and E. ensis (see Fig. S5).
We calculated the intraspecific and interspecific mean p-distance values for the COI, 16S, ITS1, and ITS2 regions using the trimmed alignments containing all sequences (i.e. not the sequence-type alignments; Tables S4–S7).
We also calculated interpopulation mean p-distances for E. macha individuals from Puerto Lobos (Argentina) and Playa Dichato (Chile). In this case, no ITS1 or ITS2 values were obtained because the number of sequences available was too small. Divergence between the two E. macha populations was in some cases more pronounced than interspecific divergence. For instance, 16S interpopulation divergence was 0.011 ± 0.004, whereas interspecific divergence in some species pairs was equal or lower: E. directus and E. terranovensis, 0.003 ± 0.003; and E. siliqua and E. magnus, 0.011 ± 0.005 (Table S5). Similarly, COI interpopulation divergence was 0.038 ± 0.010, quite comparable to that calculated for E. directus and E. terranovensis (0.058 ± 0.012) and for E. siliqua and E. magnus(0.064 ± 0.012; Table S4).
Discussion
Species delimitation and molecular systematics
Our results support that the nine morphospecies under study are different evolutionary lineages, according to both nuclear and mitochondrial DNA, and in agreement with Cosel (2009). Therefore, they should be considered as nine different species.
The split between E. directus and E. terranovensis was already demonstrated by Vierna et al. (2012) using morphometrics and nucleotide variation at COI, ITS1, ITS2, and ANT (a fragment of a nuclear single-copy region coding adenine nucleotide translocase). However, in the present work, the split between the two species was not evident for all genomic regions analysed, because in some phylogenetic trees E. terranovensis, sequences formed polytomies instead of clustering in a clade. These polytomies could reflect that the two sister species underwent speciation rather recently, a fact that is further supported by the shared 16S haplotype, which is an example of incomplete lineage sorting among closely related taxa.
In Atlantic North America, three lineages were found: whereas E. directus and E. terranovensis were supported as sister species, the position of E. coseli coseli was variable. This taxon branched off as sister to E. directus and E. terranovensis in most of the analyses, supporting the monophyly of North American species, and as sister to E. macha, in some others. Interestingly, we have confirmed the occurrence of E. directus as south as north-eastern Florida.
In South America, E. macha specimens sampled at Playa Dichato and Puerto Lobos were rather divergent, again showing phylogeographic structure. The number of individuals analysed was small and prevents any general conclusion about possible population structure of these razor shells along their distributional ranges. However, the degree of divergence displayed by individuals from Playa Dichato and Puerto Lobos according to COI and 16S was in some cases even higher than that obtained for some other Ensis interspecific comparisons, and suggests incipient speciation. Significant population structure has also been found in marine gastropod Nacella magellanica (Gmelin, 1791) populations from Atlantic and Pacific Patagonia (González-Wevar et al. 2012). Taken into account that Camus (2001) identified a major biogeographic break in Chile at 41–43°S and that Playa Dichato is located in the north of these parallels, this biogeographic break could also explain population structure in E. macha. Our results highlight the need to study the population structure and diversity of this razor shell along its entire distribution (a survey on shell morphometry along the Patagonian coast is available, Márquez & Van der Molen 2011) to design conservation plans for this intensively fished species (see Hernández et al. 2011).
Unfortunately, the phylogenetic relationships between species within the European/African clade were not well resolved as evidenced by the presence of polytomies and low node support values.
Remarkably, we have demonstrated that E. siliqua and E. minor are different species, despite their morphological similarities. Our results agree with the taxonomic revision by Cosel (2009) based on shell morphology and with González-Tizón et al. (2013) who found important differences among the karyotypes of both species. accentuates the importance of DNA barcoding in research fields other than ecology and biodiversity.
Given that both E. siliqua and E. minor co-occur in Atlantic Europe and that it is not always possible to reliably differentiate among specimens based on a visual inspection of the shell, we suspect that in some previous reports on E. siliqua (Darriba et al. 2005; Arias et al. 2011; Arias-Pérez et al. 2012; Varela et al. 2012; Rufino et al. 2012), specimens from both species could have been confused. The authors presumably determined specimens based on shell morphology, although details on how identifications were carried out were not provided.
Even though Varela et al. (2012) found differentiation among northern and southern ‘E. siliqua’ populations, Arias et al. (2011) and Arias-Pérez et al. (2012) found a Portuguese population clustering with an Irish population. In the morphometric study by Rufino et al. (2012), they described three different ‘morphs’ based on shell morphometrics, one from an Irish population and two others from Portuguese populations. Taking our results into account, the differentiation that they found among populations might have been produced by a two-species scenario, rather than by population isolation. This can be tested by DNA barcoding some of the specimens analysed in those surveys.
and E. minor in Bandol, La Capte, Lira, and Ría de Vigo, one might think that E. minor is distributed from the central Galician ‘rías’ to the Mediterranean, whereas E. siliqua has a more northern distribution. However, the distribution range of E. minor north of Galicia and northward to Scotland was confirmed by Cosel (2009) based on shell morphology of his own samplings, as were different biotopes and the sympatric occurrence of E. siliqua in the same areas. Only in the southern part of Brittany Peninsula, were a few morphological intergrades of E. minor x E. siliqua found (Cosel 2009).
DNA barcodes for Atlantic Ensis
The ideal DNA barcode should meet the following conditions: (1) suitable primer pairs should be available, (2) sequence-types should not be shared even by specimens from closely related species, (3) alignments should be straightforward, (4) intragenomic variation should be low to avoid cloning of PCR products before sequencing, and (5) sequences obtained from individuals from the same species should cluster together (and apart from sequences obtained from other species) in a phylogenetic tree or network.
In Atlantic Ensis, condition (1) was met by all genomic regions considered, even though in the case of COI, several primer pairs were used. Condition (2) was not met by 5.8S nor by 18S regions so they were not considered in subsequent phylogenetic analyses. Even though 5.8S is not widely used in phylogenetics due to its short length and scarce polymorphism, the 18S region is a popular phylogenetic marker. In Ensis, 18S was useful in differentiating the European/African clade from the American clade, but this region failed to differentiate among closely related species, in agreement with Tang et al. (2012). Despite the fact that the 16S region did not meet condition (2), it was a useful marker for species delimitation. Conditions (3) and (4) were not met by ITS1 nor by ITS2, as already reported by Vierna et al. (2010), but were suitable for species delimitation. Finally, even though condition (5) depends on the particular phylogenetic analyses carried out, it was met by COI and ITS1 in most cases (very clearly in phylogenetic networks, but not as clear in some phylogenetic trees, especially for E. directus and E. terranovensis sequences). Therefore, we suggest using COI as the main DNA barcode in Atlantic Ensis species.
Even though some authors have attempted to establish molecular identification protocols for some Ensis using PCR and PCR-RFLPs (Fernández-Tajes & Méndez 2007; Freire et al. 2008; Fernández-Tajes et al. 2010), because species boundaries were still unclear at that time, the proposed methodologies might give misleading results in some cases. Moreover, DNA barcoding is a much more informative (and therefore reliable) approach compared with PCR/PCR-RFLP based methods, even though the cost is somewhat higher due to the additional sequencing step.
Conclusion and future directions
In this work, using mitochondrial and nuclear DNA sequence data, we have clarified the species limits within Atlantic Ensis. In addition, we show that DNA barcoding is capable of identifying Ensisspecimens to the species level and suggest taking advantage of this methodology for reliable and inexpensive identifications of specimens.
Finally, we encourage regional authorities to study the species composition of razor shell communities and establish specific conservation and managing plans, at least in the areas where Ensis spp. are an economic resource.
Acknowledgements
Team at IMARES Wageningen UR, Diana Fernández, Diego Fontaneto, David Palmer, Emilie Egea, José María Casariego, José Fernández, Katrine Worsaae, Iben Heiner, Javier De Andrés, John Slapcinsky, Jon Havenhand, L. Kirkendale, Lobo Orensanz, M. Pin, Meromar Seafoods BV, Nicolas Puillandre, Philip Sargent, Pablo Pita, Rafael Araujo, Ray J. Thompson, R. O'Donnell, Rüdiger Schmelz, Rudo von Cosel, Stephen Tettelbach, Tim Sheehan (Gulf of Maine).
References
Arias, A. & Anadón, N. (2012). First record of Mercenaria mercenaria (Bivalvia: Veneridae) and Ensis directus(Bivalvia: Pharidae) on Bay of Biscay, Iberian Peninsula. Journal of Shellfish Research, 31, 57–60.
Arias, A., Fernández-Moreno, M., Fernández-Tajes, J., Gaspar, M. B. & Méndez, J. (2011). Strong genetic differentiation among east Atlantic populations of the sword razor shell (Ensis siliqua) assessed with mtDNA and RAPD markers. Helgoland Marine Research, 65, 81–89.
Arias-Pérez, A., Fernández-Tajes, J., Gaspar, M. B. & Méndez, J. (2012). Isolation of microsatellite markers and analysis of genetic diversity among east Atlantic populations of the sword razor shell Ensis siliqua: a tool for population management. Biochemical Genetics, 50, 397–415.
Ariz Abarca, L., Cortés Segovia, C., González Yáñez, J., Barahona Toledo, N. & Nilo Gatica, M. (2007). Situación actual de la pesquería del recurso huepo (Ensis macha) en la VII Región. Instituto de Fomento Pesquero (Accessed at http://www.fip.cl/FIP/Archivos/pdf/informes/inffinal%202006-44.pdf).
Barón, P. J., Real, L. E., Ciocco, N. F. & Ré, M. E. (2004). Morphometry, growth and reproduction of an Atlantic population of the razor clam Ensis macha (Molina, 1782). Scientia Marina, 68, 211–217.
Bryant, D. & Moulton, V. (2004). Neighbor-Net: an agglomerative method for the construction of phylogenetic networks. Molecular Biology and Evolution, 21, 255–265.
Camus, P. A. (2001). Biogeografía marina de Chile continental. Revista Chilena de Historia Natural, 74, 587–617.
Castresana, J. (2000). Selection of conserved blocks from multiple alignments for their use in phylogenetic analysis. Molecular Biology and Evolution, 17, 540–552.
Cosel, von R. (2009). The razor shells of the eastern Atlantic, part 2. Pharidae II: the genus Ensis Schumacher, 1817 (Bivalvia, Solenoidea). Basteria, 73, 1–48.
Cosel, von R., Dörjes, J. & Mühlenhardt-Siegel, U. (1982). Die amerikanische Schwertmuschel Ensis directus(Conrad) in der Deutschen Bucht. I. Zoogegraphis und Taxonomie im Vergleich mit den einheimischen Schwertmuschel-Arten. Senckenbergiana maritima, 14, 147–173.
Darriba, S., San Juan, F. & Guerra, A. (2005). Gametogenic cycle of Ensis siliqua (Linnaeus, 1758) in the Ría de Corcubión, northwestern Spain. Journal of Molluscan Studies, 71, 47–51.
Dayrat, B. (2005). Towards integrative taxonomy. Biological Journal of the Linnean Society, 85, 407–415.
Esselstyn, J. A., Evans, B. J., Sedlock, J. L., Khan, F. A. A. & Heaney, L. R. (2012). Single-locus species delimitation: a test of the mixed Yule – coalescent model, with an empirical application to Philippine round-leaf bats. Proceedings of the Royal Society B: Biological Sciences, 279, 3678–3686.
Felsenstein, J. (1985). Confidence limits on phylogenies: an approach using the bootstrap. Evolution, 39, 783–791.
Fernández-Tajes, J. & Méndez, J. (2007). Identification of the razor clam species Ensis arcuatus, E. siliqua, E. directus, E. macha, and Solen marginatus using PCR-RFLP analysis of the 5S rDNA region. Journal of Agricultural and Food Chemistry, 55, 7278–7282.
Fernández-Tajes, J., Freire, R. & Méndez, J. (2010). A simple one-step PCR method for the identification between European and American razor clams species. Food Chemistry, 118, 995–998.
Folmer, O., Black, M., Hoeh, W., Lutz, R. & Vrijenhoek, R. (1994). DNA primers for amplification of mitochondrial cytochrome c oxidase subunit I from diverse metazoan invertebrates. Molecular Marine Biology and Biotechnology, 3, 294–299.
Fontaneto, D., Herniou, E. A., Boschetti, C., Caprioli, M., Melone, G., Ricci, C. & Barraclough, T. G. (2007). Independently evolving species in asexual bdelloid rotifers. PLoS Biology, 5, e87.
Fontaneto, D., Iakovenko, N., Eyres, I., Kaya, M., Wyman, M. & Barraclough, T. G. (2011). Cryptic diversity in the genus Adineta Hudson & Gosse, 1886 (Rotifera: Bdelloidea: Adinetidae): a DNA taxonomy approach. Hydrobiologia, 662, 27–33.
Freire, R., Fernández-Tajes, J. & Méndez, J. (2008). Identification of razor clams Ensis arcuatus and Ensis siliquaby PCR–RFLP analysis of ITS1 region. Fisheries Science, 74, 511–515.
Giegerich, R., Meyer, F. & Schleiermacher, C. (1996). GeneFisher - software support for the detection of postulated genes. Proceedings of the International Conference on Intelligent Systems for Molecular Biology, 4, 68–77.
González-Tizón, A. M., Rojo, V., Vierna, J., Jensen, K. T., Egea, E. & Martínez-Lage, A. (2013). Cytogenetic characterisation of the razor shells Ensis directus (Conrad, 1843) and E. minor (Chenu, 1843) (Mollusca: Bivalvia). Helgoland Marine Research, 67, 73–82.
González-Wevar, C. A., Hüne, M., Cañete, J. I., Mansilla, A., Nakano, T. & Poulin, E. (2012). Towards a model of postglacial biogeography in shallow marine species along the Patagonian Province: lessons from the limpet Nacella magellanica (Gmelin, 1791). BMC Evolutionary Biology, 12, 139.
Hall, T. A. (1999). BioEdit: a user-friendly biological sequence alignment editor and analysis program for Windows 95/98/NT. Nucleic Acids Symposium Series, 41, 95–98.
Heath, D. D., Rawson, P. D. & Hilbish, T. J. (1995). PCR-based nuclear markers identify alien blue mussel (Mytilus spp.) genotypes on the west coast of Canada. Canadian Journal of Fisheries and Aquatic Sciences, 52, 2621–2627.
Hebert, P. D., Cywinska, A. & Ball, S. L. (2003). Biological identifications through DNA barcodes. Proceedings of the Royal Society of London. Series B: Biological Sciences, 270, 313–321.
Huber, M. (2010). Compendium of Bivalves. A Full-Color Guide to 3,300 of the World's Marine Bivalves. A Status on Bivalvia after 250 Years of Research. Hackenheim, Germany: ConchBooks.
Huelsenbeck, J. P. & Ronquist, F. (2001). MRBAYES: Bayesian inference of phylogenetic trees. Bioinformatics, 17, 754–755.
Huson, D. H. & Bryant, D. (2006). Application of phylogenetic networks in evolutionary studies. Molecular Biology and Evolution, 23, 254–267.
Huson, D. H. & Scornavacca, C. (2012). Dendroscope 3: an interactive viewer for rooted phylogenetic trees and networks. Systematic Biology, 61, 1061–1067.
James, S. W., Porco, D., Decaëns, T., Richard, B., Rougerie, R. & Erséus, C. (2010). DNA barcoding reveals cryptic diversity in Lumbricus terrestris L., 1758 (Clitellata): resurrection of L. herculeus (Savigny, 1826). PLoS One, 5, e15629.
Katoh, K. & Standley, D. M. (2013). MAFFT multiple sequence alignment software version 7: improvements in performance and usability. Molecular Biology and Evolution, 30, 772–780.
Katoh, K. & Toh, H. (2008). Improved accuracy of multiple ncRNA alignment by incorporating structural information into a MAFFT-based framework. BMC Bioinformatics, 9, 212.
Larkin, M. A., Blackshields, G., Brown, N. P., Chenna, R., McGettigan, P. A., McWilliam, H., Valentin, F., Wallace, I. M., Wilm, A., López, R., Thompson, J. D., Gibson, T. J. & Higgins, D. G. (2007). Clustal W and Clustal X version 2.0. Bioinformatics, 23, 2947–2948.
Ley, A. C. & Hardy, O. J. (2010). Species delimitation in the Central African herbs Haumania (Marantaceae) using georeferenced nuclear and chloroplastic DNA sequences. Molecular Phylogenetics and Evolution, 57, 859–867.
Librado, P. & Rozas, J. (2009). DnaSP v5: a software for comprehensive analysis of DNA polymorphism data. Bioinformatics, 25, 1451–1452.
Márquez, F. & Van der Molen, S. (2011). Intraspecific shell-shape variation in the razor clam Ensis macha along the Patagonian coast. Journal of Molluscan Studies, 77, 123–128.
Miller, M. A., Pfeiffer, W. & Schwartz, T. (2010), ‘Creating the CIPRES Science Gateway for inference of large phylogenetic trees’ In Proceedings of the Gateway Computing Environments Workshop (GCE) (pp. 1– 8). 14 Nov. 2010, New Orleans, LA.
Nylander, J. A. A., Wilgenbusch, J. C., Warren, D. L. & Swofford, D. L. (2008). AWTY (are we there yet?): a system for graphical exploration of MCMC convergence in Bayesian phylogenetics. Bioinformatics, 24, 581–583.
Obertegger, U., Fontaneto, D. & Flaim, G. (2012). Using DNA taxonomy to investigate the ecological determinants of plankton diversity: explaining the occurrence of Synchaeta spp. (Rotifera, Monogononta) in mountain lakes. Freshwater Biology, 57, 1545–1553.
Ornelas-Gatdula, E., Camacho-García, Y., Schrödl, M., Padula, V., Hooker, Y., Gosliner, T. M. & Valdés, A. (2012). Molecular systematics of the ‘Navanax aenigmaticus’ species complex (Mollusca, Cephalaspidea): coming full circle. Zoologica Scripta, 41, 374–385.
Pilsbry, H. A. & McGinty, T. L. (1943). Ensis minor megistus n. subsp., a West Florida razor clam. The Nautilus, 57, 33–34.
Pons, J., Barraclough, T. G., Gómez-Zurita, J., Cardoso, A., Durán, D. P., Hazell, S., Kamoun, S., Sumlin, W. D. & Vogler, A. P. (2006). Sequence-based species delimitation for the DNA taxonomy of undescribed insects. Systematic Biology, 55, 595–609.
Puillandre, N., Modica, M. V., Zhang, Y., Sirovich, L., Boisselier, M. C., Cruaud, C., Holford, M. & Samadi, S. (2012). Large-scale species delimitation method for hyperdiverse groups. Molecular Ecology, 21, 2671– 2691.
R Development Core Team (2011) R Foundation for Statistical Computing, Vol. 1, issue: 2.11.1.
Rufino, M. M., Vasconcelos, P., Pereira, F., Fernández-Tajes, J., Darriba, S., Méndez, J. & Gaspar, M. B. (2012). Geographical variation in shell shape of the pod razor shell Ensis siliqua (Bivalvia: Pharidae). Helgoland Marine Research, 67, 49–58. DOI 10.1007/s10152-012-0303-6.
Sanderson, M. J. (2003). r8s: inferring absolute rates of molecular evolution and divergence times in the absence of a molecular clock. Bioinformatics, 19, 301–302.
Stamatakis, A. (2006). RAxML-VI-HPC: maximum likelihood-based phylogenetic analyses with thousands of taxa and mixed models. Bioinformatics, 22, 2688–2690.
Stamatakis, A., Hoover, P. & Rougemont, J. (2008). A fast bootstrapping algorithm for the RAxML web-servers. Systematic Biology, 57, 758–771.
Talavera, G. & Castresana, J. (2007). Improvement of phylogenies after removing divergent and ambiguously aligned blocks from protein sequence alignments. Systematic Biology, 56, 564–577.
Tamura, K., Peterson, D., Peterson, N., Stecher, G., Nei, M. & Kumar, S. (2011). MEGA5: molecular evolutionary genetics analysis using maximum likelihood, evolutionary distance, and maximum parsimony methods. Molecular Biology and Evolution, 28, 2731–2739.
Tang, C. Q., Leasi, F., Obertegger, U., Kieneke, A., Barraclough, T. G. & Fontaneto, D. (2012). The widely used small subunit 18S rDNA molecule greatly underestimates true diversity in biodiversity surveys of the meiofauna. Proceedings of the National Academy of Sciences, 109, 16208–16212.
Varela, M. A., Martínez-Lage, A. & González-Tizón, A. M. (2012). Genetic heterogeneity in natural beds of the razor clam Ensis siliqua revealed by microsatellites. Journal of the Marine Biological Association of the United Kingdom, 92, 171–177.
Vierna, J., González-Tizón, A. M. & Martínez-Lage, A. (2009). Long-term evolution of 5S ribosomal DNA seems to be driven by birth-and-death processes and selection in Ensis razor shells (Mollusca: Bivalvia). Biochemical Genetics, 47, 635–644.
Vierna, J., Martínez-Lage, A. & González-Tizón, A. M. (2010). Analysis of ITS1 and ITS2 sequences in Ensis razor shells: suitability as molecular markers at the population and species levels, and evolution of these ribosomal DNA spacers. Genome, 53, 23–34.
Vierna, J., Jensen, K. T., González-Tizón, A. M. & Martínez-Lage, A. (2012). Population genetic analysis of Ensis directus unveils high genetic variation in the introduced range and reveals a new species from the NW Atlantic. Marine Biology, 159, 2209–2227.