Facebook, Twitter, and Youth Engagement: A Quasi experimental Study of Social Media Use and Protest Behavior Using Propensity Score Matching
25
0
0
Texto completo
(2) International Journal of Communication 8 (2014). Facebook, Twitter, and Engagement 2047. Behavioral Scientist (2013). On the one hand, this is a natural consequence of scholarly interest about the effect of ICTs on citizens’ political behavior, with social media being the latest development in usergenerated content platforms. On the other hand, prominent social and political movements around the world such as the Arab Spring, Occupy Wall Street, Spain’s indignados, and the Chilean student movement have employed—with varying degrees of success—services such as Facebook, Twitter, and YouTube to coordinate online and offline activities (Howard & Parks, 2012). At the individual level, existing research shows a positive relationship between frequency of social media use and protest participation (but see Pearce & Kendzior, 2012). Most of the available work, however, is based either on single cross-sectional surveys—and is thus ill-suited for examining the time dynamics of the social media–protest link—or employs social media content data, which prevent proper control for individuals’ characteristics (González-Bailón, Borge-Holthoefer, Rivero, & Moreno, 2011; Groshek, 2012; Howard, Duffy, Freelon, Hussain, Mari, & Mazaid, 2011; Wolfsfeld, Segev, & Sheafer, 2013). The current study moves research on social media and protest behavior forward on three accounts. First, it adopts a longitudinal perspective using a repeated cross-sectional survey tracking social media use and offline protest participation before, during, and after the. massive student street. demonstrations that took place in Chile’s urban areas in 2011—a period known as the “Chilean Winter” (Barrionuevo, 2011). By being a trend study, it sheds light on the aggregate-level change of the association between social media use and protest behavior in a context of diffusion of both social media and protest behavior among the younger population. Second, the study employs propensity score matching, which is better equipped for causal inferences than conventional regression models (Dehejia & Wahba, 2002; Ho, Imai, King, & Stuart, 2007; Rosenbaum & Rubin, 1983). Matching reduces estimation bias caused by self-selection on observable characteristics, which in this study is a potential concern since it is likely that street protesters are heavy users of social media to begin with. Thus, combining propensity score matching with regression adjustment produces more conservative estimates of social media effects on protest behavior, as these effects are less affected by self-selection. Third, the study takes a more comprehensive perspective by producing separate analyses of the effects of Facebook and Twitter on protest participation. Prior research using survey data either combines various platforms into a single measure of social media, or analyzes a single platform. Based on extant work on network structures and social contagion, we expect Facebook to have a stronger effect on protest behavior than Twitter, and we test this expectation empirically. Of course, in reality, activists can use both platforms, one or the other, or neither. Still, we wish to isolate the effects of each platform on protesting, even if we do not assume that Facebook and Twitter are mutually exclusive. The article is organized as follows: We first preview existing research on social media use and youth protest behavior and theorize, based on the sites’ affordances, on why we expect Facebook, rather than Twitter, to have a stronger relationship with offline protest activity. Our main argument is based on the different network structures embedded in Facebook and Twitter. We then provide background.
(3) 2048 S. Valenzuela, A. Arriagada & A. Scherman. International Journal of Communication 8(2014). information on the Chilean student movement and introduce the Youth and Participation surveys, an annual survey program that tracks digital media use and various forms of political participation among young adults in Chile’s main urban areas. After explaining the propensity score matching procedure and reporting the findings, we discuss possible explanations for the results, limitations, and directions for future research. Social Media Use and Youth Protest Although recent events such as the Arab Spring have increased scholarly attention on the association between using Facebook, Twitter and other social media and engagement in protest behavior (e.g., Harlow & Johnson, 2011), prior research on Internet use, social movements, and political participation spans more than two decades (Bimber, Flanagin, & Stohl, 2005; Boulianne, 2009; van de Donk, Loader, Nixon, & Rucht, 2004). In the case of individual-level studies, existing research finds a positive relation between frequency of social media use and protest behavior (Macafee & De Simone, 2012; Tufekci & Wilson, 2012; Valenzuela, 2013; Valenzuela, Arriagada, & Scherman, 2012; Wilson & Dunn, 2011). Several reasons have been proposed to explain this positive association. First, social network sites facilitate access to a large number of contacts, thereby enabling social movements to reach critical mass (Lovejoy & Saxton, 2012; Marwell & Oliver, 1993). Second, online social platforms emerge as a space where individuals enact their offline networks, in the same way they can also promote personal and group identity construction—key antecedents of political behavior (Dalton, van Sickle, & Weldon, 2009)— by allowing multiple channels for interpersonal feedback, peer acceptance, and reinforcement of group norms (Papacharissi, 2010). Third, these sites can also operate as information hubs, exposing individuals’ activities, emotions, and content to others, especially people with similar interests (Gil de Zúñiga, Jung, & Valenzuela, 2012). In this way, individuals who are part of social movements and political groups can build relationships with their peers, receive information regarding mobilizations, and also be exposed to different sources of content that can promote engagement with their causes (Kobayashi, Ikeda, & Miyata, 2006). For instance, Facebook and Twitter allow individuals to create personalized groups to share media content (e.g., videos, information). Similarly, they can monitor their friends’ activities, as well as other political actors (e.g., politicians, mass media) through Facebook’s News Feed. As a result, through their online groups, individuals may build stronger ties and relationships among the members (Gilbert & Karahalios, 2009). At the social level, digital media like Facebook and Twitter are effective tools for social interaction, operating as a space for conversation and connecting people, but also acting as a window into the lives of others. It is this aspect that allows these tools to enhance youth interest in public issues. Similarly, other scholars emphasize the everyday impact these tools have on individuals by enhancing processes of social identity construction in political spaces where opinions and ideas are shared (Bakardjieva, 2011). Particularly, online social networking sites can operate as useful resources to create collective experiences that are essential conditions for protest behavior, especially among youth. As individuals who have grown up with the Internet and digital media, young people tend to be involved in.
(4) International Journal of Communication 8 (2014). Facebook, Twitter, and Engagement 2049. this kind of collective experience based on shared interests, representing new forms of citizenship (Bennett, 2008). Although Boulianne’s (2009) meta-analysis questions the strength of the influence of the Internet on individuals’ political participation in the United States (but see Anduiza, Cantijoch, & Gallego, 2009), data collected among Chilean youth—the population of interest in the current study—reveals otherwise. Separate cross-sectional analyses have found a strong relationship between using online platforms (online news sites, social network sites, etc.) and political and civic participation, a relationship that seems to be explained by the ability of social media to allow access to news and enable socializing with others (Scherman, Arriagada, & Valenzuela, in press; Valenzuela, Arriagada, & Scherman, 2012; Valenzuela, 2013). Based on the literature discussed so far, it is expected that using Facebook and Twitter—the most prominent social media among Chilean young adults—is associated with engagement in protest activities because the social media sites provide political information, enable users to discuss political issues, and help coordinate protests. Thus, our first hypothesis states: H1:. Using Facebook and Twitter regularly increases the likelihood of participating in street protests. Effects of Different Network Structures on Protest Although it is expected that frequent use of Facebook and Twitter increases protest participation,. differences in the affordances of each platform beg the question of which one is more conducive for protesting. Here, we concentrate on the differential effects on political mobilization associated with the different types of networks and content embedded in Facebook and Twitter. Facebook allows users to (mostly) connect to each other in a symmetric, friend-based network: In order to connect with someone, both parties have to approve the relationship.2 Thus, for most users, their Facebook “friends” are people with whom they already have an existing relationship, which explains the benefits of Facebook for the maintenance of existing social ties (Ellison, Steinfield, & Lampe, 2007). Twitter, on the other hand, is asymmetrical: Users can follow any other user regardless of whether they approve the relationship. As a consequence, it is easier for users to connect to their offline network of “strong ties” (Granovetter, 1973) on Facebook than on Twitter. Taking this difference in structure to the extreme, it could be argued that whereas Facebook is a people-based, strong-tie network, Twitter is an interest-based, weak-tie network. Currently, there are two competing hypothesis about how these different network structures influence collective behavior, including protesting. Granovetter’s (1973) “strength of weak ties” argument predicts that heterogeneous networks are more efficient at social contagion and spread of information than homogenous networks (Gil de Zúñiga & Valenzuela, 2011; Watts, 1999). This is because the diffusion 2. This, of course, does not apply to Facebook Pages and, with the “subscribe” button that debuted in 2011,. it also changed for Facebook personal profiles..
(5) 2050 S. Valenzuela, A. Arriagada & A. Scherman. International Journal of Communication 8(2014). process is less redundant and contagion spreads rapidly to the whole network as people whose friends do not know each other become connected. Thus, to the degree that information is a determinant of protest behavior, weak-tie networks such as Twitter are better equipped to promote collective action. The alternative hypothesis—we will call it the “strength of strong ties”—stresses the importance of homophily for spreading behavior (Centola, 2010). Because behavior is much more complex and difficult to spread than information, individuals require social reinforcement in order to adopt the behavior of their peers. The redundant ties that characterize strong-tie networks, in this sense, provide the social pressure necessary for behavior adoption. Thus, to the degree that social pressure facilitates political action, strong-tie networks such as Facebook networks are better at promoting protest behavior. Although there is evidence supporting both hypotheses (e.g., Chiang, 2007; Gould, 1993; Kitts, 2000; McAdam & Paulsen, 1993; McPherson, Smith-Lovin, & Cook, 2001), current work involving agentbased modeling and experiments shows that, for large-scale networks, homophily and strong ties are more conducive to mobilization (Bond, Fariss, Jones, Kramer, Marlow, Settle, & Fowler, 2012; Centola, 2010). This is consistent with the classic Columbia studies, which posit that people place a high value on maintaining harmonious relationships with their close contacts and, thus, they adapt to their peers’ political preferences and behaviors to conform to their expectations. Furthermore, although information and social pressure are two mechanisms for explaining the effects of social networks on participation, there is more empirical support for the latter as being conducive to political participation (Mutz, 2006; Sinclair, 2012). The field experiments by Gerber et al. (2008, 2009) on voter turnout speak strongly about the strength of social pressure over information gain as an explanation for political behavior. Extending this logic to social media and protest behavior, it could be argued that users are more likely to encounter social reinforcement on Facebook than on Twitter, even if Twitter is used more often as a source for news and information than Facebook (Johnson & Yang, 2009; Scifleet, Henninger, & Albright, 2013). In addition, recent work on youth mobilization and social media use has found that platforms such as Facebook that are more oriented toward expressive and performative behaviors are more closely related to offline youth engagement than social media platforms such as Twitter that are more oriented toward information processing behaviors (Östman, 2012). Taken together, then, it is expected that H2:. Facebook will have a stronger effect on protest participation than Twitter. Political Opportunities and the Protest Cycle The relationships posited in H1 and H2 need to be qualified in terms of the temporal context. It is. likely that the strength of the association varies as, on the one hand, Facebook and Twitter diffuse over time, and, on the other hand, the dynamics of protests and social movements change—as the “waves of contention” emerge, rise, and fall (Koopmans, 2004. According to Tarrow (1995), the cycle of protest begins with a stage of heightened conflict, followed by diffusion of conflict over geographic and sectorial.
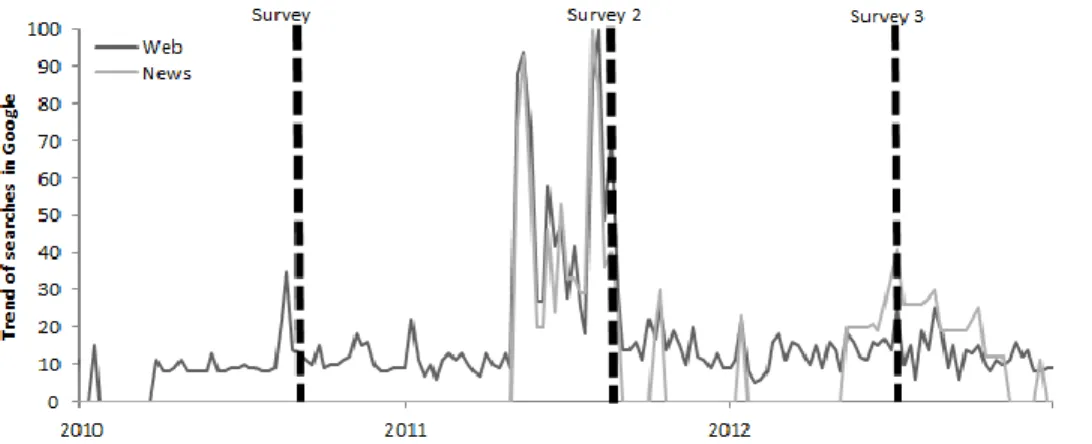
(6) International Journal of Communication 8 (2014). Facebook, Twitter, and Engagement 2051. boundaries, the appearance of new social movements and consolidation of existing ones, the creation of new frames of interpretation and protest techniques, and, finally, the eventual decline of protest. Absent time series data on protest behavior in Chile, Figure 1 below plots weekly changes in Google searches (separately for Web and news searches) for the query “protesta” (“protest” in Spanish) over time in Chile for the period 2010–2012.3 As shown, there clearly is a protest cycle: In 2010, there was little interest among Web users and news media on protests. Interest grew during 2011, reaching a climax in the winter of that year, when thousands of students took to the streets of Chile’s main cities to voice their demands for wholesale changes in education policy. By the end of 2011, polls put public opinion support for the student movement at an astounding 79% (Adimark GfK, 2011). The protest wave receded in 2012 as the central government launched a full-blown educational reform with more than $4 billion in fresh public funds, with the hope of addressing the students’ demands.. Figure 1. Weekly variation in Web and news searches for the term “protesta” on Google. January 2010 to December 2012, using Google Trends (http://www.google.com/trends). Dashed lines show approximate time when surveys in this study were fielded. As is common with modern social movement organizations, the main characteristic of the student movement was its independence from mainstream political parties (Earl & Kimport, 2011). Defying the notion held by some commentators that Chilean youth are disengaged from public affairs, their protest was targeted directly against the government, Congress, and the mainstream media. And, from a communication perspective, the students were successful at spreading their demands both online and offline, through the mass media as well as social networks—in stark contrast to previous Chilean citizen movements (Valenzuela & Arriagada, 2011). The question that concerns us here, however, is how the protest cycle alters (or not) the role played by Facebook and Twitter in mobilizing youth. Although current research has not delved into 3. Although Google Trends has its limitations, such as providing standardized—not raw—data on searches,. prior research has found that search behavior on Google is significantly correlated with real-world events (Ginsberg, Mohebbi, Patel, Brammer, Smolinski, & Brilliant, 2008)..
(7) 2052 S. Valenzuela, A. Arriagada & A. Scherman. International Journal of Communication 8(2014). contextual and temporal effects on the social media–participation link, it can be expected that the cycle of protest impacts the effect of Facebook and Twitter in two ways. First, from a theoretical perspective, online social networks are more pivotal for information acquisition and social coordination when the protest movement is emerging and declining rather than when it is at its peak. This is because when protests are at their peak, there are other media and communication channels (television news, peer networks, talk, and so forth) covering the movement, providing information, and becoming a space for informal deliberation. But both before and after, when protests and social movements organizing them are not on the agendas of the mass media or the public at large, online social media can more likely become an important, unique space for activists to coordinate action and mobilize resources. In the current study, which refers to a highly connected population of social media users, at the initial stages of the protest cycle, a minority of committed student activists turned to social media to persuade others to get out and march in the streets (Cabalín, 2014). Once people heeded the calls for action and turned out to protest, the relative importance of social media, vis-à-vis the mass media, declined. As the protests receded in 2012, it is likely the more committed student groups and activists redoubled their social media efforts in order to regain lost momentum. In other words, it may well be that by the time the protest movement was at its peak, the issues, grievances, and population of protestors were well defined, such that social media had less value to add. In contrast, at the initial and declining stages of the protest cycle, online social network may have had added value. Second, examining a more methodological aspect, less variance in protest behavior and protestrelated activities on social media during the peak of the student movement may attenuate the relationship between social media use and protest in 2011, compared to 2010 and 2012, when more variance in these measures may have yielded stronger relationships. That is, when protest is a scarce activity, the contribution of social media will more likely yield a difference, one that may diminish when protests are at their peak. For all these reasons, it is expected that H3:. The strength of the relationship between using Facebook and Twitter and protest will be stronger before (2010) and after (2012) than during the height of the protest cycle (2011). Method Sample The data used in this study were obtained from the Youth and Participation studies, repeated. face-to-face surveys that have been conducted on an annual basis since 2009 among individuals aged 18 to 29 living in Chile’s three largest urban areas (Greater Santiago, Valparaíso-Viña del Mar, and Concepción-Talcahuano), which make up 43.2% of the country’s population. Although each year a fresh sample was drawn, the sampling procedures employed were the same. Specifically, the School of Journalism at Universidad Diego Portales and Feedback, a professional polling firm, designed a multistage probability sample stratified by urban area. Within each urban area, the sample was allocated proportionally by communes and within communes by the number of blocks. For each randomly selected block, five households were randomly selected to obtain a list of adult residents.
(8) International Journal of Communication 8 (2014). Facebook, Twitter, and Engagement 2053. aged 18 to 29. In the last stage, one eligible youth from each selected household was randomly drawn for a face-to-face interview. Interviews were conducted between August 27 and September 10, 2010, August 19 and September 6, 2011, and July 13 and July 23, 2012 (see Figure 1, which pinpoints the dates of fieldwork with trends in protest activity on Google). Because it is a face-to-face survey conducted in urban areas, the response rates are relatively high, which should lessen concerns about nonresponse bias. Specifically, the sample size for 2010 and 2011 was 1,000, with a simple response rate of 81% and 80%, respectively. For 2012, the sample size decreased to 748, with a response rate of 79%, mainly due to a change in the sample composition to include adults aged 30 to 40 (which were excluded in the current analysis to facilitate comparisons across years). Analytic Strategy and Measures Prior research has shown that youth do not randomly gravitate toward particular social media platforms. Age, socioeconomic status, political interest, and news media use have all been identified as predictor variables of frequency of Facebook and Twitter use (Lenhart, Purcell, Smith, & Zickuhr, 2010; Valenzuela, Arriagada, & Scherman, 2012). At the same time, these variables are predictive of political participation (Smets & van Ham, 2013) and it is likely that youth who participate in protests have additional reasons to use Facebook and Twitter more often than those with less interest (e.g., to coordinate political action, to spread mobilizing information, and so forth). Thus, the nonrandom distribution of Facebook and Twitter penetration levels, coupled with the problem of endogeneity, can seriously bias inferences as to their effects on protest. In order to address selection bias and produce a more reliable estimate of Facebook and Twitter effects, we employed propensity score matching, a quasi-experimental design that reduces potential bias due to nonrandom assignment of treatment conditions (Dehejia & Wahba, 2002; Ho, Imai, King, & Stuart, 2007; Rosenbaum & Rubin, 1983). The purpose of matching is to produce a data set in which two groups of respondents differ only in treatment (i.e., their level of Facebook and Twitter use) but are identical in all other observed characteristics. Ideally, we would have employed exact matching, but this was simply not feasible due to the large number of variables to match, several of which were measured at the continuous level. Thus, any imbalance in covariate distribution between groups remaining after the matching process was addressed with postmatching regression analysis, following the recommendations of Stuart (2010). To produce the “treatment” and “control” groups, we first pooled the three surveys into a single data file and calculated the propensity score, which measures the conditional probability of receiving the treatment given the observed covariates. This is usually achieved through a logistic regression model of a binary treatment variable, with the predicted likelihoods being the propensity scores (Stuart, 2010, p. 9). Individuals with similar propensity scores were selected. Those who use Facebook and Twitter regularly and those who do not were placed in the treatment and control groups, respectively, and their differences in outcomes (here, protest participation) was compared. Unmatched individuals, in turn, were excluded from further analyses. Because this leaves the interpretation of the coefficients associated to the.
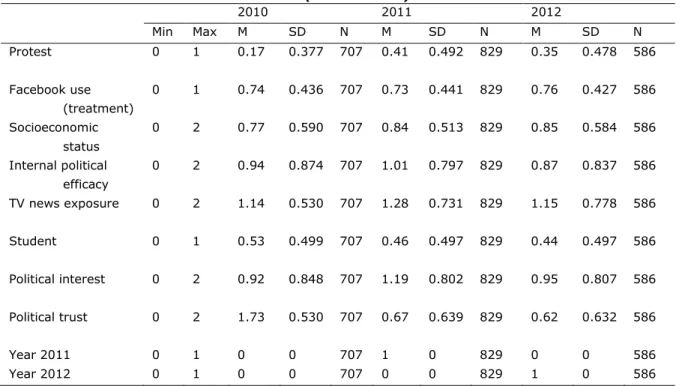
(9) 2054 S. Valenzuela, A. Arriagada & A. Scherman. International Journal of Communication 8(2014). covariates rather meaningless in the final regressions, we focus only on the effects of Facebook and Twitter use on protest behavior. Two treatments were examined: (a) regular Facebook use, and (b) regular Twitter use. In both instances, a dummy variable identifying the treatment group was computed by splitting the samples in two groups: (a) one where respondents use Facebook or Twitter three times a week or less, and (b) another where respondents use Facebook or Twitter every day, once a day or more.4 In line with the recommendations of Caliendo and Kopeinig (2008), each treatment was regressed on variables that theoretically and empirically are likely to influence social media use and protest behavior (see Appendix A for descriptive statistics of all variables). These were: . Socioeconomic status. Socioeconomic status (SES) was gauged using an adaptation of ESOMAR’s criteria, which combines educational attainment with goods and services at home (e.g., television, telephone, desktop computer, etc.). Using this classification, an ordinal variable was created, with 1 = low SES (ESOMAR groups D and E), 2 = middle SES (groups C2 and C3), and 3 = high SES (groups, A, B, and C1).. . Political interest. A scale averaging respondents’ level of interest in staying informed about important political affairs and talking about political affairs with friends and relatives. Both items were coded using a 5-point scale ranging from 1 = “Not interested” to 5 = “Very interested” (Cronbach’s α = .74 in 2010, .75 in 2011, .72 in 2012). The scale was recoded into three categories by dividing the scores into terciles.. . Internal political efficacy. Respondents were asked how much they believed their actions influence the decisions made by government officials. This item was initially coded using a 10point scale (1 = “Not at all” and 10 = “A lot”) and then recoded for the matching analysis into terciles.. . Political trust. A scale of political trust was computed from questions asking how much trust respondents had in political parties and their district’s representative to Congress. Responses were recorded using a 4-point scale, with 1 = “None” and 4 = A lot (Cronbach’s α = .75 in 2010, α = .77 in 2011, and α = .80 in 2012). The variable was recoded into terciles.. . Exposure to TV news. Because television is the main information source for youth in Chile, respondents were asked to estimate how many hours they watched television news on a typical day. The resulting score was recoded into terciles.. 4. Respondents were asked to report how often they used Facebook and Twitter, separately. Response. choices in both cases were coded using a 6-point scale (1 = “Less than once a week”; 2 = “Two or three times per month”; 3 = “Once a week”; 4 = “At least three times a week”; 5 = “Every day, once a day”; and 6 = “Every day, several times each day.”.
(10) International Journal of Communication 8 (2014). . Facebook, Twitter, and Engagement 2055. Student status. Because the protests were led by university students, a dummy variable was created to identify student respondents, with youth nonstudent being the residual category.. . Year of survey. In order to take into account the protest cycle and test its moderating effect on the social media–protest link, annual time dummies were included in all analyses, with 2010 as the residual category. Propensity scores were generated using one-to-one nearest neighbor matching, the most. common algorithm (Caliendo & Kopeinig, 2008; Stuart, 2010). In order to exclude poor matches, individuals in the control group with propensity score values outside the range of individuals in the treatment group were excluded (Rosenbaum & Rubin, 1984). For the Facebook analysis, there were fewer control individuals compared to the treated individuals, so matching was implemented with replacement (i.e., controls were used as matches for more than one treated individual). As a result, the final outcome analysis for Facebook used weights to account for this fact. The matching of the Twitter data, however, was conducted without replacement. Different approaches were used because, on average over the three years of the study, 84.6% of respondents reported having a Facebook account, whereas only 19.1% reported having a Twitter account. In other words, Facebook is more popular among youth in Chile than Twitter, with the obvious consequence that there are more treated individuals when conducting the matching analysis for Facebook than for Twitter (see Appendix C for the number of individuals in the treatment and control groups). Matching was conducted with the PSMATCHING macro (version 3.0) for SPSS 18 developed by Thoemmes (2012), which performs all analysis using the R statistical software through the SPSS R-Plugin. Additional statistical analyses, such as calculations for average marginal effects of independent variables in binary logistic regressions, were conducted with STATA 11. Diagnostic tests for assessing the quality of the matched samples revealed that covariate balance was achieved.5 Furthermore, there was a high degree of overlap of the distribution of observed covariates in the treatment and control groups, such that there was sufficient similarity across the groups to make comparisons without relying on extrapolation (Stuart, 2010). See Appendix B for complete results of the matching analysis, including diagnostic tests. Protest behavior was measured with a dummy variable identifying participation in street demonstrations in the previous 12 months. Historically, public demonstrations have been the most frequent way Chilean youth protest (Hipsher, 1996). The student protests were no exception. For example, in the 2011 survey, at the zenith of the movement, 32% of respondents said they had attended 5. For the Facebook data, the relative multivariate imbalance measure L1 (Iacus, King, & Porro, 2009). decreased from .503 before matching to .390 after matching, resulting in a 22.5% imbalance reduction. For the Twitter data, the L1 measure decreased by 15.0%, from .718 to .610. In addition, for both analyses, no covariate exhibited an absolute standardized mean difference (i.e., the mean difference between the groups divided by the standard deviation of the control group) larger than .250, the typical cutoff value (Thoemmes, 2012)..
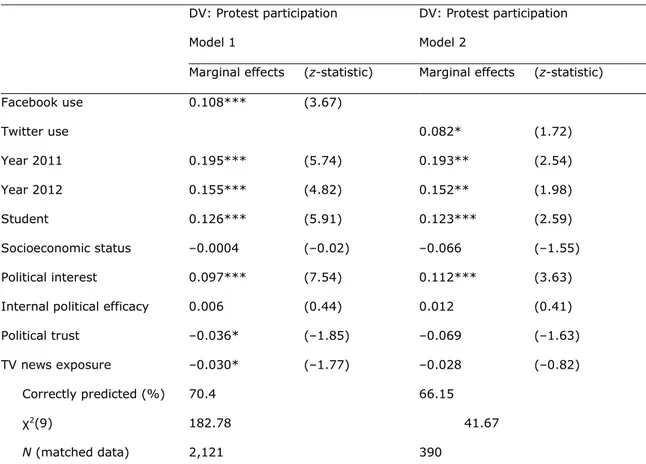
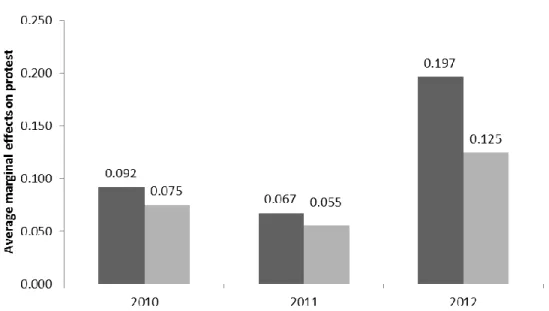
(11) 2056 S. Valenzuela, A. Arriagada & A. Scherman. International Journal of Communication 8(2014). a public demonstration in the last 12 months. At the same time, other low-cost forms of protest, such as petitioning, did not reach more than 16% of the youth population in 2011. Results Does using Facebook and Twitter have a significant, positive effect on the likelihood of joining street protests, as suggested by our hypotheses? The short answer is yes. Table 1 displays the results from a binary logistic regression model predicting the likelihood of participation in street protests in the past 12 months, comparing Facebook use (first column) with Twitter use (second column), based on the matched data sets. To facilitate substantive interpretation, the results are shown as average marginal effects, which measure the change in the predicted probability of participation in protests when each variable changes from 0 to 1. Therefore, the results suggest that, over the three years under study, the probability of protesting for those who regularly use Facebook is 10.8% higher than those who do not. The estimated average treatment effect for Twitter use, in turn, is 8.2%. Although both treatments have statistically significant effects compared to the respective control groups, the difference in the effects of Facebook and Twitter is not statistically significant, t(2,509) = 1.55, p = 0.12. The regression models presented in Table 1 do not, however, consider the possibility that Facebook and Twitter have different effects depending on the protest cycle. To evaluate whether these effects are time-varying or not, we computed interactive terms between our measures of Facebook and Twitter and the time dummies, added these interactions to the regression models, and estimated the corresponding marginal effects at means. The results are graphed in Figure 2 (see Appendix C for statistical significance). The figure clearly shows that the effects of both Twitter and Facebook increased between 2010 and 2012, albeit in curvilinear fashion, following the predicted U-shape. Before and after 2011, social media effects are stronger; at the height of the movement, they are weaker. Note also that across the three years, the effects of Facebook use on the likelihood of protesting are stronger than the effects of Twitter, particularly in 2012, when the average marginal effect of regular Facebook use reached 19.7%, a significantly higher effect compared to Twitter’s 12.5%, t(2,509) = 3.37, p < .001. Clearly, then, the estimated average effects reported in Table 1 mask variation across the period under study. What do these results mean for the posited hypotheses? As predicted by H1, regular use of both Facebook and Twitter results in a significant increase in the likelihood of attending street protests. Furthermore, across the years under study, Facebook shows a stronger effect than Twitter, although this difference is statistically significant only in 2012. Thus, the data provide limited support for H2. Finally, the impact of Facebook and Twitter on protesting is not constant over time. In line with H3, the impact is somewhat weak in 2010, weakest in 2011, and strongest in 2012..
(12) International Journal of Communication 8 (2014). Facebook, Twitter, and Engagement 2057. Table 1. Participation in Street Protests Among Young Adults in Chile (Logistic Regressions on Matched Data).. Facebook use. DV: Protest participation. DV: Protest participation. Model 1. Model 2. Marginal effects. (z-statistic). 0.108***. (3.67). Twitter use. Marginal effects. (z-statistic). 0.082*. (1.72). Year 2011. 0.195***. (5.74). 0.193**. (2.54). Year 2012. 0.155***. (4.82). 0.152**. (1.98). Student. 0.126***. (5.91). 0.123***. (2.59). Socioeconomic status. –0.0004. (–0.02). –0.066. (–1.55). Political interest. 0.097***. (7.54). 0.112***. (3.63). Internal political efficacy. 0.006. (0.44). 0.012. (0.41). Political trust. –0.036*. (–1.85). –0.069. (–1.63). TV news exposure. –0.030*. (–1.77). –0.028. (–0.82). Correctly predicted (%). 70.4. χ2(9). 182.78. N (matched data). 2,121. 66.15 41.67 390. Notes. Cell entries are average marginal effects from binary logistic regressions, with robust z statistics in parentheses, using data matched via propensity score. The Facebook use and Twitter use variables were measured with dummy variables, indicating control or treatment group. The constant was omitted from the table. The year 2010 is the excluded category.. * p ≤ .10; ** p ≤ .05; *** p ≤ .01 (two-tailed).
(13) 2058 S. Valenzuela, A. Arriagada & A. Scherman. International Journal of Communication 8(2014). Figure 2. The average marginal effects of Facebook and Twitter on the likelihood of protesting among Chilean youth. Notes. Average marginal effects are based on logistic regression models, using data matched via propensity score, controlling for all variables listed in Table 1 fixed at their means. For statistical significance, see Appendix C.. Discussion The purpose of this study was to examine the relationship between using Facebook and Twitter and joining street protests. To accomplish this, we used survey data collected before, during, and after the 2011 student protests in Chile. Relying on the quasi-experimental approach of propensity score matching, we quantified both the effect of Facebook and Twitter use on the likelihood of attending protests and how this effect varied over the protest cycle. We found that, on average and controlling for potential confounds, regularly using Facebook and Twitter increased by approximately 8% to 11% the probability of attending street protests. However, the effects were not constant over time or across platforms. Facebook tended to have a higher impact than Twitter, and the effects of both platforms were weaker when the protests were popular and stronger when they were not. More interesting is the empirical test of two competing hypotheses about how different network structures influence collective behavior: namely, the “strength of weak ties” versus the “strength of strong ties” arguments. The findings suggest that strong-tie networks such as those of Facebook are better at promoting protest behavior than weak-tie networks such as those of Twitter. Although we do not test the mechanisms behind these differential effects, prior research shows that homophily and social pressure are.
(14) International Journal of Communication 8 (2014). Facebook, Twitter, and Engagement 2059. more important for spreading political behavior than information diffusion (for which weak-tie networks are better equipped). In this regard, the findings are more consistent with experimental work on behavior diffusion by Bond et al. (2012), Centola (2010), and others. According to this line of research, when it comes to complex behaviors—complex because they are difficult or run against pre-existing norms—networks that are more clustered, with redundant ties, are more successful for behavior contagion than less clustered, more random networks. As noted by Centola (2010), “people usually require contact with multiple sources of ‘infection’ before being convinced to adopt a behavior” (p. 1195). Thus, for social movements, reaching critical mass may be more likely when networks of like-minded individuals are activated, as homophily and social pressure increase the likelihood of multiple sources of contagion. The results of this study should not be interpreted, however, as implying that Twitter networks are insignificant for collective action. Rather, it may well be that Twitter offers an indirect route for protesting, one based, precisely, on information contagion. In fact, there is a long line of research, from the two-step flow of communication (Katz, 1957) to the communication mediation model (Shah, Cho, Nah, Gotlieb, Hwang, Lee, et al., 2007), that puts interpersonal networks as the mediating mechanism for information effects on political participation. Thus, to the degree that information is a determinant of protest behavior, weak-tie networks such as Twitter networks can promote collective action. In other words, the results presented here may indicate that it is more likely for users to encounter social reinforcement on Facebook than on Twitter—just as it is more probable to find political information on Twitter than on Facebook. As a consequence, differences in the size of the effects of Facebook and Twitter on protest participation may simply reflect that in the Chilean student movement, social reinforcement proved more pivotal than information gain. In any case, we should not go too far in interpreting the results as support for the “strength of strong ties” argument. In addition to the role played by network structures on social media effects on participation, differences in the relationship of Facebook and Twitter to protest behavior could be explained by several other factors, including (a) channel characteristics; (b) gratifications sought and obtained from each medium; and (c) type of users attracted by each medium. Twitter is mostly a textbased, real-time application that has an asymmetrical network structure. Thus, compared to Facebook, it may contain less personalized messages (Lee & Oh, 2012) and function as a general source of political news—a type of content that contains low amounts of mobilizing information (Hoffman, 2006) and is less conducive to protest behavior. In the study discussed in this article, there is the additional effect of critical mass: Twitter has fewer younger users than Facebook which means that those relying exclusively on Twitter encountered fewer opportunities to learn about the protests, have discussions with peers, and join the student movement. Future research could address these alternative explanations from an empirical perspective through replication and extension of the analyses reported here. Another noteworthy finding relates to the temporal changes in social media effects. It was anticipated that the political utility of social media changes depending on the cycle of protest, as participants’ needs and expectations regarding the protests varied over time. Because it is less costly to join protests when they are at their peak, rather than before or after, the role played by Facebook and.
(15) 2060 S. Valenzuela, A. Arriagada & A. Scherman. International Journal of Communication 8(2014). Twitter should change accordingly. Three other explanations can be mentioned in regard to the timevarying nature of social media effects on protest. One is related to the availability of mobilizing information and political discussions on social media, which may vary as protest behavior diffuses across cities and over time. Relatedly, less variance in protest behavior during the peak of the student movement may have weakened the association between protest and social media use in 2011, compared to 2010 and 2012, when more variance in these measures yielded stronger correlations. Last, press coverage of social media’s role in social movements and protests may further motivate otherwise passive users to become politically engaged, in a process similar to the diffusion of innovations, ideas, and behaviors through media (Rogers, 2003). If this were the case, it would explain—at least in part—why the effects of social media on protesting were particularly strong in 2012, after the Chilean media discovered the political impact of social media. To empirically address these explanations, content analysis data of Facebook and Twitter, as well as qualitative research on protest participation, would be of considerable utility. Despite new insights gained by this study, there are limitations that warrant some elaboration. First, we only considered Facebook and Twitter use by young individuals without exploring in detail those uses. Second, we employed survey data to measure individuals’ self-reporting about their protest involvement as well as their social media use, which may yield inaccurate measures due to social desirability bias and inaccurate recall. Third, ours is a trend study with repeated cross-sections, which is a longitudinal technique that can track aggregate-level changes only, not a panel study that can identify change at the individual level. In addition, there is always the possibility that the inclusion of additional covariates in the propensity score model as well as in the regression analysis could alter some of the results reported. And while propensity score matching may provide a more conservative estimate of media effects than typical regression models when dealing with observational data, it is not a cure-all. Most important, the internal validity of propensity score matching is heavily dependent on the covariate measures employed. That is, even if the matched samples have similar observed characteristics, unobserved characteristics could still be correlated with both treatment and outcomes of interest. Last, we have strived to reduce the problem of endogeneity by matching on political interest, socioeconomic status, political efficacy, and trust in institutions, among others. But other important drivers of protest behavior and social media use, such as political emotions, were not available. Future research, then, needs to explore these conceptual differences and methodological limitations. With this in mind, this study contributes to a research agenda about the connections and disconnections between social media use and protest behavior over the long run, particularly in the context of emergent democracies where these tools have been relevant in the achievement of policy changes. Future research should elaborate on the arguments on network structure and time dynamics presented here in different contexts in order to observe differences and similarities between different social movements and political cultures. This will lead to the development of more consistent theories on the political impact of social media use..
(16) International Journal of Communication 8 (2014). Facebook, Twitter, and Engagement 2061. References Adimark GfK. (2011). Encuesta: Evaluación gestión del gobierno [Survey: Evaluation of government performance]. Retrieved from http://www.adimark.cl/es/estudios/documentos/0_9_ev_gob_sept2011_.pdf Anduiza, E., Cantijoch, M., & Gallego, A. (2009). Political participation and the Internet: A field essay. Information, Communication & Society, 12, 860–878. doi:10.1080/13691180802282720 Bakardjieva, M. (2011). Reconfiguring the mediapolis: New media and civic agency. New Media & Society, 14, 63–79. doi:10.1177/1461444811410398 Barrionuevo, A. (2011, August 4). With kiss-ins and dances, young Chileans push for reform. The New York Times. Retrieved from http://www.nytimes.com/2011/08/05/world/americas/05chile.html Bennett, W. L. (2008). Changing citizenship in the digital age. In W. L. Bennett (Ed.), Civic life online: Learning how digital media can engage youth (pp. 1–24). Cambridge, MA: The MIT Press. Bimber, B., Flanagin, A. J., & Stohl, C. (2005). Reconceptualizing collective action in the contemporary media environment. Communication Theory, 15, 365–388. doi:10.1111/j.14682885.2005.tb00340.x Bond, R. M., Fariss, C. J., Jones, J. J., Kramer, A. D. I., Marlow, C., Settle, J. E., & Fowler, J. H. (2012). A 61-million-person experiment in social influence and political mobilization. Nature, 489(7415), 295–298. doi:10.1038/nature11421 Boulianne, S. (2009). Does Internet use affect engagement? A meta-analysis of research. Political Communication, 26, 193–211. doi:10.1080/10584600902854363 Cabalín, C. (2014). Online and mobilized students: The use of Facebook in the Chilean student protests. Comunicar, 43, 25–33. doi:10.3916/C43-2014-02 Caliendo, M., & Kopeinig, S. (2008). Some practical guidance for the implementation of propensity score matching. Journal of Economic Surveys, 22, 31–72. doi:10.1111/j.1467-6419.2007.00527.x Centola, D. (2010). The spread of behavior in an online social network experiment. Science, 329, 1194– 1197. doi:10.1126/science.1185231 Chiang, Y.-S. (2007). Birds of moderately different feathers: Bandwagon dynamics and the threshold heterogeneity of network neighbors. Journal of Mathematical Sociology, 31, 47–69. doi:10.1080/00222500601013536 Dalton, R. J., van Sickle, A., & Weldon, S. (2009). The individual-institutional nexus of protest behaviour. British Journal of Political Science, 40, 51–73. doi:10.1017/S000712340999038X.
(17) 2062 S. Valenzuela, A. Arriagada & A. Scherman. International Journal of Communication 8(2014). Dehejia, R. H., & Wahba S. (2002). Propensity score matching methods for non-experimental causal studies. Review of Economics and Statistics, 84, 151–161. doi:10.1162/003465302317331982 Earl, J., & Kimport, K. (2011). Digitally enabled social change: Activism in the Internet age. Cambridge, MA: MIT Press. Ellison, N. B., Steinfield, C., & Lampe, C. (2007). The benefits of Facebook “friends”: Social capital and college students’ use of online social network sites. Journal of Computer-Mediated Communication, 12, 1143–1168. doi:10.1111/j.1083-6101.2007.00367.x Gerber, A. S., Green, D. P., & Larimer, C. W. (2008). Social pressure and voter turnout: Evidence from a large-scale field experiment. American Political Science Review, 102, 33–48. doi:10.1017/S000305540808009X Gerber, A. S., Karlan, D., & Bergan, D. (2009). Does the media matter? A field experiment measuring the effect of newspapers on voting behavior and political opinions. American Economic Journal: Applied Economics, 1(2), 35–52. doi:10.1257/app.1.2.35 Gil de Zúñiga, H., Jung, N., & Valenzuela, S. (2012). Social media use for news and individuals’ social capital, civic engagement, and political participation. Journal of Computer-Mediated Communication, 17, 319–336. doi:10.1111/j.1083-6101.2012.01574.x Gil de Zúñiga, H., & Valenzuela, S. (2011). The mediating path to a stronger citizenship: Online and offline networks, weak ties, and civic engagement. Communication Research, 38, 397–421. doi:10.1177/0093650210384984 Gilbert, E., & Karahalios, K. (2009). Predicting tie strength with social media. In CHI ‘09: Proceedings of the 27th annual SIGCHI conference on Human Factors in Computing Systems (pp. 211–220). New York, NY: ACM Press. Ginsberg, J., Mohebbi, M. H., Patel, R. S., Brammer, L., Smolinski, M. S., & Brilliant, L. (2008). Detecting influenza epidemics using search engine query data. Nature, 457, 1012–1014. doi:10.1038/nature07634 González-Bailón, S., Borge-Holthoefer, J., Rivero, A., & Y. Moreno. (2011). The dynamics of protest recruitment through an online network. Nature Scientific Reports, 1, 197. doi:10.1038/srep00197 Gould, R. V. (1993). Collective action and network structure. American Sociological Review, 58, 182–196. Retrieved from http://www.jstor.org/stable/2095965 Granovetter, M. (1973). The strength of weak ties. American Journal of Sociology, 78, 1360-1380. Retrieved from http://www.jstor.org/stable/2776392.
(18) International Journal of Communication 8 (2014). Facebook, Twitter, and Engagement 2063. Groshek, J. (2012). Forecasting and observing: A cross-methodological consideration of Internet and mobile phone diffusion in the Egyptian revolt. International Communication Gazette, 74, 750– 768. doi:10.1177/1748048512459147 Hargittai, E. (2002). Second-level digital divide: Differences in people’s online skills. First Monday, 7(4). Retrieved from http://firstmonday.org/issues/issue7_4/hargittai/index.html Harlow, S., & Johnson, T. (2011). The Arab Spring: Overthrowing the protest paradigm? How The New York Times, Global Voices and Twitter covered the Egyptian revolution. International Journal of Communication, 5, 1417–1434. Retrieved from http://ijoc.org/ojs/index.php/ijoc/article/view/1239 Hipsher, P. L. (1996). Democratization and the decline of urban social movements in Chile and Spain. Comparative Politics, 28, 273–297. Retrieved from http://www.jstor.org/stable/422208 Ho, D. E., Imai, K., King, G., & Stuart, E. A. (2007). Matching as nonparametric preprocessing for reducing model dependence in parametric causal inference. Political Analysis, 15, 199–236. doi:10.1093/pan/mpl013 Hoffman, L. H. (2006). Is Internet content different after all? A content analysis of mobilizing information in online and print newspapers. Journalism & Mass Communication Quarterly, 83, 58–76. doi:10.1177/107769900608300105 Howard, P. N., Duffy, A., Freelon, D., Hussain, M., Mari, W., & Mazaid, M. (2011). Opening closed regimes: What was the role of social media during the Arab Spring? Seattle, WA: Project on Information Technology and Political Islam, University of Washington. Howard, P. N., & Parks, M. R. (2012). Social media and political change: Capacity, constraint, and consequence. Journal of Communication, 62, 359–362. doi:10.1111/j.1460-2466.2012.01626.x Iacus, S. M., King, G., & Porro, G. (2009). CEM: Coarsened exact matching software. Journal of Statistical Software, 30, 1–27. Retrieved from http://www.jstatsoft.org/v30/i09/ Johnson, P., & Yang, S. (2009, August). Uses and gratifications of Twitter: An examination of user motives and satisfaction of Twitter use. Paper presented at the annual meeting of the Association for Education in Journalism and Mass Communication, Boston, MA. Katz, E. (1957). The two-step flow of communication: An up-to-date report on an hypothesis. Public Opinion Quarterly, 21(1), 61–78. doi:10.1086/266687 Kitts, J. A. (2000). Mobilizing in black boxes: Social networks and participation in social movement organizations. Mobilization, 5, 241-257. Retrieved from: http://mobilization.metapress.com/link.asp?id=5408016w34215787..
(19) 2064 S. Valenzuela, A. Arriagada & A. Scherman. International Journal of Communication 8(2014). Kobayashi, T., Ikeda, K. I., & Miyata, K. (2006). Social capital online: Collective use of the Internet and reciprocity as lubricants of democracy. Information, Communication & Society, 9, 582–611. doi:10.1080/13691180600965575 Koopmans, R. (2004). Protest in time and space: The evolution of waves of contention. In D. A. Snow, S. A. Soule, & H. Kriesi (Eds.), The Blackwell companion to social movements (pp. 19–46). Oxford, UK: Blackwell. Lee, E.-J., & Oh, S. Y. (2012). To personalize or depersonalize? When and how politicians’ personalized tweets affect the public’s reactions. Journal of Communication, 62, 932–949. doi:10.1111/j.14602466.2012.01681.x Lenhart, A., Purcell, K., Smith, A., & Zickuhr, K. (2010). Social media & mobile Internet use among teens and young adults. Washington, DC: Pew Internet & American Life Project. Retrieved from http://pewinternet.org/Reports/2010/Social-Media-and-Young-Adults.aspx Lovejoy, K., & Saxton, G. D. (2012). Information, community, and action: How nonprofit organizations use social media. Journal of Computer-Mediated Communication, 17, 337–353. doi:10.1111/j.1083-6101.2012.01576.x Macafee, T., & De Simone, J. J. (2012). Killing the bill online?: Pathways to young people’s protest engagement via social media. Cyberpsychology, Behavior, and Social Networking, 15(11), 1–6. doi:10.1089/cyber.2012.0153 Marwell, G., & Oliver, P. (1993). The critical mass in collective action: A micro-social theory. New York, NY: Cambridge University Press. McAdam, D., & Paulsen, R. (1993). Specifying the relationship between social ties and activism. American Journal of Sociology, 99, 640–667. Retrieved from http://www.jstor.org/stable/2781286 McPherson, J. M., Smith-Lovin, L., & Cook, J. (2001). Birds of a feather: Homophily in social networks. Annual Review of Sociology, 27, 415–444. doi:10.1146/annurev.soc.27.1.415 Mutz, D. C. (2006). Hearing the other side: Deliberative versus participatory democracy. Cambridge, MA: Cambridge University Press. Östman, J. (2012). Information, expression, participation: How involvement in user-generated content relates to democratic engagement among young people. New Media & Society, 14, 1004–1021. doi:10.1177/1461444812438212 Papacharissi, Z. (Ed.). (2010). A networked self: Identity, community, and culture on social network sites. New York, NY: Routledge..
(20) International Journal of Communication 8 (2014). Facebook, Twitter, and Engagement 2065. Pearce, K. E., & Kendzior, S. (2012). Networked authoritarianism and social media in Azerbaijan. Journal of Communication, 62, 283–298. doi:10.1111/j.1460-2466.2012.01633.x Rogers, E. M. (2003). Diffusion of innovations (5th ed.). New York, NY: Free Press. Rosenbaum, P. R., & Rubin, D. B. (1983). The central role of the propensity score in observational studies for causal effects. Biometrika, 70, 41–50. doi:10.1093/biomet/70.1.41 Rosenbaum, P. R., & Rubin, D. B. (1984). Reducing bias in observational studies using subclassification on the propensity score. Journal of the American Statistical Association, 79, 516–524. doi:10.1080/01621459.1984.10478078 Scherman, A., Arriagada, A., & Valenzuela, S. (in press). Student and environmental protests in Chile: The role of social media. Politics. Scifleet, P., Henninger, M. & Albright, K. H. (2013). When social media are your source. Information Research,18(3), paper C41. Retrieved from http://InformationR.net/ir/18-3/colis/paperC41.html Shah, D. V., Cho, J., Nah, S., Gotlieb, M. R., Hwang, H., Lee, N.-J., et al. (2007). Campaign ads, online messaging, and participation: Extending the communication mediation model. Journal of Communication, 57, 676–703. doi:10.1111/j.1460-2466.2007.00363.x Sinclair, B. (2012). The social citizen: Peer networks and political behavior. Chicago, IL: University of Chicago Press. Smets, K., & van Ham, C. (2013). The embarrassment of riches? A meta-analysis of individual-level research on voter turnout. Electoral Studies, 32, 344–359. doi:10.1016/j.electstud.2012.12.006 Stuart, E. A. (2010). Matching methods for causal inference: A review and a look forward. Statistical Science, 25, 1–21. doi:10.1214/09-STS313 Tarrow, S. (1995). Cycles of collective action: Between moments of madness and the repertoire of contention. In M. Traugott (Ed.), Repertoires and cycles of collective action (pp. 89–115). Durham, NC: Duke University Press. Thoemmes, F. J. (2012). Propensity score matching in SPSS. Retrieved from http://sourceforge.net/p/psmspss/home/Home Tufekci, Z., & Wilson, C. (2012). Social media and the decision to participate in political protest: Observations from Tahrir Square. Journal of Communication, 62, 363–379. doi:10.1111/j.14602466.2012.01629.x.
(21) 2066 S. Valenzuela, A. Arriagada & A. Scherman. International Journal of Communication 8(2014). Valenzuela, S. (2013). Unpacking the use of social media for protest behavior: The roles of information, opinion expression, and activism. American Behavioral Scientist, 57, 920–942. doi:10.1177/0002764213479375 Valenzuela, S., & Arriagada, A. (2011). Politics without citizens? Public opinion, television news, the president, and real-world factors in Chile, 2000–2005. International Journal of Press/Politics, 16, 357–381. doi:10.1177/1940161210379636 Valenzuela, S., Arriagada, A., & Scherman, A. (2012). The social media basis of youth protest behavior: The case of Chile. Journal of Communication, 62, 299–314. doi:10.1111/j.14602466.2012.01635.x van de Donk, W., Loader, B. D., Nixon, P. G., & Rucht, D. (Eds.). (2004). Cyberprotest: New media, citizens and social movements. London, UK: Routledge. Watts, D. J. (1999). Small worlds: The dynamics of networks between order and randomness. Princeton, NJ: Princeton University Press. Wilson, C., & Dunn, A. (2011). The Arab Spring: Digital media in the Egyptian revolution: Descriptive analysis from the Tahrir data set. International Journal of Communication, 5, 1248–1272. Retrieved from http://ijoc.org/ojs/index.php/ijoc/article/view/1180/682 Wolfsfeld, G., Segev, E., & Sheafer, T. (2013). Social media and the Arab Spring: Politics comes first. International Journal of Press/Politics, 18, 115-137. doi:10.1177/1940161212471716.
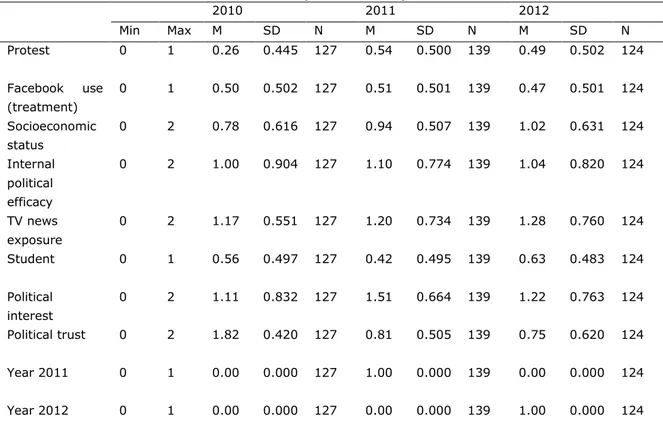
(22) International Journal of Communication 8 (2014). Facebook, Twitter, and Engagement 2067. Appendix A Table A1. Descriptive Statistics for Variables in the Analysis of Facebook Effects (Matched Data). 2010 2011 2012 Protest. Min. Max. M. SD. N. M. SD. N. M. SD. N. 0. 1. 0.17. 0.377. 707. 0.41. 0.492. 829. 0.35. 0.478. 586. 1 Facebook use. 0. 1. 0.74. (treatment) Socioeconomic. 0. 2. 0.77. 0.73. 0.590. 0. 2. 0.94. 0.874. 707. 0.84. 2. 1.14. 0.530. 707. 1.01. 0. 1. 0.53. 0.499. 707. 1.28. 0. 2. 0.92. 0.848. Political trust. 0. 2. 1.73. 0.530. 0.513 0.797 0.731. 707. 0.46. 0.497. 829. 0.85. 1.19. 0.802. 707. 0.67. 0.639. 2. 829. 0.87. 0.584. 586. 0.837. 586. 6 829. 1.15. 0.778. 586. 7 829. 0.44. 0.497. 586. 6 829. 0.95. 0.807. 829. 0.62. 0.632. 0. 3. 586. 0. 0 707. 0.427 2. 8. 1 Political interest. 0.76. 0. 1 Student. 829. 0. 0 0. 0.441. 1. 6. 2. efficacy TV news exposure. 707. 6. status Internal political. 0.436. 1. 586. 2. 0. 586. 3. Year 2011. 0. 1. 0. 0. 707. 1. 0. 829. 0. 0. 586. Year 2012. 0. 1. 0. 0. 707. 0. 0. 829. 1. 0. 586. Source: Youth & Participation surveys (2010–2012), conducted in Chile by the School of Journalism at Universidad Diego Portales and Feedback..
(23) 2068 S. Valenzuela, A. Arriagada & A. Scherman. International Journal of Communication 8(2014). Table A2. Descriptive Statistics for Variables in the Analysis of Twitter Effects (Matched Data). 2010 2011 2012 Protest. Min. Max. M. SD. N. M. SD. N. M. SD. N. 0. 1. 0.26. 0.445. 127. 0.54. 0.500. 139. 0.49. 0.502. 124. 8 Facebook. use. 0. 1. 0.50. (treatment) Socioeconomic. 127. 0.51. 4 0. 2. 0.78. status Internal. 0.502. 7. 0.616. 0. 2. 1.00. 0.904. 139. 0.47. 8 127. 0.94. 0. political. 0.501. 2. 0.507. 127. 1.10. 0.774. 124. 6 139. 1.02. 2. 8. 0.501 0.631. 124. 4 139. 1.04. 1. 0.820. 124. 0. efficacy TV news. 0. 2. 1.17. exposure Student. 0.551. 127. 1.20. 3 0. 1. 0.56. 0.497. 0. 2. 1.11. interest Political trust. 0.832. 127. 0.42. 2. 1.82. 0.420. 127. 1.51. 0. 1. 0.00. 0.000. 127. 0.81. 0. 1. 0.00. 0.000 0. 139. 0.63. 0.664 0.505. 127. 1.00. 0.000. 139. 1.22. 0.00. 0.000 0. 0.483. 124. 0.763. 124. 6 139. 0.75. 0.620. 124. 0 139. 0.00. 0 127. 124. 7. 3. 0 Year 2012. 0.495. 0.760 2. 0. 7 Year 2011. 1.28. 7. 8 0. 139. 5. 7 Political. 0.734. 0.000. 124. 0 139. 1.00. 0.000. 124. 0. Source: Youth & Participation surveys (2010-2012), conducted in Chile by the School of Journalism at Universidad Diego Portales and Feedback..
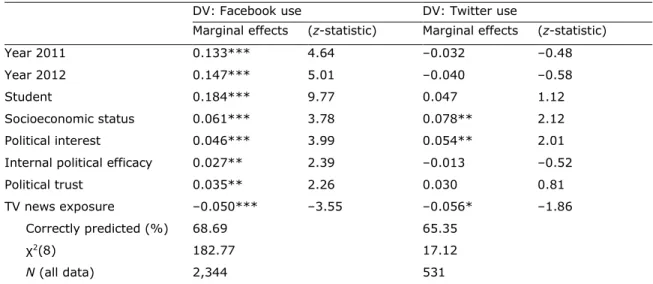
(24) International Journal of Communication 8 (2014). Facebook, Twitter, and Engagement 2069. Appendix B Table B1. Propensity Score Models for Regular Use of Facebook and Twitter. DV: Facebook use. DV: Twitter use. Marginal effects. (z-statistic). Marginal effects. (z-statistic). Year 2011. 0.133***. 4.64. –0.032. –0.48. Year 2012. 0.147***. 5.01. –0.040. –0.58. Student. 0.184***. 9.77. 0.047. 1.12. Socioeconomic status. 0.061***. 3.78. 0.078**. 2.12. Political interest. 0.046***. 3.99. 0.054**. 2.01. Internal political efficacy. 0.027**. 2.39. –0.013. –0.52. Political trust. 0.035**. 2.26. 0.030. 0.81. TV news exposure. –0.050***. –3.55. –0.056*. –1.86. Correctly predicted (%). 68.69. 65.35. χ (8). 182.77. 17.12. N (all data). 2,344. 531. 2. Notes. Cell entries are average marginal effects at the means from binary logistic regressions, with robust z-statistics in parentheses, using the pooled cross-sectional data. The year 2010 is the excluded category. * p ≤ .10; ** p ≤ .05; *** p ≤ .01 (two-tailed).
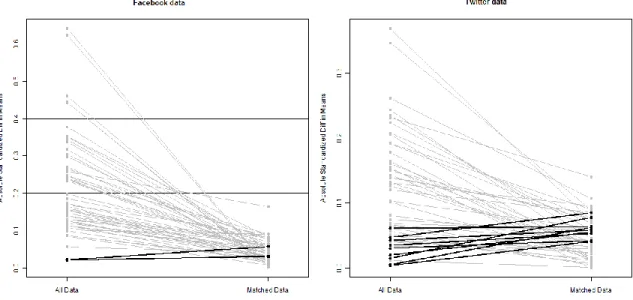
(25) 2070 S. Valenzuela, A. Arriagada & A. Scherman. International Journal of Communication 8(2014). Figure B1. Plots of Standardized Difference of Means of Covariates Before and After Matching.. Appendix C Table C1. Participation in Street Protests Among Young Adults in Chile (Logistic Regressions on Matched Data). N 2010 2011 2012 Treat. Control. Average. Average. Average. marginal. (z-. marginal. (z-. marginal. (z-. effects. statistic). effects. statistic). effects. statistic). Facebook. 1,583. 538. 0.092**. 2.51. 0.067. 1.25. 0.197***. 3.67. Twitter. 195. 195. 0.075. 0.86. 0.055. 0.69. 0.125. 1.43. Notes: Cell entries show average marginal effects, calculated from two-way interactions between the treatment and time dummies, using logistic regression models with socioeconomic status, internal political efficacy, TV news exposure, student, political interest, political trust, and time dummies as independent variables. * p ≤ .10; ** p ≤ .05; *** p ≤ .01 (two-tailed).
(26)
Figure
+4
Documento similar