The Seyfert 2 galaxy NGC 2110: hard X ray emission observed by NuSTAR and variability of the iron K alpha line
12
0
0
Texto completo
(2) 2. Andrea Marinucci, et al.. spectrum extending to energies determined by the electron temperature in the hot corona (Rybicki & Lightman 1979). The power-law index is a function of the plasma temperature T and optical depth τ . NGC 2110, at a redshift z = 0.008, is one of the brightest Seyfert galaxies in the hard X-ray (>10 keV) band and it shows a prominent Fe Kα line accompanied by variable intrinsic emission (Mushotzky 1982; Hayashi et al. 1996). It has been intensively studied by most X-ray observatories, and it has shown very interesting and peculiar characteristics. Malaguti et al. (1999) reported a photon index of Γ = 1.86 analysing BeppoSAX PDS data above 13 keV (consistent with typical values found in Seyfert 1 sources: Nandra & Pounds 1994). However, when 2-10 keV data are considered, the photon index becomes flatter ( Γ = 1.67) and the authors suggested the presence of obscuring material 22 with a column density NH = 4.1+0.5 cm−2 along the −0.3 × 10 line of sight and an additional absorber with NH ∼ 3 × 1023 cm−2 , partially covering the nuclear source. This scenario was confirmed by XMM-Newton, Chandra and Suzaku observations (Evans et al. 2007; Reeves et al. 2006; Rivers et al. 2014). NGC 2110 is one of the very few Seyfert galaxies that, despite the intense iron Kα emission line at 6.4 keV, does not show any Compton reflection from circumnuclear material: values of R 6 0.17 and R 6 0.1 were found with BeppoSAX and Suzaku, respectively (Malaguti et al. 1999; Rivers et al. 2014). If the line emitting material is Compton-thick (NH > 1024 cm−2 ), the iron Kα emission would be accompanied by a Compton reflection component above 10 keV (Matt et al. 1991; George & Fabian 1991). The inferred upper limits on the reflection fraction R in this source suggest that the iron Kα line is not produced by distant, Compton-thick material but is instead emitted by Compton-thin matter, such as in the case of NGC 7213 (Bianchi et al. 2003, 2008). Recently, NuSTAR observed NGC 2110 in an extremely bright state. The lack of reflection components in NGC 2110 arising from the accretion disc or from the putative torus above 10 keV makes this source a perfect candidate for measuring a high-energy cutoff. We present a detailed multi-epoch X-ray study of NGC 2110 including two recent NuSTAR observations, obtained in 2012 and 2013, with the dual aims of studying the behaviour of the Fe Kα line with respect to the highly variable intrinsic continuum and of constraining the high energy cutoff in this source.. 2 2.1. OBSERVATIONS AND DATA REDUCTION NuSTAR. NuSTAR (Harrison et al. 2013) observed NGC 2110 with its two coaligned X-ray telescopes with corresponding focal planes: Focal Plane Module A (FPMA) and B (FPMB) starting on 2012 October 5 and 2013 February 14 for a total of ∼ 32 ks and ∼ 26 ks of elapsed time, respectively. The Level 1 data products were processed with the NuSTAR Data Analysis Software (NuSTARDAS) package (v. 1.3.0). Cleaned event files (level 2 data products) were produced and calibrated using standard filtering criteria with the nupipeline task and the latest calibration files available in the NuSTAR calibration database (CALDB). Both. extraction radii for the source and background spectra were 1.5 arcmin. After this process, the net exposure times for the two observations were 15 ks and 12 ks, with 3-80 keV count rates of 6.53 ± 0.02 and 4.50 ± 0.02 cts s−1 for FPMA, and 6.32 ± 0.02 and 4.25 ± 0.02 cts s−1 for FPMB. The two pairs of NuSTAR spectra were binned in order to over-sample the instrumental resolution by at least a factor of 2.5 and to have a Signal-to-Noise Ratio (SNR) greater than 5σ in each spectral channel.. 2.2. Suzaku. NGC 2110 was observed by Suzaku starting on 2005 September 16 (OBSID 100024010) and seven years later, starting on 2012 August 31 (OBSID 707034010). Data were taken from the X-ray Imaging Spectrometer (XIS) and the Hard X-ray Detector (HXD). We reprocessed the event files with the latest calibration files available (2014-02-03) using ftools 6.14 and suzaku software Version 21, adopting standard procedures and recommended screening criteria. The source extraction radius was 1.8 arcmin. Background spectra were extracted from source-free regions of 1.8 arcmin radius. Response matrices and ancillary response files were generated using xisrmfgen and xisarfgen. The 0.5-10 keV spectra extracted from the front-illuminated XIS0 and XIS3 were co-added using the ftool addascaspec, for net exposure times of 102 ks and 103 ks for the two data sets. Spectra were binned in order to over-sample the instrumental resolution by at least a factor of three and to have no less than 30 counts in each background-subtracted spectral channel. This allows the applicability of χ2 statistics. We reduced the HXD PIN data using the aepipeline reprocessing tool, and for background determination we downloaded and utilized the tuned non-X-ray background (NXB) provided by the HXD team. We extracted source and background spectra using the same good time intervals.. 2.3. XMM-Newton. NGC 2110 was observed by XMM-Newton (Jansen et al. 2001) for ∼60 ks, starting on 2003 March 5 (OBSID 0145670101) with the EPIC CCD cameras, the Pn (Strüder et al. 2001) and the two MOS (Turner et al. 2001), operated in large window and thin filter mode. Data from the MOS detectors are not included in our analysis due to the lower statistics of the spectra. The extraction radii and the optimal time cuts for flaring particle background were computed with SAS 13 (Gabriel et al. 2004) via an iterative process which leads to a maximization of the SNR, similar to the approach described in Piconcelli et al. (2004). The resulting optimal extraction radius was 38 arcsec and the background spectra were extracted from source-free circular regions with a radius of about 50 arcsec. After this process, the net exposure time was 44 ks for the EPIC-Pn. Spectra were binned in order to over-sample the instrumental resolution by at least a factor of three and to have no less than 30 counts in each backgroundsubtracted spectral channel..
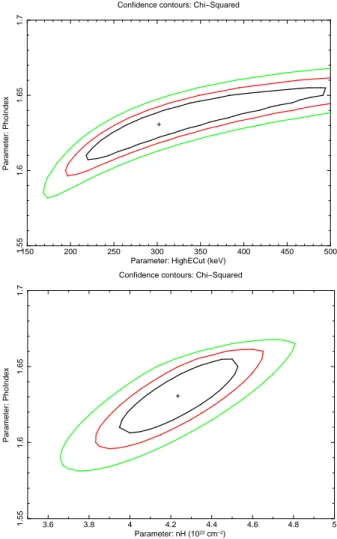
(3) The hard X-ray emission of NGC 2110 observed by NuSTAR Date. Texp (ks). 35459001 35459002 35459003 35459004 35459005 80364001* 35459006 80364002* 35459007. 2006-03-25 2006-04-08 2006-04-15 2008-08-31 2009-10-12 2012-10-05 2013-02-03 2013-02-15 2013-03-09. 8.3 9.2 2.3 2.2 3.5 7.1 14.1 0.9 2.7. Confidence contours: Chi−Squared. 0.1. Parameter: R1. 0.2. 0.3. Obs. ID. 3. Table 1. Observation log for the Swift monitoring of NGC 2110. Observations IDs, dates and net exposure times (after filtering and correction for photon pile-up) are reported. Asterisks indicate observations simultaneous with NuSTAR.. 0. +. 1.64. 2.4. Swift. There were 9 Swift/XRT observations of NGC 2110, in 2006, 2008, 2009, 2012 and 2013. The first 8 observations were carried out with the photon counting (PC) mode, while the last observation was in window timing (WT) mode (Table 1). ObsIDs 80364001 and 80364002 are simultaneous with NuSTAR. We reprocessed all the datasets to generate cleaned event files with the xrtpipeline script included in the heasoft version 6.13. The PC mode observations are all affected by pile-up, while the final observation, obtained in WT mode, does not have pile-up issues. To correct the pileup, we extracted the source spectrum within a 72 arcsec radius circular region, excluding the central 10 arcsec radius aperture for the PC mode datasets. Obs. IDs, dates and net exposure times are listed in Table 1.. 2.5. Chandra. NGC 2110 was observed by Chandra on 2000-04-22 with the ACIS-S camera (Obs. ID 883), on 2001-12-19 with three consecutive HETGs pointings (Obs. ID 3143, 3417 and 3418) and on 2003-03-05 with the HETGs (Obs. ID 4377). All these observations are discussed in detail in Evans et al. (2007) where the four HETG spectra were merged. Since pile-up was found in the ACIS-S observation, we do not use this spectrum in our analysis. Data were reduced using ciao 4.5 and the latest CALDB files, we merged Obs. IDs 3143, 3417 and 3418 spectra using the add− grating− order and add− grating− spectra tools. The resulting exposure times are 105 ks and 95 ks for the 2001 and 2003 HETGs data, respectively. Data were binned to have no less than 30 counts in each spectral channel.. 2.6. BeppoSAX. The source was observed by BeppoSAX on 1997-10-12 with the MECS for a net exposure time of 76 ks. Reduced data were downloaded from the BeppoSAX online data archive 1 .. 1. available at: http://www.asdc.asi.it/mmia/index.php?mission=saxnfi. 1.66. 1.68. 1.7 1.72 1.74 Parameter: PhoIndex. 1.76. 1.78. 1.8. Figure 1. Contour plot between reflection fraction R and photon index Γ for the high flux NuSTAR observation in 2012, when only 10–80 keV data are considered. The solid black, red and green lines correspond to 68%, 90% and 99% confidence levels, respectively.. 3. SPECTRAL ANALYSIS. We first study the simultaneous NuSTAR and Swift data to probe the primary radiation from the AGN and the properties of the hot corona. We then perform a multi-epoch phenomenological X-ray analysis to study the behavior of the Fe Kα emission line in response to variability of the nuclear continuum. In previous work, broad band analyses of some data sets revealed the presence of extra-nuclear emission in the softer (E<1 keV) part of the spectra (Evans et al. 2006; Reeves et al. 2006; Evans et al. 2007; Rivers et al. 2014), the analysis of this component is beyond the scope of this work. We focus our analysis on the 3-79 keV band where the contribution from soft diffuse emission is negligible. The adopted cosmological parameters are H0 = 70 km s−1 Mpc−1 , ΩΛ = 0.73 and Ωm = 0.27, i.e. the default ones in xspec 12.8.1 (Arnaud 1996). Errors correspond to the 90% confidence level for one interesting parameter (∆χ2 = 2.7), if not stated otherwise.. 3.1. NuSTAR 3–80 keV spectral analysis. The X-ray spectra of NGC 2110 have been widely studied in the past few years and several analyses have shown the presence of a Γ ∼ 1.7 power law continuum partially covered by several layers of absorbing material with column densities in the range 2–6×1022 cm−2 (Evans et al. 2007; Rivers et al. 2014). Above 10 keV the effect of this absorbing material can be neglected and we therefore start our spectral analysis fitting the NuSTAR spectra in the 10–80 keV range, to have a direct measurement of the photon index of the primary power law. We will test a posteriori if this assumption is correct. Our model is composed of a power law, with the only free parameters in the fit being the photon index, the normalization of the power law and the cross-calibration factors between the FPMs. When the model is applied to the NuSTAR 2012 and 2013 spectra, the fit is good.
(4) 4. Andrea Marinucci, et al. Confidence contours: Chi−Squared. 10−4. 5. 1.65. +. 1.6. Parameter: PhoIndex. 10−3. 0. 1.55. −5 −10 10. 20. 50. 150. Energy (keV). (χ2 /dof=568/601=0.95) and no strong residuals are present across the whole energy band. The best fit photon index is Γ = 1.691 ± 0.015 and the cross-calibration factors are 2013 K2012 A−B = 1.017 ± 0.015 and KA−B = 1.000 ± 0.020. If we leave the photon indices of the 2012 and 2013 observations free to vary independently no improvement in the fit is found and they are both consistent with the inferred single best fit value. A neutral absorber along the line of sight does not improve the fit (∆χ2 = 2 for one additional variable parameter) and only an upper limit NH < 8 × 1022 cm−2 is found: this confirms that the circumnuclear absorbers in this object do not affect the analysis of the 10-80 keV NuSTAR spectra. In the past, high energy observations of NGC 2110 only revealed upper limits for the fraction R of the Compton reflection of the primary continuum by cold, neutral material (Malaguti et al. 1999; Rivers et al. 2014) which is usually found in Seyfert galaxies (Dadina 2008; Ricci et al. 2011). The addition of such a component in our fit, modeled with pexrav (Magdziarz & Zdziarski 1995) with Γ fixed to that of the primary continuum and the inclination angle to 60 degrees, does not lead to an improvement of the fit (∆χ2 = 2 for two additional variable parameters) and only upper limits R2012 < 0.15 and R2013 < 0.14 in the reflection components are found for the 2012 and 2013 observations, respectively. The contour plot between R2012 and Γ is shown in Fig. 1. Other parameters do not differ from best the fit values presented above. When we add a cutoff power law in our fit (model cutoffpl in xspec) no significant improvement is found (∆χ2 = 2 for one additional variable parameter): we find a best fit value of Γ = 1.647+0.014 −0.053 and a lower limit Ec > 230 keV for the cutoff energy.. 250. 300 350 Parameter: HighECut (keV). 400. 450. 500. Parameter: PhoIndex. 1.7. Confidence contours: Chi−Squared. +. 1.55. Figure 2. 3-80 keV simultaneous NuSTAR+Swift best fit. NuSTAR FPMA and FPMB spectra are in black and red for the 2012 observation, green and blue for the 2013 one. Swift XRT 2012 data are in light blue and 2013 spectra in magenta. Residuals are shown in the bottom panel, when a model composed of an absorbed cutoff power law and a Gaussian line at 6.4 keV is applied to our data set. No strong residuals are present accross the whole energy band.. 200. 1.65. 5. 1.6. sign(data−model) × ∆ χ2. normalized counts s−1 keV−1 cm−2. 1.7. NuSTAR FPMA/B and Swift XRT best fit. 3.6. 3.8. 4. 4.2 4.4 Parameter: nH (1022 cm−2). 4.6. 4.8. 5. Figure 3. Top panel: Contour plot between photon index Γ and cutoff energy Ec , when simultaneous 3–80 keV Swift+NuSTAR data are considered. The solid black, red and green lines correspond to 68%, 90% and 99% confidence levels, respectively. Highenergy cutoff values are limited to 6500 keV because it is the maximum value allowed in the cutoffpl model. Bottom panel: Contour plot between photon index Γ and absorbing column density along the line of sight.. 3.2. NuSTAR+Swift 3–80 keV spectral analysis. We then consider 2012 and 2013 NuSTAR data down to 3 keV and introduce the simultaneous Swift-XRT spectra, with net exposure times of 7.1 ks and 0.9 ks, respectively. The model is composed of an absorbed power law with a high-energy cutoff and two Gaussian lines, to reproduce the Fe Kα and Kβ emission at 6.4 keV and 7.056 keV, respectively. We then convolved the baseline model with a Galactic column density NHG = 1.62 × 1021 cm−2 (Kalberla et al. 2005), modeled with tbabs in xspec, using solar abundances (Wilms et al. 2000) and cross-sections from Verner et al. (1996). In xspec the model reads as follows: tbabs*zwabs*(cutoffpl+zgauss+zgauss). XRTFPMA cross-calibration factors are introduced as a variable parameters. The fit is good (χ2 /dof=876/881=0.99) and no strong residuals are seen (Fig. 2). The inclusion of Compton reflection in the fit leads to an insignificant improvement of the fit (∆χ2 = 2 for two additional variable parameters) and its contribution to the.
(5) The hard X-ray emission of NGC 2110 observed by NuSTAR Instrument. Date. NH. Γ. Fe Kα En.. σ. EW. FKα. FKβ. BeppoSAX Chandra Chandra XMM Suzaku Suzaku NuSTAR NuSTAR. 1997-10-12 2001-12-19 2003-03-05 2003-03-05 2005-09-16 2012-08-31 2012-10-05 2013-02-14. 4.3 ± 0.9 4.0 ± 1.8 < 4.5 3.9 ± 0.4 3.8 ± 0.2 4.5 ± 0.2 4.0 ± 0.4 4.0 ± 0.7. 1.74 ± 0.09 1.67+0.30 −0.25 1.25+0.48 −0.33 1.57 ± 0.05 1.63 ± 0.02 1.63 ± 0.02 1.64 ± 0.03 1.64 ± 0.05. 6.43+0.06 −0.09 6.400 ± 0.008 6.391 ± 0.016 6.42 ± 0.01 6.40 ± 0.01 6.39 ± 0.01 6.33 ± 0.07 6.45 ± 0.07. < 280 16+14 −10 30+31 −16 62 ± 14 50 ± 15 < 55 < 192 175+200 −140. 194+69 −50 90+30 −25 135+60 −45 145 ± 15 55 ± 5 50 ± 7 35 ± 10 90+42 −25. 8.3+3.0 −2.3 5.4+1.8 −1.5 5.5+2.5 −2.0 5.0 ± 0.5 8.4 ± 0.8 9.7 ± 0.9 9.5 ± 3.0 16.0+8.0 −4.0. < 1.3 < 2.8 < 2.0 0.8 ± 0.3 0.6 ± 0.5 < 1.0 < 2.3 < 3.4. F3−10. 5 keV. 2.77 ± 0.05 3.84 ± 0.07 2.80 ± 0.07 2.26 ± 0.03 9.90 ± 0.03 11.8 ± 0.1 17.1 ± 0.2 11.7 ± 0.2. Swift best fit parameters χ2 /d.o.f.. Date. NH. Γ. Fe Kα En.. σ. EW. FKα. FKβ. F3−10. 59/61 83/85 15/24 17/15 37/35 106/94 170/159 9/8 81/56. 2006-03-25 2006-04-08 2006-04-15 2008-08-31 2009-10-12 2012-10-05 2013-02-03 2013-02-15 2013-03-09. 3.5 ± 2.5 3.0 ± 2.0 4.0 ± 2.3 7.5 ± 3.0 5.5 ± 3.5 5.9 ± 2.5 6.3 ± 1.9 7.0 ± 3.5 4.3 ± 1.2. 1.35 ± 0.45 1.25 ± 0.35 1.7* 1.7* 1.43+0.70 −0.51 1.7+0.3 −0.3 1.75+0.25 −0.25 1.7* 1.7*. 6.50 ± 0.15 6.50+0.11 −0.08 6.7 ± 0.5 6.4* 6.2 ± 0.1 6.4* 6.4* 6.4* 6.2 ± 0.1. 115+80 −85 < 250 < 350 60* < 350 60* 60* 60* 60*. 190 ± 115 100+80 −64 450+665 −400 < 95 170+120 −120 < 35 < 50 < 250 160 ± 100. 25.0 ± 15.0 +10.2 14.7−9.3 +78.5 50.9−44.5 < 9.0 35 ± 25 < 30.7 < 14 < 53 22.7 ± 12.5. < 13 <7 < 34 < 44 < 38 < 15 < 13 < 30 < 10. 8.9 ± 0.5 9.8 ± 0.5 8.1 ± 0.9 5.9 ± 0.9 11.4 ± 0.8 17.3 ± 0.4 16.0 ± 0.9 12.5 ± 1.6 8.0 ± 0.8. keV. Table 2. Best fit parameters when the 3-10 keV phenomenological fit is applied to the data. Column densities are in 1022 cm−2 units, energy centroids are in keV units, equivalent widths (EW) and widths (σ) of the Fe Kα line in eV units, line fluxes are in 10−5 ph cm−2 s−1 units and 3-10 keV observed fluxes are in 10−11 erg cm−2 s−1 units.. 2012 2013 total 3–80 keV flux is Frefl < 1.5% and Frefl < 2.5%. Best 2012 fit cross-calibration factors are KXRT−FPMA = 0.98 ± 0.03 2013 and KXRT−FPMA = 0.95 ± 0.09. We measure a lower limit for the high energy cutoff Ec > 210 keV and in Fig. 3 the contour plots of Ec vs Γ as well as NH vs Γ are shown. Best fit values do not significantly differ from the ones discussed in Sect. 3.1. We next use a more physical model (compTT in xspec; Titarchuk 1994) to measure the coronal temperature kTe and optical depth τ . In this model the soft seed photon spectrum is a Wien law; we fixed the disc temperature to 30 eV, appropriate for MBH ≈ 108 M⊙ (the black hole mass in NGC 2110 is estimated to be MBH ∼ 2 × 10⁸ M⊙ via the MBH –σ relation; Moran et al. 2007). In the case of a slab geometry the fit is good (χ2 /dof= 873/880 = 0.99) and best fit parameters kTe = 190 ± 130 keV and τ = 0.22+0.51 −0.05 are found. The measured iron Kα equivalent width for the 2012 and 2013 observations (EW≃35–200 eV, Table 2) are unusually large given the observed Compton reflection for the line to originate from reflection from Compton thick material. We therefore confirm the result in Malaguti et al. (1999) from the low flux BeppoSAX observation and with Suzaku (Reeves et al. 2006; Rivers et al. 2014). If the Compton reflection and the iron Kα emission line arise from the same distant, Compton-thick material, they can be selfconsistently modelled using the pexmon model in Xspec (Nandra et al. 2007), with the inclination angle fixed at 60 degrees. This leads to a best fit χ2 /dof=930/884=1.06 with visible residuals around iron Kα. Leaving the iron abundance free to vary a significant improvement in the fit is found (∆χ2 = 34 for one additional variable parameter). and we find a AFe > 22 with respect to the solar value. No significant variation between photon index, reflection fraction, absorbing column densities, cross-calibration factors and best fit parameters discussed above is found. Such a large iron abundance is unrealistic and therefore we discard this scenario. The alternative scenario we consider is the one in which the line is produced by Compton-thin material (NH = 1022 − 1023 cm−2 ) that does not contribute significantly to the Compton reflection (Matt et al. 2003). We model the Compton reflection and iron fluorescent lines with MYTorus scattered and line components (Murphy & Yaqoob 2009; Yaqoob 2012). We add a further component to reproduce absorbing material along the line of sight. The assumed geometry is a torus of gas and dust with a 60 degree opening angle. When we apply this model to the 2012 and 2013 Swift+NuSTAR simultaneous data, we leave the normalization of the primary continua and the column density along the line of sight as variable parameters. Normalizations and column densities of the scattered and line components are linked and free to vary. The fit is good (χ2 /dof= 907/884 = 1.02) and we find no variations from best fit parameters discussed above are found. The best fit value for the column density of the scattering material producing the iron Kα is NH = 2.0 ± 1.1 × 1023 cm−2 . The ratios between the scattered and primary components’ normalizations is consistent with unity, the standard MyTorus configuration (coupled reprocessor model in Yaqoob 2012), in which the torus is not aligned along the line of sight. The value of the column density of the iron Kα emitting gas is consistent with the estimate presented in Bianchi et al. (2003) (NH ≃ 3 × 1023 cm−2 ) for the case of NGC 7213,.
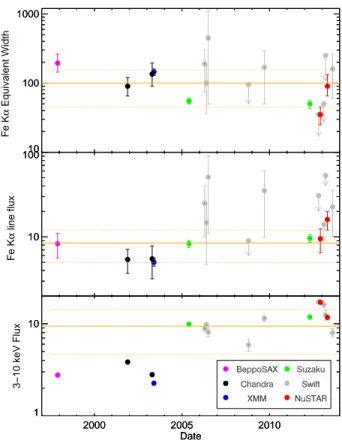
(6) 6. Andrea Marinucci, et al. NGC 2110 − best fit 5×10⁻³. Fe Kα Equivalent Width. 2×10⁻³. 10−3. 5×10⁻⁴. 10 100 5. 0. −5 5 Energy (keV). Figure 4. 3-10 keV phenomenological best fit. EPIC-Pn data are in black, Suzaku data from the 2005 and 2013 observations are in red and green, respectively. NuSTAR FPMA and FPMB data from the 2012 observation are in light and dark blue while NuSTAR FPMA and FPMB spectra obtained in 2013 are in orange and yellow, respectively.. where the authors assumed a Broad Line Region covering factor fc = 0.35, an EW≃ 100 eV and a photon index Γ = 1.69. This suggests that the two sources do indeed present similar features in the X-ray band.. 3.3. Time history of the iron Kα line. We apply the model described in Sect. 3.2 (an absorbed primary continuum and two Gaussian lines) to the archival 3-10 keV data sets. This phenomenological fit is intended for studying the Fe Kα equivalent width and flux on time scales of months and years. We first fit data with high SNR from XMM-Newton, Suzaku and NuSTAR with the above model: the fit is good (χ2 /dof=628/544=1.15) and no strong residuals are present across the energy band (Fig. 4). The best fit parameters are reported in Table 2. If we introduce a reflection component in our fit, no variation in the parameters of the lines is found with respect to the best fit values. Then, we fit the 3-10 keV spectra of the nine Swift snapshots of the source, fixing the photon index to Γ = 1.7 (as inferred from the high energy data analysis).Further parameters such as centroids and widths of the Fe Kα emission line are fixed to 6.4 keV and 60 eV (as inferred from the XMM and Suzaku analyses), respectively, where SNR was too poor to accurately measure these parameters. Best fit χ2 /dof values are reported in Table 2. Fig. 5 shows the time evolution of the equivalent width of the Fe Kα line flux and the observed 3-10 keV flux of the source. The object has a variable intrinsic emission in the 3-10 keV energy range: we measure a factor of ∼7.5 between the 2003 XMM-Newton and 2012 NuSTAR observations, while we find a factor ∼ 1.5 between the Swift observation on 2013-02-03 and the NuSTAR observation on 2013-02-14 on a 10 day time scale. The variability of the Fe Kα emission line carries information about the distance and ionization state of the emitting material (width and energy centroid). Indeed, the. Fe Kα line flux. sign(data−model) × ∆ χ2. 2×10⁻⁴. 100. 3−10 keV Flux. normalized counts s−1 keV−1 cm−2. 1000. 10. 10. 1 2000. 2005 Date. 2010. Figure 5. Time evolution of iron Kα parameters and 3-10 keV observed flux of the source (not corrected for absorption). Equivalent widths are in eV units, line fluxes are in 10−5 ph cm−2 s−1 units and observed 3-10 keV fluxes in 10−11 erg cm−2 s−1 units. Solid and dashed horizontal lines represent mean and standard deviations, respectively.. measured Fe Kα flux in the 2003 XMM observation is significantly lower than the one measured with Suzaku three years later. In Fig. 6 we plot Fe Kα fluxes and equivalent widths c (EW) vs the observed 3-10 keV flux (F3−10 ), respectively. c We examined the correlations between EW and F3−10 and c between the Fe Kα flux and F3−10 by performing a linear fit using only high SNR observations (i.e. removing Swift data points). We find a best fit relation EW = (−8.2 ± 1.6) × c F 3−10 + (163 ± 20) with a Spearman’s rank correlation coefficient ρ = −0.88 ± 0.06 and a null-hypothesis-probability of 5.5 × 10⁻³ . The other best fit relation is FKα = (0.42 ± 0.17)×F c3−10 +(5.2±1.0) with a Spearman’s rank correlation coefficient ρ = 0.67 ± 0.09 and a null-hypothesis-probability of 9.1×10⁻² . Both best fit curves are shown in Fig. 6. When we introduce the Swift data points in the fit, we obtain less statistically significant relations, with null-hypothesisc probabilities of 3.9 × 10⁻² and 0.37 for the EW–F3−10 and c FKα –F3−10 relations, respectively..
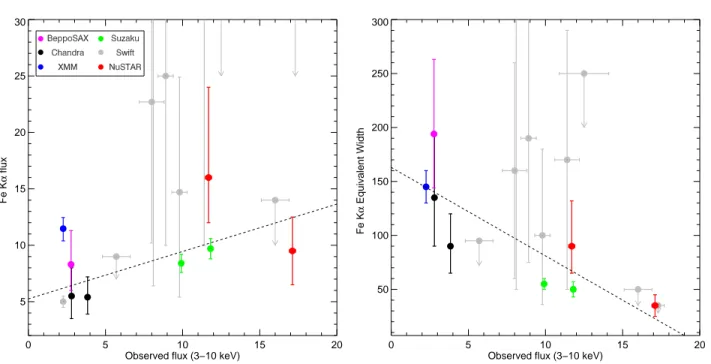
(7) 30. 300. 25. 250. 20. 200. Fe Kα Equivalent Width. Fe Kα flux. The hard X-ray emission of NGC 2110 observed by NuSTAR. 15. 7. 150. 100. 10. 50 5. 0. 5. 10 Observed flux (3−10 keV). 15. 20. 0. 5. 10 Observed flux (3−10 keV). 15. 20. Figure 6. Left panel: Iron Kα flux (in 10−5 ph cm−2 s−1 units) plotted against intrinsic 3-10 keV flux (in 10−11 erg cm−2 s−1 units). Right panel: Iron Kα equivalent widths (in eV units) plotted against intrinsic 3-10 keV flux (in 10−11 erg cm−2 s−1 units). Dashed black lines represent best fit relations, when a linear fit is applied using only high SNR observations (i.e. removing Swift data points).. 4 4.1. DISCUSSION Properties of the hot corona. Recently, the NuSTAR’s high sensitivity above 10 keV has led to high-energy cutoff measurements in a number of nearby Seyfert galaxies: IC 4329A (178+74 −40 keV, Brenneman et al. 2014), SWIFT J2127.4+5654 (108+11 −10 keV, Marinucci et al. 2014), Ark 120 (Ec > 190 keV, Matt et al. 2014) and 3C 382 (214+147 −63 keV, Ballantyne et al., submitted). The broad band analysis of NGC 2110 presented in Sect. 3.1 leads to a lower limit on the high-energy cutoff, Ec > 210 keV. The unabsorbed 2–10 keV luminosity ranges between LX =0.4–3.5×1043 erg s−1 (considering the 2003 XMM and 2012 NuSTAR observations as low and high flux states, respectively). If we use the 2–10 keV bolometric corrections presented in Marconi et al. (2004), the bolometric luminosity ranges between Lbol =0.6–9×1044 erg s−1 . A black hole mass of MBH ≃ 2 × 10⁸ M⊙ (Merloni et al. 2003; Moran et al. 2007) leads to an Eddington luminosity LEdd ≃ 2.4 × 1046 erg s−1 . Therefore, for NGC 2110 we estimate Lbol /LEdd ≃ 0.25–3.7 × 10⁻² . This value is at the lower end of the distribution recently measured in CAIXA (Catalog of AGN in the XMM-Newton Archive) for a sample of 156 AGN (Bianchi et al. 2009). NGC 2110 is the second Seyfert galaxy kwown to unambiguously lack reprocessed emission from distant Comptonthick material and to show an iron Kα emission line likely produced by Compton-thin material. NGC 7213 is the other source known to have similar properties (Bianchi et al. 2003, 2008; Lobban et al. 2010). The latter is also accreting at a low Eddington rate (Lbol /LEdd ∼ 3 × 10⁻³ ) and Bianchi et al. (2008) reported a Broad Line Region origin for the iron Kα line. Interestingly, even though the two sources show remarkably similar spectral features in the X-. rays, a high energy cutoff Ec = 95+50 −20 keV was detected in NGC 7213 in the simultaneous XMM-BeppoSAX data (Bianchi et al. 2004). In the near future, more AGN will be observed by NuSTAR and we will be able to investigate the coronal properties (temperature, geometry, link to the reflected emission from the accretion disk) with greater detail in additional low accretion rate objects.. 4.2. Iron Kα temporal behavior. We analyzed the 3-10 keV spectra of NGC 2110 from several X-ray observatories, spanning a period of 16 years. Large variations in the observed flux of the source and in the Fe Kα line flux and equivalent width are apparent. If the Fe Kα line is produced by cold, distant matter we expect a constant line flux and an EW linearly anti-correlated with the intrinsic flux of the source. On the other hand, if the Fe Kα line-emitting material is closer than distances corresponding to the time scales between the observations we expect a constant EW and a line flux linearly correlated with the illuminating continuum. We instead find a correlation between the Fe Kα flux and the 3-10 keV obc ) and an anti-correlation served flux FKα ∝ 0.42 × (F3−10 between the Fe Kα EW and the 3-10 keV observed flux c EW ∝ −8.2 × (F3−10 ). We therefore propose a scenario where the Fe Kα line is the sum of two distinct components, one constant and produced from material distant from the nucleus (the putative “torus”) and the other one variable and linearly correlated with the primary flux that is likely associated with the Broad Line Region. In this scenario the intercept of the relation between the Fe Kα flux and the 3-10 keV observed flux gives the amplitude of the constant component. We find a value of (5.2 ± 1.0) × 10−5 ph cm−2 s−1 ,.
(8) 8. Andrea Marinucci, et al.. perfectly consistent with the resolved Chandra component (Table 2). The Compton reflection fraction associated to this constant iron Kα component is consistent with the one found in the NuSTAR + Swift analysis (Sect. 3.2). The emitting structure responsible for the variable component of the Fe Kα line, closer to the nucleus than the constant one, was discussed in Evans et al. (2007). These authors detected a modest broadening of the Fe Kα line in multi-epoch coadded HEG spectra, with a line width −1 σ = 4500+3000 . We speculate that this struc−2200 km s ture could be the same responsible for the broad, doublepeaked Hα lines (FWHM ∼ 13, 000–17, 000 km s−1 ) detected in optical spectro-polarimetric observations of this source (Moran et al. 2007; Tran 2010). The Astro-H satellite, with its unprecedented combination of spectral resolution and collecting area at 6-7 keV, will allow us to resolve the iron line profile at 6.4 keV in NGC 2110 and determine the location of the circumnuclear emitting material and its Fe abundance. 4.3. A closer look to the circumnuclear environment. It is interesting to note that NGC 2110 appears to show features at infrared wavelenghts arising from complex circumnuclear regions. If we consider the mid-infrared luminosity L12µm = 1.0 × 1043 erg/s, reported in Hönig et al. (2010) and the 2–10 keV luminosity range discussed above, NGC 2110 lies on the LMIR ∝ (LX )1.11 relation inferred in Gandhi et al. (2009), who analized a sample of 42 Seyfert galaxies. This indicates that the geometry of the infrared emitter in NGC 2110 does not differ dramatically from other Seyfert galaxies. To produce enough IR continuum emission, the main requirement is enough dust with a sufficient covering factor to reprocess the intrinsic AGN power. This could be satisfied by a number of models, including a Comptonthin torus, or an extended dusty wind (Hönig et al. 2013, and references therein). In this way, one could potentially have strong dust emission, with very little accompanying X-ray Compton reflection. In addition, NGC 2110 is one of the few Seyfert galaxies (together with NGC 7213) that also shows Silicate dust features in emission (Hönig et al. 2010). The origin of Silicate emission is not fully understood even in Type 1 AGN, with non-standard dust grain properties, emission from a clumpy torus with a relatively small number of dust clumps, or emission from an extended dusty component in the Narrow Line Region, all invoked as possible sources (Sturm et al. 2005; Shi et al. 2006). Mason et al. (2009) discussed in detail such a feature and found that the mid-IR component in NGC 2110 cannot be extended more than 32 pc, ruling out extended reflecting clouds as seen in NGC 4945 (Marinucci et al. 2012). We conclude that a standard dusty torus/dusty wind model, but with a gas column density in the Compton-thin regime could explain the X-ray and midIR characteristics of NGC 2110. Beckmann & Do Cao (2010) reconstructed the spectral energy distribution of NGC 2110 using simultaneous INTEGRAL and Swift data taken in 2008 and 2009, reporting features usually shown by radio-loud sources. However, we do not confirm the flat photon index and cutoff energies they report. We use the radio fluxes at 6 cm (F6cm ≃. 165 mJy, Griffith et al. 1995) and 20 cm (F20cm ≃ 300 mJy, Brown et al. 2011) and compare them with the 210 keV fluxes we found. No significant deviations from relations between radio and X-ray emission usually found in radio-quiet Seyferts are present (Panessa et al. 2007; Bianchi et al. 2009, and references therein). Evans et al. (2006) analyzed the Chandra, HST, and VLA imaging observations and found a small radio jet (extended by ∼ 5′′ accross the nucleus). However, the authors discarded the possibility of a synchrotron origin for the X-ray emission in NGC 2110, since the radio and X-ray emission are not spatially coincident.. 5. SUMMARY AND CONCLUSIONS. We report a multi-epoch X-ray spectral analysis of the bright Seyfert 2 galaxy NGC 2110, spanning a period of 16 years. We focus on recent observations of the source with NuSTAR in 2012, when the source was at the highest flux level ever observed, and in 2013, when the source had more typical flux levels. Our results can be summarized as follows: • a high energy cutoff Ec > 210 keV has been inferred, with an upper limit on the Compton reflection contribution of R < 0.14, confirming results from past high-energy BeppoSAX and Suzaku observations (Malaguti et al. 1999; Reeves et al. 2006; Rivers et al. 2014); • when multi-epoch data are considered,we find a correlation between Fe Kα EW and intrinsic 3-10 keV flux c (EW ∝ −8.2 × F3−10 ) and an anti-correlation between Fe c ); Kα flux and intrinsic 3-10 keV flux (FKα ∝ 0.42 × F3−10 • the Fe Kα line is likely the sum of two components: one constant (originating from distant Compton-thick material) and the other one variable and linearly correlated with the source flux (from matter at distances compatible with the Broad Line Region). Using MyTorus selfconsistent modeling, we find that the line could be produced by scattering material with a global covering factor of 0.5 with NH = 2.0 ± 1.1 × 1023 cm−2 ; • the source presents remarkably similar features to the low accretion rate Seyfert 1 galaxy NGC 7213 in the Xray band (lack of Compton reflection, contribution from Compton-thin material to the Fe Kα line emission) and in the infrared, where Silicate dust emission was reported in Hönig et al. (2010).. ACKNOWLEDGEMENTS AM and GM acknowledge financial support from Italian Space Agency under grant ASI/INAF I/037/12/0-011/13 and from the European Union Seventh Framework Programme (FP7/2007-2013) under grant agreement n.312789. MB acknowledges support from the International Fulbright Science and Technology Award. This work was supported under NASA Contract No. NNG08FD60C, and made use of data from the NuSTAR mission, a project led by the California Institute of Technology, managed by the Jet Propulsion Laboratory, and funded by the National Aeronautics and Space Administration. We thank the NuSTAR Operations,.
(9) The hard X-ray emission of NGC 2110 observed by NuSTAR Software and Calibration teams for support with the execution and analysis of these observations. This research has made use of the NuSTAR Data Analysis Software (NuSTARDAS) jointly developed by the ASI Science Data Center (ASDC, Italy) and the California Institute of Technology (USA).. REFERENCES Arnaud K. A., 1996, in ASP Conf. Ser. 101: Astronomical Data Analysis Software and Systems V XSPEC: The First Ten Years. p. 17 Beckmann V., Do Cao O., 2010, in Eighth Integral Workshop. The Restless Gamma-ray Universe (INTEGRAL 2010) The elusive radio loud Seyfert 2 galaxy NGC 2110 Bianchi S., Bonilla N. F., Guainazzi M., Matt G., Ponti G., 2009, A&A, 501, 915 Bianchi S., Guainazzi M., Matt G., Fonseca Bonilla N., Ponti G., 2009, A&A, 495, 421 Bianchi S., La Franca F., Matt G., Guainazzi M., Jimenez Bailón E., Longinotti A. L., Nicastro F., Pentericci L., 2008, MNRAS, 389, L52 Bianchi S., Matt G., Balestra I., Guainazzi M., Perola G. C., 2004, A&A, 422, 65 Bianchi S., Matt G., Balestra I., Perola G. C., 2003, A&A, 407, L21 Brenneman L. W., Madejski G., Fuerst F., Matt G., Elvis M., Harrison F. A., Ballantyne D. R., Boggs S. E., Christensen F. E., Craig W. W., Fabian A. C., Grefenstette B. W., Hailey C. J., Madsen K. K., Marinucci A., 2014, ApJ, 781, 83 Brown M. J. I., Jannuzi B. T., Floyd D. J. E., Mould J. R., 2011, ApJ, 731, L41 Dadina M., 2008, A&A, 485, 417 Evans D. A., Lee J. C., Kamenetska M., Gallagher S. C., Kraft R. P., Hardcastle M. J., Weaver K. A., 2006, ApJ, 653, 1121 Evans D. A., Lee J. C., Turner T. J., Weaver K. A., Marshall H. L., 2007, ApJ, 671, 1345 Gabriel C., Denby M., Fyfe D. J., Hoar J., Ibarra A., Ojero E., Osborne J., Saxton R. D., Lammers U., Vacanti G., 2004, in F. Ochsenbein, M. G. Allen, & D. Egret ed., Astronomical Data Analysis Software and Systems (ADASS) XIII Vol. 314 of Astronomical Society of the Pacific Conference Series, The XMM-Newton SAS - Distributed Development and Maintenance of a Large Science Analysis System: A Critical Analysis. pp 759–+ Gandhi P., Horst H., Smette A., Hönig S., Comastri A., Gilli R., Vignali C., Duschl W., 2009, A&A, 502, 457 George I. M., Fabian A. C., 1991, MNRAS, 249, 352 Griffith M. R., Wright A. E., Burke B. F., Ekers R. D., 1995, ApJS, 97, 347 Hayashi I., Koyama K., Awaki H., Yamauchi S. U. S., 1996, PASJ, 48, 219 Hönig S. F., Kishimoto M., Gandhi P., Smette A., Asmus D., Duschl W., Polletta M., Weigelt G., 2010, A&A, 515, A23 Hönig S. F., Kishimoto M., Tristram K. R. W., Prieto M. A., Gandhi P., Asmus D., Antonucci R., Burtscher L., Duschl W. J., Weigelt G., 2013, ApJ, 771, 87. 9. Jansen F., Lumb D., Altieri B., Clavel J., Ehle M., Erd C., Gabriel C., Guainazzi M., Gondoin P., Much R., Munoz R., Santos M., Schartel N., Texier D., Vacanti G., 2001, A&A, 365, L1 Kalberla P. M. W., Burton W. B., Hartmann D., Arnal E. M., Bajaja E., Morras R., Pöppel W. G. L., 2005, A&A, 440, 775 Lobban A. P., Reeves J. N., Porquet D., Braito V., Markowitz A., Miller L., Turner T. J., 2010, MNRAS, 408, 551 Magdziarz P., Zdziarski A. A., 1995, MNRAS, 273, 837 Malaguti G., Bassani L., Cappi M., Comastri A., Di Cocco G., Fabian A. C., Palumbo G. G. C., Maccacaro T., Maiolino R., Blanco P., Dadina M., dal Fiume D., Frontera F., Trifoglio M., 1999, A&A, 342, L41 Marconi A., Risaliti G., Gilli R., Hunt L. K., Maiolino R., Salvati M., 2004, MNRAS, 351, 169 Marinucci A., Matt G., Kara E., Miniutti G., Elvis M., Arevalo P., Ballantyne D. R., Baloković M., Bauer F., Brenneman L., Boggs S. E., Cappi M., Christensen F. E., Craig W. W., Fabian A. C., Fuerst F., Hailey C. J., 2014, MNRAS, 440, 2347 Marinucci A., Risaliti G., Wang J., Nardini E., Elvis M., Fabbiano G., Bianchi S., Matt G., 2012, MNRAS, 423, L6 Mason R. E., Levenson N. A., Shi Y., Packham C., Gorjian V., Cleary K., Rhee J., Werner M., 2009, ApJ, 693, L136 Matt G., Guainazzi M., Maiolino R., 2003, MNRAS, 342, 422 Matt G., Marinucci A., Guainazzi M., Brenneman L. W., Elvis M., Lohfink A., Arèvalo P., Boggs S. E., Cappi M., Christensen F. E., Craig W. W., Fabian A. C., 2014, MNRAS, 439, 3016 Matt G., Perola G. C., Piro L., 1991, A&A, 247, 25 Merloni A., Heinz S., di Matteo T., 2003, MNRAS, 345, 1057 Moran E. C., Barth A. J., Eracleous M., Kay L. E., 2007, ApJ, 668, L31 Murphy K. D., Yaqoob T., 2009, MNRAS, 397, 1549 Mushotzky R. F., 1982, ApJ, 256, 92 Nandra K., O’Neill P. M., George I. M., Reeves J. N., 2007, MNRAS, 382, 194 Nandra K., Pounds K. A., 1994, MNRAS, 268, 405 Panessa F., Barcons X., Bassani L., Cappi M., Carrera F. J., Ho L. C., Pellegrini S., 2007, A&A, 467, 519 Piconcelli E., Jimenez-Bailón E., Guainazzi M., Schartel N., Rodrı́guez-Pascual P. M., Santos-Lleó M., 2004, MNRAS, 351, 161 Reeves J. N., Fabian A. C., Kataoka J., Kunieda H., Markowitz A., Miniutti G., Okajima T., Serlemitsos P., Takahashi T., Terashima Y., Yaqoob T., 2006, Astronomische Nachrichten, 327, 1079 Ricci C., Walter R., Courvoisier T. J.-L., Paltani S., 2011, A&A, 532, A102 Rivers E., Markowitz A., Rothschild R., Bamba A., Fukazawa Y., Okajima T., Reeves J., Terashima Y., Ueda Y., 2014, ArXiv e-prints Rybicki G. B., Lightman A. P., 1979, Radiative processes in astrophysics Shi Y., Rieke G. H., Hines D. C., Gorjian V., Werner M. W., Cleary K., Low F. J., Smith P. S., Bouwman J., 2006, ApJ, 653, 127 Strüder L., Briel U., Dennerl K., Hartmann R., Kendziorra.
(10) 10. Andrea Marinucci, et al.. E., Meidinger N., Pfeffermann E., Reppin C., Aschenbach B., Bornemann W., Bräuninger H., Burkert W., Elender M., 2001, A&A, 365, L18 Sturm E., Schweitzer M., Lutz D., Contursi A., Genzel R., Lehnert M. D., Tacconi L. J., Veilleux S., Rupke D. S., Kim D.-C., Sternberg A., Maoz D., Lord S., Mazzarella J., Sanders D. B., 2005, ApJ, 629, L21 Titarchuk L., 1994, ApJ, 434, 570 Tran H. D., 2010, ApJ, 711, 1174 Turner M. J. L., Abbey A., Arnaud M., Balasini M., Barbera M., Belsole E., Bennie P. J., Bernard J. P., Bignami G. F., Boer M., Briel U., Butler I., Cara C., Chabaud C., Cole R., Collura A., Conte M., Cros A., Denby 2001, A&A, 365, L27 Verner D. A., Ferland G. J., Korista K. T., Yakovlev D. G., 1996, ApJ, 465, 487 Wilms J., Allen A., McCray R., 2000, ApJ, 542, 914 Yaqoob T., 2012, MNRAS, 423, 3360.
(11) Equiva 10 1 Observed Flux.
(12) Fe. 10. 1 Observed Flux.
(13)
Figure


+2
Documento similar
Disentangling the metallicity and star formation history of H II galaxies through tailor-made models
10, we show the comparison between the relative ionic abundances, derived using the corresponding measured electron temperatures and the observed emission-line intensities, and the
The spatially ordered heterojuntion between TiO 2 and -Fe 2 O 3 and a potential co-catalytic incorporation of Fe 3+ (from the support MAGSNC) into the titania structure
Each entry is a pair of values: the ratio of the line flux in the central 3 × 3 spaxels over the line flux in the central spaxel, and in parentheses the ratio of the average
Regarding the correlation between loans and GDP, has been analyzed both financial flows and stocks, first by analyzing flows, there are also obtained data in conjunction
It is a float adjusted market capitalization weighted index that shows the perfomance of common stocks listed on the NYSE market.. It is adjusted to eliminate the effects
In the edition where the SPOC materials were available, we have observed a correlation between the students’ final marks and their percentage rate of
The Spearman coefficients of correlation between the anthropometric, lipidic, metabolic, blood pressure and cardiorespiratory fitness variables and the frequency and intensity
There is a tight correlation (lower black line) between [O i] line emission and 63 μm continuum flux for non-outflow sources (sources with less than 3σ detection in line or
