Effects of organic matter in arsenic removal during neutralization of acid mine drainage
94
0
0
Texto completo
(2) PONTIFICIA UNIVERSIDAD CATOLICA DE CHILE ESCUELA DE INGENIERIA. EFFECTS OF ORGANIC MATTER IN ARSENIC REMOVAL DURING NEUTRALIZATION OF ACID MINE DRAINAGE. GUILLERMO J. ARCE MARÍN. Members of the Committee: PABLO PASTÉN GONZÁLEZ CRISTIÁN ESCAURIAZA MESA PAULA GUERRA PINTO RICARDO RAINERI BERNAIN. Thesis submitted to the Office of Research and Graduate Studies in partial fulfillment of the requirements for the Degree of Master of Science in Engineering Santiago de Chile, January, 2017.
(3) To my parents, my siblings and my friends, for their constant support throughout the development of this thesis. ii.
(4) ACKNOWLEDGEMENTS This research was supported by funding from the National Commission for Scientific and Technological Research (CONICYT) through Fondecyt projects 1130936/2013 and 1161337/2016, and FONDAP 15110020. I would like to thank the Environmental Geochemistry research group, especially Pablo Pastén, my advisor, Paula Guerra, member of my thesis committee, Mauricio Montecinos, fellow researcher, and Marina Coquery, for all their support, counseling and help in the development of this thesis. I would also like to thank the personnel from the Water Quality Laboratory, Fernanda Carrasco and Mauricio Medel, for all their help with lab work. I am also grateful to the Sociedad Canal del Maipo for their funding through the Arturo Cousiño Lyon scholarship.. iii.
(5) INDEX Page DEDICATION ............................................................................................................. ii ACKNOWLEDGEMENTS ........................................................................................ iii LIST OF TABLES ..................................................................................................... vii LIST OF FIGURES .................................................................................................. viii ABSTRACT ................................................................................................................. x RESUMEN.................................................................................................................. xi 1.. INTRODUCTION .............................................................................................. 1 1.1. Context and motivation .............................................................................. 1 1.2. Acid Mine Drainage enhances metal mobility and toxicity ....................... 3 1.2.1. Generation of Acid Mine Drainage ................................................. 3 1.2.2. Consequences of Acid Mine Drainage ............................................ 4 1.3. Behavior of metals in Acid Mine Drainage affected systems .................... 5 1.3.1. Iron and aluminum speciation ......................................................... 5 1.3.2. Arsenic speciation and reactivity ..................................................... 6 1.4. Neutralization of Acid Mine Drainage as treatment scheme and natural attenuation process ..................................................................................... 8 1.5. Organic matter interactions in systems containing Fe, Al and As ........... 11 1.6. Hypotheses ............................................................................................... 13 1.7. Objectives ................................................................................................. 13 1.7.1. Specific objectives ......................................................................... 14. 2.. EXPERIMENTAL DESIGN ............................................................................ 15 2.1. Field model............................................................................................... 15 2.1.1. Field measurement of physical parameters and water sampling ... 18 2.1.2. Quantification of loss of organic carbon at the confluence ........... 19 2.2. Laboratory model ..................................................................................... 20 2.2.1. Preliminary experiments ................................................................ 21.
(6) 2.2.2. 2.2.3. 2.2.4. 2.2.5. 3.. Extraction and characterization of organic matter stocks .............. 22 Preparation of water samples ......................................................... 22 Azufre – Caracarani mixture experiments ..................................... 23 Analytical methods ........................................................................ 24. RESULTS AND DISCUSSION ....................................................................... 26 3.1. Field model............................................................................................... 26 3.1.1. Characterization of the Azufre River and the Caracarani River .... 26 3.1.2. Loss of OM due to the association of OM with suspended solids. 27 3.2. Characterization of organic matter stock solutions .................................. 28 3.2.1. UV-Vis Spectroscopy of APDOM and PPHA .............................. 28 3.2.2. Fourier Transform Infrared Spectroscopy ..................................... 29 3.3. Laboratory model ..................................................................................... 31 3.3.1. Dissolved/particulate partitioning of metals: Fe, Al and As.......... 31 3.3.2. Dissolved/particulate partitioning of organic carbon .................... 34 3.3.3. Changes of PSDs formed during acid drainage neutralization ...... 35. 4.. CONCLUSIONS AND PERSPECTIVES ....................................................... 40 4.1. Conclusions .............................................................................................. 40 4.2. Limitations ............................................................................................... 42 4.3. Future work and connections with public policy ..................................... 43. REFERENCES........................................................................................................... 47 APPENDICES ........................................................................................................... 55 APPENDIX A: TOTAL ORGANIC CARBON ANALYZER VALIDATION........ 56 A.1. Method bias............................................................................................... 56 A.2. Limit of quantification .............................................................................. 57 A.3. Measurement uncertainty.......................................................................... 58 A.5. References ................................................................................................. 58 A.6. Data for validation .................................................................................... 59 APPENDIX B: SCRIPT FOR PSD DECOMPOSITION .......................................... 63.
(7) APPENDIX C: ESTIMATION OF LOCAL MIXING RATIO FROM MULTIPLE TRACERS ........................................................................................................ 70 APPENDIX D: TOTAL SUSPENDED SOLIDS, ORGANIC CARBON AND METALS IN THE AZUFRE – CARACARANI RIVERS CONFLUENCE .................... 71 D.1. Concentration of organic carbon............................................................... 71 D.2. Concentration of metals: Fe and Al .......................................................... 71 D.3. Total Suspended Solids............................................................................. 72 APPENDIX E: ADDITIONAL EXPERIMENT – SIMPLIFIED FERRIC CHLORIDE – SODIUM CARBONATE MIXTURES ............................................................ 73 E.1. Experimental design .................................................................................. 73 E.2. Results ....................................................................................................... 73 APPENDIX F: ADDITIONAL EXPERIMENT - AGGREGATION OF ORGANIC MATTER AT LOW PH ................................................................................... 75 F.1. Objectives .................................................................................................. 75 F.2. Experimental design .................................................................................. 75 F.3. Results ....................................................................................................... 75 F.4. References ................................................................................................. 76 APPENDIX G: HYDROCHEMICAL PARAMETERS: pH and ELECTRIC CONDUCTIVITY ............................................................................................ 77 G.1. pH.............................................................................................................. 77 G.2. Electric conductivity ................................................................................. 79 APPENDIX H. PARTICULATE/DISSOLVED PARTITIONING OF METALS AT DIFFERENT TIMEs in mixing experiments ................................................... 81 H.1. Experiments at pH 4.5 .............................................................................. 81 H.2. Experiments at pH 3 ................................................................................. 82.
(8) LIST OF TABLES Page Table 2-1. Representative water quality parameters of the Azufre and Caracarani rivers (sampling period: 2010-2012) (Guerra, Simonson, et al., 2016) ..................................... 17 Table 3-1. Estimated total organic carbon (TOC) loss for the cross-sections downstream the confluence .................................................................................................................. 28 Table A-1. Basic statistics for method bias analysis, for each concentration .................. 56 Table A-2. t-student test for method bias, for each concentration level .......................... 57 Table A-3. Data for limit of quantification analysis ........................................................ 57 Table A-4. Measurement uncertainty, for each concentration level ................................ 58 Table A-5. Concentration data for method bias and uncertainty analysis ....................... 59 Table A-6. Data for limit of quantification analysis ........................................................ 61 Table C-1. Concentration of tracers in end-member rivers (Azufre and Caracarani surface waters upstream the confluence) ......................................................................... 70 Table C-2. Concentration of tracers in Caracarani river at 3 points downstream the confluence and estimation of mixing ratio for each point ............................................... 70 Table D-1. Total and dissolved organic carbon in the Azufre River - Caracarani River confluence (May 2015 campaign). ................................................................................... 71 Table D-2. Total and dissolved concentration of Fe and Al in the Azufre River Caracarani River confluence (May 2015 campaign). ...................................................... 71 Table D-3. Total Suspended Solids in the Azufre River – Caracarani River confluence (May 2015 campaign). ..................................................................................................... 72. vii.
(9) LIST OF FIGURES Page Figure 1-1. Concentrations of monomeric hydrolysis products of Fe(III) in equilibrium with amorphous hydroxides at zero ionic strength and 25 °C (Duan & Gregory, 2003). .. 5 Figure 1-2. Concentrations of monomeric hydrolysis products of Al(III) in equilibrium with amorphous hydroxides at zero ionic strength and 25 °C (Duan & Gregory, 2003)... 6 Figure 1-3. Eh-pH diagram for aqueous As species at 25 °C and 1 bar total pressure (Smedley & Kinniburgh, 2002).......................................................................................... 7 Figure 1-4. Alternatives for AMD remediation (Johnson & Hallberg, 2005). .................. 8 Figure 1-5. Profiles of (a) pH and (b) electric conductivity downstream the Caracarani River – Azufre River confluence (May 2015 campaign). ................................................ 10 Figure 1-6. Profiles of particulate Fe(OH)3 and Al(OH)3 downstream the confluence determined by geochemical modelling (Guerra, 2016).................................................... 10 Figure 1-7. Interactions in the Fe-As-OM system. (Sharma, Ofner, & Kappler, 2010). . 12 Figure 2-1. Location of the Azufre-Caracarani rivers confluence in northern Chile (Adapted from Guerra, Simonson, et al. (2016)) ............................................................. 16 Figure 2-2. Location of the sampling/measurements points at the Azufre – Caracarani confluence during the May 2015 field campaign. ............................................................ 18 Figure 2-3. Schematic representation of the mixture experiments performed. ................ 21 Figure 2-4. Experimental setup for the batch experiments. ............................................. 23 Figure 2-5. Representation of a sample PSD as a bubble chart. ...................................... 25 Figure 3-1. Particle Size Distribution measurement in the Azufre River. ....................... 26 Figure 3-2. Particle Size Distribution measurement of the Caracarani River. ................. 27 Figure 3-3. Normalized UV-Vis spectra of both OM stock solutions. ............................ 29 Figure 3-4. FTIR spectra of both OM stock solutions. .................................................... 30 Figure 3-5. Concentrations of (a) Fe and (b) Al in the dissolved and particulate phases at 10 minutes, in the experiments at pH 4.5. ........................................................................ 31 Figure 3-6. Concentrations of (a) iron, (b) aluminum and (c) arsenic in the dissolved and particulate phases at 10 minutes, in the experiments at pH 3. ......................................... 33 Figure 3-7. Concentration of particulate and dissolved arsenic throughout the experiments at pH 3 (measurements at 10 min, 1h and 4 h). ........................................... 34 Figure 3-8. Concentration of organic carbon in the dissolved and particulate fractions at 10 min for the experiment at (a) pH 4.5 and (b) at pH 3.................................................. 34 Figure 3-9. Total volumetric concentration of particles throughout the experiments at (a) pH 4.5 and (b) pH 3.......................................................................................................... 36 Figure 3-10. Time series of PSDs during the experiments for (a) 0.5 mg C L-1, (b) 2 mg C L-1 and (c) 10 mg C L-1 additions of APDOM, at pH 4.5. ........................................... 38 Figure 3-11. Time series of PSDs during the experiments for (a) 0.5 mg C L-1, (b) 2 mg C L-1 and (c) 10 mg C L-1 additions of PPHA, at pH 4.5. ................................................ 39 Figure 4-1. Interactions of OM in the Fe-As system. ...................................................... 41. viii.
(10) Figure 4-2. Schematic representation of the typical setting of a Chilean city. The mining related elements, such as an open-pit mine and mine tailings (enclosed within the red border), are usually located in the upper part of the watersheds (used with permission from CEDEUS). ............................................................................................................... 44 Figure E-1. Iron partitioning in the simplified experiments after (a) 10 min, (b) 1 h and (c) 4 h. .............................................................................................................................. 74 Figure F-1. Dissolved/particulate partition of organic carbon at 10 minutes for all experiments. ..................................................................................................................... 75 Figure F-2. Time series of particulate/dissolved partition of organic carbon in the Azufre-OM solution. ........................................................................................................ 76 Figure G-1. Time series of pH measurements for experiments at pH 4.5 ....................... 77 Figure G-2. Time series of pH measurements for experiments at pH 3 .......................... 78 Figure G-3. Time series of electric conductivity measurements for experiments at pH 4.5 .......................................................................................................................................... 79 Figure G-4. Time series of electric conductivity measurements for experiments at pH 3 .......................................................................................................................................... 80 Figure H-1. Particulate/dissolved partition of (a) iron after 1 hour, (b) iron after 4 hours, (c) aluminum after 1 hour and (d) aluminum after 4 hours, for the experiments at pH 4.5. .......................................................................................................................................... 81 Figure H-2. Particulate/dissolved partition of (a) iron after 1 hour, (b) iron after 4 hours, (c) aluminum after 1 hour, (d) aluminum after 4 hours, (e) arsenic after 1 hour and (f) arsenic after 4 hours, for the experiments at pH 3. .......................................................... 82. ix.
(11) ABSTRACT Acid mine drainage (AMD) is an important environmental concern as it restricts the use of receiving waters due to their toxic constituents. It is also a relevant sustainability concern for water scarce Andean cities in Northern and Central Chile, impairing drinking water sources or increasing energy consumption and waste production during treatment. The formation of reactive solid phases such as Fe and Al oxyhydroxides at river confluences where neutralization of AMD occurs is a critical natural attenuation process for heavy metals and metalloids. Although it is known that organic matter (OM) affects the aggregation properties of Fe and Al oxyhydroxides and the sorption of As onto their surfaces, the role of OM in the fate of As during the neutralization of AMD at river confluences has not been studied. Field and experimental work was conducted to understand the role of OM during neutralization of AMD, using the Azufre River (pH 2) – Caracarani River (pH 8.6) confluence (northern Chile) as model system. Field measurements revealed a 10-15% loss of OM downstream the confluence, which was attributed to associations with Fe and Al oxyhydroxides that settle in the river bed. When the AMD water was mixed with synthetic Caracarani waters under varying conditions of pH, concentration and type of OM in the laboratory, it was observed that OM promoted the aggregation of Fe oxyhydroxides without decreasing As sorption at slightly acidic conditions (pH ~4.5), thus enhancing the removal of As. Under acidic conditions (pH ~3), particulate metals were observed for high OM concentrations, suggesting that aggregation of OM – metal complexes could become the main removal mechanism. This work contributes to a better understanding of the role of OM in AMD affected basins, showing that the presence of OM during processes of neutralization of AMD can enhance the removal of metals. This knowledge is critical for designing engineered systems to control the pollution from natural and mining sources.. Keywords: acid mine drainage, arsenic, particle size distribution, iron, aluminum, organic carbon x.
(12) RESUMEN El drenaje ácido de minas (AMD) es un problema ambiental importante ya que restringe el uso de aguas recibiendo este drenaje debido a sus componentes tóxicos. También es un problema de sustentabilidad importante para las ciudades andinas del norte y centro de Chile, afectando las fuentes de agua potable o incrementando el consumo de energía y la producción de residuos durante el tratamiento. La formación de fases reactivas sólidas como oxihidróxidos de Fe y Al en confluencias de ríos en los que ocurre neutralización de AMD es un proceso de atenuación natural de metales y metaloides. A pesar de que se sabe que la materia orgánica (MO) puede afectar la agregación de oxihidróxidos de Fe y Al y la sorción de arsénico sobre sus superficies, el rol de la MO en el destino del arsénico durante la neutralización de AMD en confluencias de ríos no se ha estudiado. Se utilizó trabajo de terreno y experimental para entender el rol de la MO durante la neutralización de AMD, usando la confluencia de los ríos Azufre y Caracarani como modelo de estudio. Las mediciones de terreno revelaron una pérdida de MO de 10-15% aguas abajo de la confluencia, lo que fue atribuido a la asociación con oxihidróxidos de Fe y Al que sedimentan en el lecho. Cuando se mezcló agua afectada por AMD con aguas del río Caracarani bajo distintas condiciones de pH, y concentración y tipo de materia orgánica en el laboratorio, se observó que la MO promovió la agregación de óxidos de hierro sin afectar la sorción de arsénico en condiciones levemente ácidas (pH ~4.5), mejorando la remoción de arsénico. En condiciones ácidas (pH ~3), se observó la presencia de metales particulados a altas concentraciones de MO, sugiriendo que la agregación de complejos MO – metal podría convertirse en el mecanismo de remoción principal. Este trabajo contribuye a un mejor entendimiento del rol de la MO en cuencas afectadas por AMD, mostrando que la presencia de MO durante procesos de neutralización de AMD puede mejorar la remoción de metales. Este conocimiento es crítico para diseñar soluciones de ingeniería para controlar la contaminación de fuentes naturales y mineras. Palabras Claves: drenaje ácido de minas, arsénico, distribución de tamaño de partículas, hierro, aluminio, carbono orgánico xi.
(13) 1. 1.. INTRODUCTION. 1.1. Context and motivation Mine wastes are an important environmental concern in zones with mining activity, not only because of the large volume of wastes generated – at least a metric ton of waste is generated for every metric ton of metal ore extracted (Hudson-Edwards, Jamieson, & Lottermoser, 2011) – but also because they contain toxic substances at concentrations that may pose a serious threat to human and ecosystem health (Akcil & Koldas, 2006). Mine wastes can contaminate air and soil by particle generation and dispersal (Hudson-Edwards et al., 2011), while oxidation of these wastes in aqueous environments produces an acidic leachate with high concentrations of metals – known as Acid Mine Drainage (AMD) – that can contaminate groundwater and surface water resources (Paikaray, 2015). Control of AMD is a relevant sustainability challenge as AMD can threaten sustainable water supply for cities, agriculture and industry, especially in zones where water resources are scarce, like northern Chile (Aitken, Rivera, Godoy-Faúndez, & Holzapfel, 2016; Tempelhoff, Ginster, Motloung, Gouws, & Strauss, 2014). The most widespread AMD treatment scheme is neutralization, in which addition of an alkaline reagent promotes an increase in pH conditions and the precipitation and sorption of dissolved metals, which can later be removed through the use of settling basins (Akcil & Koldas, 2006; Johnson & Hallberg, 2005). Mixing of AMD with alkaline rivers can play an important role as a passive natural attenuation process, as has been observed in confluences such as the Reigous Creek – Amous River confluence (Casiot et al., 2005), the Animas River – Cement Creek confluence (Schemel, Kimball, Runkel, & Cox, 2007) and the Azufre River – Caracarani River confluence (Abarca et al., 2017; Guerra, Simonson, et al., 2016; Guerra, Gonzalez, Escauriaza, Pizarro, & Pasten, 2016). Neutralization of AMD in confluences is a complex process controlled by several factors which ultimately determine metal removal. Hydrodynamic conditions determine the way mixing occurs in confluences, resulting in spatial heterogeneity that creates local environments in which precipitation of metals can occur, even in cases where fully mixed.
(14) 2. conditions do not thermodynamically favor precipitation of these solids (Guerra, Gonzalez, et al., 2016). Hydrology controls the mixing ratio of rivers, which determines chemical conditions downstream the confluence. Guerra, Simonson et al. (2016) showed that daily cycles in flow rates in the Azufre and Caracarani rivers created specific timespans in which removal of arsenic is promoted. The presence of different chemical species can either reduce or enhance the removal of trace metals (Holm, 2002; Wang et al., 2014), so the chemistry of both end-members can also affect the fate of metals in confluences. Manganese, iron, aluminum and clay particles can play an important role in the removal of arsenic through sorption reactions (Cheng, Hu, Luo, Xu, & Zhao, 2009). Organic matter (OM), which is ubiquitous in nature and can reach concentrations up to hundreds of mg C L-1 in groundwater and surface water (Sharma, Rolle, Kocar, Fendorf, & Kappler, 2011), is a key chemical species that has been shown to interact with metals like iron, aluminum and arsenic through complexation and precipitation reactions (Sundman, Karlsson, Sjöberg, & Persson, 2014). This work studies the role of OM in arsenic removal during neutralization of AMD, considering that OM can affect the aggregation properties of iron and aluminum oxyhydroxides (HFO and HAO, respectively) particles (Wang et al., 2014) and the sorption of arsenic onto these particles (Grafe, Eick, & Grossl, 2001; Grafe, Eick, Grossl, & Saunders, 2002). Although research on the effects of OM in systems containing Fe, Al and As has been conducted (Amos et al., 2015; Bauer & Blodau, 2009; Mikutta, Lorenz, Guggenberger, Haumaier, & Freund, 2014), little research has been done on the implications of the presence of OM during AMD neutralization. This knowledge allows for a better understanding of the processes occurring during neutralization of acid mine drainage and it will be useful to enhance removal of arsenic in natural attenuation processes or treatment schemes..
(15) 3. 1.2. Acid Mine Drainage enhances metal mobility and toxicity Acid Rock Drainage (ARD) refers to acidic flows with high concentrations of sulfate and metals like iron and aluminum, which are produced due to the oxidation of sulfide minerals – mainly iron sulfides such as pyrite and pyrrhotite – by exposure to oxygen and water (Amos et al., 2015). Mining activities can increase the exposure of sulfide minerals to oxidizing conditions, accelerating the generation of ARD (Akcil & Koldas, 2006), in which case it is referred to as Acid Mine Drainage (AMD). 1.2.1. Generation of Acid Mine Drainage The main mechanism of AMD generation is the oxidation of sulfide minerals. Pyrite, as the most common sulfide mineral in Earth’s crust, is often used to illustrate AMD generation reactions (Eq. 1.1) (Akcil & Koldas, 2006): 7. + FeS2(s) + 2 O2 + H2 O → Fe2+ + 2 SO2− 4 +2H. (1.1). Several other sulfide minerals can oxidize by exposure to oxygen and water, such as pyrrhotite (Eq. 1.2), sphalerite (Eq. 1.3) and arsenopyrite (Eq. 1.4) (Lindsay et al., 2015): 1. + Fe(1−x) S(s) + (2 − 2 x) O2 + x H2 O → (1 − x) Fe2+ + SO2− 4 + 2x H. (1.2). (Zn(1−x) Fex )S(s) + 2 O2 → (1 − x) Zn2+ + x Fe2+ + SO2− 4. (1.3). 4FeAsS(s) + 11 O2 + 6 H2 O → 4 Fe2+ + 4 H3 AsO3 + 4 SO2− 4. (1.4). The released ferrous iron can be oxidized to ferric iron in presence of oxygen (Eq. 1.5) (Amos et al., 2015), which can further oxidize sulfide minerals (Akcil & Koldas, 2006; Lindsay et al., 2015) or precipitate as HFO (Eq. 1.6) (Amos et al., 2015): 1. 1. Fe2+ + 4 O2 + H + → Fe3+ + 2 H2. (1.5). Fe3+ + +3 H2 O → Fe(OH)3(s) + 3 H +. (1.6). The net result of this sequence of reactions is the release of iron, sulfate and protons to the stream, as illustrated by the summarized reaction for pyrite (Eq. 1.7) (Lindsay et al., 2015): FeS2(s) +. 15 4. 7. + O2 + 2 H2 O → Fe(OH)3(s) + 2 SO2− 4 +4H. (1.7).
(16) 4. 1.2.2. Consequences of Acid Mine Drainage The dissolution of minerals is often associated to the release of trace metals to the water, either because they are a mineral-forming element (like arsenic in arsenopyrite), found as substitutions or impurities (Amos et al., 2015; Cheng et al., 2009; Savage, Tingle, O’Day, Waychunas, & Bird, 2000), incorporated in the structure as nanoparticles (Deditius et al., 2011), or sorbed on the mineral surface, like As sorbed to ferrihydrite. Furthermore, acidic conditions promote the dissolution of acid-soluble minerals, leading to additional release of metals to solution (Lindsay et al., 2015). For these reasons, AMD-affected waters often contain significant levels of trace metals. The presence of metals in riverine systems poses a challenge for sustainability, as they are associated with negative effects in ecosystems and human health. Decreases in abundance and diversity, and shifts sin community structure have been reported in literature in presence of Pb, Zn Cu, Fe and Cd (Byrne, Wood, & Reid, 2012; Gerhardt, 1993). A large number of studies have linked exposure to metals with acute and chronic effects in human health, including organ damage (e.g. kidney damage, lung damage), psychological symptoms (e.g. changes in personality, diminished intellectual capacity) and even death (Jarup, 2003). Arsenic, in particular, is a highly toxic element, associated with detrimental effects on various organ systems of human body (e.g. nervous, cardiovascular, immune and endocrine) (Mohammed Abdul, Jayasinghe, Chandana, Jayasumana, & De Silva, 2015) and is considered a carcinogenic agent (IARC, 1980). However, for these negative effects to be produced, it is required that (1) there is pathway through which metals are transported from the contamination source to the receptor and (2) metals are in a bioavailable form (i.e. they can be incorporated by the organism and can react with its metabolic system) (Adamo & Zampella, 2009). The mobility and bioavailability of a metal are dependent on its speciation (the different chemical forms in which an element occurs in a system). For example, As(III) species are more mobile and more toxic than As(V) species (Lièvremont, Bertin, & Lett, 2009). For this reason, understanding the behavior of metals from AMD under different chemical conditions is fundamental to understand their impacts and strategies for their control..
(17) 5. 1.3. Behavior of metals in Acid Mine Drainage affected systems The main variable controlling the speciation of metals is pH, often considered the master variable. Several other variables like redox state, ionic strength and presence and concentration of other species (e.g. ligands) are also important (Warren & Haack, 2001). Due to the characteristics of the site of interest of this investigation, shared with many other sites affected by AMD, the focus of this section will be the reactivity of iron, aluminum and arsenic. 1.3.1. Iron and aluminum speciation In aqueous environments, iron predominantly occurs in oxidation states +2 and +3, forming a variety of oxides and hydroxides differing in their chemistry and crystal structure (Schwertmann & Cornell, 2000). In aqueous environments, HFO first precipitate as amorphous, poorly crystalline, nano-sized particles (ferrihydrite), which slowly transform to crystalline phases such as hematite or goethite (Schwertmann & Cornell, 2000). The solubility of amorphous hydroxide precipitates is controlled by the formation of Fe complexes, which makes them more soluble in acidic conditions (Figure 1-1).. Figure 1-1. Concentrations of monomeric hydrolysis products of Fe(III) in equilibrium with amorphous hydroxides at zero ionic strength and 25 °C (Duan & Gregory, 2003). Fe is more soluble under acidic conditions. At concentrations found in AMD affected environments, Fe precipitates at pH > 3..
(18) 6. Aluminum is predominantly found in oxidation state +3 in aqueous environments. Similarly to iron, aluminum can form amorphous oxyhydroxides that transform to more crystalline phases after ageing or heating (Duan & Gregory, 2003). The solubility of these amorphous phases is also controlled by the formation of complexes, rendering them less soluble in near circumneutral pH conditions (Figure 1-2).. Figure 1-2. Concentrations of monomeric hydrolysis products of Al(III) in equilibrium with amorphous hydroxides at zero ionic strength and 25 °C (Duan & Gregory, 2003). At typical AMD conditions, Al is present as a dissolved species. It becomes less soluble at a narrow range around pH 6.. Iron and aluminum exist as dissolved species in low pH environments such as AMD affected streams, but they can precipitate as oxyhydroxides if a raise in pH occurs. 1.3.2. Arsenic speciation and reactivity Arsenic is a metalloid that can occur in four oxidation states, (-3, 0, +3 and +5), although in aquatic environments arsenite (As(III)) and arsenate (As(V) are the most relevant forms (Lièvremont et al., 2009). Under oxidizing conditions, arsenate is present as an oxyanion.
(19) 7. above pH 2.2, while under reducing environments, arsenate is present as a fully protonated (neutral) species below pH 9.2 (Figure 1-3).. Figure 1-3. Eh-pH diagram for aqueous As species at 25 °C and 1 bar total pressure (Smedley & Kinniburgh, 2002). Arsenate and arsenite species are negatively charged at pH > 2.2 and pH > 9.2, respectively, which impacts the sorption behavior of these species. For this reason, it is generally considered that arsenate is more readily sorbed than arsenite.. Both arsenite and arsenate species can adsorb onto soils, calcium carbonate, clay and iron and aluminum hydroxides. Generally, it is considered that arsenate has a higher affinity for surfaces and is less mobile than arsenite, but Dixit & Hering (2003) found that sorption of arsenate onto amorphous iron oxides is more favorable in acidic conditions, while arsenite sorption was more favorable on circumneutral to alkaline conditions. Therefore, sorption is a pH dependent process (Cheng et al., 2009). In riverine systems with acidic conditions, such as those affected by AMD, the presence of arsenate would be preferred, and As(III) oxidation processes benefit arsenic attenuation (e.g. microbial oxidation) (Leiva et al., 2014)..
(20) 8. 1.4. Neutralization of Acid Mine Drainage as treatment scheme and natural attenuation process There are several alternatives for AMD remediation, which include biological and abiotic processes and active and passive approaches (Figure 1-4). The most widespread scheme is neutralization through the addition of alkaline reactants (e.g. lime, carbonate salts and hydroxide salts). Due to the increase in pH, Fe precipitates as HFO and Al as HAO (Johnson & Hallberg, 2005), removing trace metals through coprecipitation and adsorption (G. Lee, Bigham, & Faure, 2002; Masue, Loeppert, & Kramer, 2007; Webster, Swedlund, & Webster, 1998). The formed solids are then removed in sedimentation basins (Akcil & Koldas, 2006). This process requires that (1) metals are sorbed onto these solid phases and that (2) the formed flocs are large enough to settle in the sedimentation basin.. Figure 1-4. Alternatives for AMD remediation (Johnson & Hallberg, 2005). Remediation schemes can be abiotic or biological. Abiotic approaches consist on the addition of alkaline reagents, both in active and passive systems. The main biological schemes are wetlands (aerobic or compost) and bioreactors (off-line sulfidogenic and packed bed iron-oxidation).
(21) 9. Neutralization of AMD can also occur passively in natural environments, as it also takes place when an AMD affected stream reaches a more alkaline stream. This mixture results in a higher pH and subsequent formation of HFO/HAO that has played a key role in natural attenuation of metals contamination in basins affected by AMD. For example, Casiot et al. (2005) reported that the concentrations of arsenic provided by the acidic Reigous Creek (pH between 3-4.5, dissolved arsenic up to ~4 mg/L) after its confluence with the alkaline Amous River decreased by one order of magnitude through dilution and formation of Asrich ferrihydrite. Schemel et al. (2007) showed that HFO and HAO formed in the mixing zone after the confluence between the Cement Creek (pH ~ 4) and the Animas River, and that a fraction of metals (Al, Fe, Cu and Zn) shifted from the dissolved to the colloidal phase. The same process was observed in the Azufre River – Caracarani River confluence (Abarca et al., 2017; Guerra, Simonson, et al., 2016; Guerra, Gonzalez, et al., 2016). Neutralization of AMD and attenuation of metals in river confluences is a complex process controlled by several factors. Our research group has approached this complexity by studying these controlling factors. Hydrology controls the mixing ratio of rivers, which determines the chemical conditions downstream the confluence. Intraday variations in stream flow can create specific timespans in which downstream chemistry allows for precipitation of iron and aluminum and removal of arsenic (Guerra, Simonson, et al., 2016). Hydrodynamic conditions determine the way mixing occurs in confluences, and incomplete mixing plays a relevant role because it creates local environments with differing chemical conditions (pH and electric conductivity, Figure 1-5) in which precipitation and attenuation of metals occur (Figure 1-6), whereas these reactions would not occur if complete mixing took place instantaneously (Guerra, Gonzalez, et al., 2016)..
(22) 10. Figure 1-5. Profiles of (a) pH and (b) electric conductivity downstream the Caracarani River – Azufre River confluence (May 2015 campaign). As the water moves towards fully-mixed conditions, profiles show narrower ranges for both parameters, which converge to values of pH ~3.2 and electric conductivity of ~3 mS/cm.. Figure 1-6. Profiles of particulate Fe(OH)3 and Al(OH)3 downstream the confluence determined by geochemical modelling (Guerra, 2016). Metals are present as dissolved species in both end-member rivers. Fe and Al particles are formed at specific locations in the mixing front. As complete mixing is reached, particulate Fe and Al concentrations decrease, as more acidic concentrations promote the dissolution of particles..
(23) 11. The properties of particles are also important in determining the fate of contaminants. Firstly, they need to be of a certain size to settle in the riverbed, rather than travelling downstream, making Particle Size Distribution (PSD) a key element. Secondly, dissolution of these particles when exposed to different chemical environments (such as when they transition from the local environment in which they formed to complete mixing) should be slow compared to advective transport scales, so they can be removed before dissolving and releasing sorbed contaminants. Both aspects were addressed in Abarca et al. (2017). Besides the size distribution of the particles, and the hydrology and hydrodynamics of the confluence, the presence of different chemical species can also affect the removal of trace metals. For example, solutes such as phosphate, silica and carbonate can sorb onto HFOs and compete for sorption sites, reducing arsenic sorption (Holm, 2002; Wang et al., 2014). Similarly, several authors have reported that OM interacts with iron, aluminum and arsenic through precipitation and complexation reactions (Sundman et al., 2014). Due to the ubiquity of OM in nature, understanding the effects of OM in systems containing Fe, Al and As and its implications is fundamental for remediation and attenuation of AMD. 1.5. Organic matter interactions in systems containing Fe, Al and As The main interactions of OM interacts with Fe are the formation of complexes (Sundman et al., 2014) and the sorption of OM onto oxyhydroxide particles (Gu, Schmitt, Chen, Liang, & McCarthy, 1995). Organic matter also forms complexes with As (Warwick, Inam, & Evans, 2005). A summary of the possible interactions in systems containing Fe, As and OM is presented in the conceptual model shown in Figure 1-7. Several studies report changes in the partition of metals and OM due to these interactions (Bauer & Blodau, 2009; Grafe et al., 2001, 2002; Ko, Kim, & Kim, 2004)..
(24) 12. Figure 1-7. Interactions in the Fe-As-OM system. (Sharma, Ofner, & Kappler, 2010). OM can sorb onto Fe minerals and form complexes with dissolved Fe(III). As can form complexes with OM or other Fe-OM complexes, and it can also be sorbed onto Fe(III) particles.. The role of OM in the fate of metals is further complicated by its effects on the physical properties of the particles. Fe and Al oxyhydroxides are amphoteric surfaces that can sorb both cations and anions depending on their surface charge, which depends on pH (Warren & Haack, 2001). These minerals surface are positively charged below pH 8-9 (Duan & Gregory, 2003; Warren & Haack, 2001), but charge neutralization or reversal can occur due to incorporation of OM (Warren & Haack, 2001), either through coprecipitation (Amos et al., 2015) or adsorption (Au, Penisson, Yang, & O’Melia, 1999), as OM is negatively charged in a wide range of pH values due to the diversity of functional groups with different acidity constants it contains (Warren & Haack, 2001). Surface charge also controls the aggregation of particles. Charged colloids are stable due to electrical repulsion, but neutralization of their surface charge destabilizes them and allows them to aggregate (Duan & Gregory, 2003). In coagulation experiments with ferric salts, Wang et al. (2014) reported that the largest particle size occurred when the zeta potential (electric potential at the double layer of charged particles) of particles was near zero, emphasizing the importance of surface charge in aggregation processes. The addition of OM reduced the zeta potential at all pH values, and shifted the isoelectric point (the pH.
(25) 13. at which the surface charge is zero and promotes the largest aggregates) to more acidic values (Wang et al., 2014). In summary, OM affects the aggregation properties of Fe and Al oxyhydroxides and sorption of As onto their surfaces. Despite these precedents, the effects of OM during neutralization of AMD have not been studied thoroughly. In consequence, considering that the removal of metals requires that metals are sorbed and the particles are large enough to settle, the following research questions arise: 1) What is the effect of OM in the PSD of HFO/HAO suspensions formed after neutralization of AMD? 2) What is the effect of OM in the partition of As after neutralization of AMD? 1.6. Hypotheses The hypotheses of this thesis are: 1) Organic matter impacts the removal of heavy metals and arsenic in natural attenuation and water treatment processes, affecting the size distribution the particles formed during neutralization of AMD and the dissolved/particulate partition of metals. 2) Integration of analytical methodologies for chemical (Total Organic Carbon Analysis, Inductively Coupled Plasma Optimal Emission Spectroscopy) and physical (Laser In-Situ Scattering and Transmissometry) characterization allows for the generation of key information for diagnosis and optimization of AMD treatment systems. 1.7. Objectives The main objective of this thesis was to develop a conceptual and experimental model to describe and evaluate the effects of OM in the PSD of oxyhydroxide particles and in the distribution of arsenic in the particulate and dissolved phases during the neutralization of AMD..
(26) 14. 1.7.1. Specific objectives The specific objectives are: 1) Implement and validate a standardized method (Total Organic Carbon measurement) for quantification of OM 2) Implement mathematical tools to analyze multimodal PSDs by decomposition into a sum of distributions 3) Design and implement an experimental setup to evaluate the effects of different types and concentrations of OM in the PSD of HFO/HAO suspensions formed during AMD neutralization and metal partition (dissolved/particulate fractions).
(27) 15. 2.. EXPERIMENTAL DESIGN. The experimental design combined field and laboratory approaches. The laboratory model was the core of this thesis, aiming to assess both hypotheses, as it served to study the impacts of OM in the removal of heavy metals during neutralization of AMD (Hypothesis 1) and to assess the usefulness of the information generated by the implemented methodologies (Hypothesis 2). It required the implementation of new methods and tools to get and analyze data from the experiments (Objectives 1 and 2) and a well thought-out design of the experiments (Objective 3). The field model was used to define the conditions (pH conditions and concentration of metals and OM) under which the experiments were carried out, allowing for the achievement of Objective 3. Additionally, it served to assess the usefulness of the implemented techniques in the diagnosis of affected AMD systems (Hypothesis 2). 2.1. Field model The site of study was the Azufre River – Caracarani River, located in the upper basin of the Lluta River, in the XV Región of Arica and Parinacota, northern Chile (Figure 2-1). The Azufre River is an acidic flow (pH < 2) with high electric conductivity and high concentrations of metals due to contributions of geothermal springs and the oxidation of sulfur tailings from an abandoned sulfur mine at its origin in the Tacora Volcano (Leiva et al., 2014). The Azufre River discharges to the Caracarani River, which is slightly alkaline (pH ~ 8.5) and has lower concentrations of metals (Table 2-1), resulting in the precipitation of HFO and HAO and the partial removal of arsenic from the dissolved phase (Guerra, Simonson, et al., 2016; Guerra, Gonzalez, et al., 2016)..
(28) 16. Figure 2-1. Location of the Azufre-Caracarani rivers confluence in northern Chile (Adapted from Guerra, Simonson, et al. (2016)).
(29) 17. Table 2-1. Representative water quality parameters of the Azufre and Caracarani rivers (sampling period: 2010-2012) (Guerra, Simonson, et al., 2016). (a). Parameter. Unit. pH. -. Alkalinity. mg CaCO3 L-1. SO4-2. mg L-1. Cl-. mg L-1. Na+. mg L-1. K+. mg L-1. Ca+2. mg L-1. Mg+2. mg L-1. Total Fe(e). mg L-1. Dissolved Fe (<0.45 μm). mg L-1. Total Al. mg L-1. Dissolved Al (<0.45 μm). mg L-1. Total As. mg L-1. Total B. mg L-1. Total Zn. mg L-1. Azufre River 1.91(a) (11)(b) (1.0-2.2)(c) 3370.4 (8) (1556-5210) 1319.6 (8) (530-1927) 334.4 (5) (209.3-659) 87.7 (5) (58.9-162) 244.5 (5) (203.9-296.8) 159.2 (5) (100-230) 59.1 (7) (35.3-83.1) 59.1 (6) (32-85.5) 142.9 (5) (97.1-156.9) 142.9 (3) (70.1-156.9) 1.78 (7) 1.05-2.6 18.2 (4) (12.8-19.4) 9.8 (7) (6.3-12.6). Caracarani River 110 (5) 20-232.3 408.5 (8) (217-571) 154.7 (8) (85.8-367) 200 (5) 128.9-218.7 26.72 (5) (14.7-28.8) 96.2 (5) (76.01-115.3) 62.7 (5) (38.2-68) 0.86 (6) (0.3-3.6) 0.82 (5) (0.39-1.3) 0.03 (3) (0.02-0.7) 0.02 (3) (0.01-0.7) 0.09 (6) (0.03-0.13) 2.7 (2) (2.5-2.9) 0.25 (5) (0.09-0.97). Average; (b) Number of measurements; (c) Measurement range (minimum and maximum value measured).
(30) 18. 2.1.1. Field measurement of physical parameters and water sampling A field campaign in May 2015 focused on OM concentrations, measurement of hydrochemical parameters (pH, electric conductivity and turbidity) and sampling for metal and Particle Size Distribution (PSD) in order to fully understand the role of OM on the formation and aggregation of HFO and HAO. In situ measurements were performed in both rivers upstream the confluence and along 3 cross-sections downstream the confluence (50, 100 and 200 m, Figure 2-2), with 7-12 measurements per cross-section. Sample collection was performed at 1 point per cross-section.. Figure 2-2. Location of the sampling/measurements points at the Azufre – Caracarani confluence during the May 2015 field campaign. Single points were sampled/measured at the Azufre and Caracarani rivers upstream the confluence. Several points were sampled/measured at three different cross-sections downstream the confluence (dashed lines).. Samples for total metals, dissolved metals (<0.45 µm using Nylon Syringe Filters, Agela Technologies, DE, USA) and total organic carbon (TOC) were collected on field, while non-filtered samples for dissolved organic carbon were collected and filtered within 24h through 0.45 μm MCE filters (Merck Millipore, Merck, Germany) on a glass filtration apparatus (Kontes Ultraware, Kimble Chase, TN, USA). Samples for dissolved and total metal analyses were stored in 15 and 50 mL Falcon tubes, respectively, and acidified to.
(31) 19. pH 2 with HNO3 (1:1 v/v, EMSURE, Merck, Germany). Samples for organic carbon analyses were stored in 150 mL glass bottles and acidified to pH 2 with H3PO4 (1:1 v/v, EMSURE, Merck, Germany). Additional non-filtered non-acidified samples were stored in 350 mL PE bottles and measured for PSD and Total Suspended Solids. 2.1.2. Quantification of loss of organic carbon at the confluence The quantification of TOC loss was done to determine whether this parameter was conservative or if there was settling of OM downstream from the confluence. The loss of organic carbon was determined by subtracting the concentrations measured at the confluence from predicted concentrations calculated assuming TOC was conservatively transported, as indicated in equation 4.1 (McKnight et al., 1992): TOCloss = CTOC,P − CTOC,meas. (4.1). where, TOCloss: Loss of total organic carbon (mg C L-1) CTOC,P: Predicted concentration of total organic carbon (mg C L-1) CTOC,meas: Measured concentration of total organic carbon (mg C L-1) The predicted concentration was determined as a function of the end-member concentrations and the mixing ratio (R = QAzufre/QCaracarani) (Eq. 4.2.), which was determined as the median value obtained from multiple tracers (Schemel, Cox, Runkel, & Kimball, 2006). The concentration of the tracers at a downstream point was also used for this calculation, as indicated in equation 4.3. CTOC,P = C. CTOC,A R+CTOC,C R+1 −C. R = C Tracer,C −CTracer,D Tracer,D. Tracer,A. where, CTOC,A: Concentration of total organic carbon in the Azufre River (mg C L-1) CTOC,C: Concentration of total organic carbon in the Caracarani River (mg C L-1) CTracer,A: Concentration of the tracer in the Azufre River (mg L-1) CTOC,C: Concentration of the tracer in the Caracarani River (mg L-1) CTOC,D: Concentration of the tracer at the downstream point (mg L-1). (4.2) (4.3).
(32) 20. 2.2. Laboratory model To study the effects of OM on the PSD of oxyhydroxide particles and the partition of metals (Fe, Al, As) during the neutralization of AMD, several mixing experiments using natural Azufre River and synthetic Caracarani River water samples were performed. Two types of OM (IHSS Humic Acid Standard from the Pahokee peatland and a peat sample obtained from our study site) at different additions (0, 0.5, 2 and 10 mg C L-1) and two pH values after neutralization (3 and 4.5) were used throughout the experiments, by varying the composition of the synthetic Caracarani River. The water samples were mixed at a volume ratio (R = VAzufre/VCaracarani) of 0.12, which is the ratio that produces the desired pH value of 4.5 when mixing natural Azufre and Caracarani water samples (Abarca et al., 2017). The mixtures were sampled for total and dissolved organic carbon, total and dissolved metals, PSD, and ions. A schematic representation of this experimental design is presented in Figure 2-3. The decision to consider variable pH conditions and concentrations of OM is supported by the presence of different local environments downstream the confluence due to incomplete mixing. The use of a standard reference material allows for comparison with other studies..
(33) 21. Figure 2-3. Schematic representation of the mixture experiments performed. Synthetic Caracarani waters with different total alkalinity, DOC concentration and organic matter type were prepared, and mixed with natural Azufre waters at a volume ratio (VAzufre/VCaracarani) of 0.12. The mixtures were sampled for metals, organic carbon, PSD and ions.. 2.2.1. Preliminary experiments Preliminary experiments were performed to determine the NaHCO3 dose in synthetic Caracarani water obtain the desired pH values. A stock solution with total alkalinity of 250 mg CaCO3 L-1 was prepared, from which different alkalinity values were obtained via dilution. Mixtures of 12 mL of Azufre with 100 mL of the synthetic neutralizing solution were prepared and the resulting pH was measured..
(34) 22. 2.2.2. Extraction and characterization of organic matter stocks Solutions of DOM were prepared using a model peat sample collected in a wetland in the upper Azufre basin (APDOM) and from the Pahokee Peat Humic Acid standard (PPHA) obtained from the International Humic Substances Society. Organic matter from the APDOM sample was extracted using a method adapted from Mikutta et al. (2014) and Tan (2014), by mixing the sediment with 0.1 M NaOH at a 1:5 (g/mL) ratio. Organic matter from the PPHA standard was extracted by dissolving 500 mg of humic acid standard in 500 mL of 0.1 M NaOH. The suspensions were shaken at 90 rpm for 16 h in an orbital shaker at room temperature and later centrifuged at 3000 x g for 15 min. The supernatant was vacuum-filtered through a 0.22 μm MCE filter (Merck Millipore). DOM solutions were stored at 4°C in darkness as suggested by Bauer & Blodau (2006). Diluted samples and replicates were measured for DOC concentration using a TOC Analyzer (TOC-LCPH, Shimadzu, Japan). Chemical characterization of DOC was done by UV-Vis spectrometry (HR4000, Ocean Optics, US), and Fourier Transform Infrared (FTIR) Spectroscopy (IR Prestige-21, Shimadzu, Japan) using the KBr pellet technique (Tan, 1996). FTIR spectra were scanned in the 4700 – 340 cm-1 range using a resolution of 8 cm-1. 2.2.3. Preparation of water samples Synthetic Caracarani River water was used as a model and prepared by adding 200 mg L1. NaCl, 40 mg L-1 KCl, 520 mg L-1 CaSO4•2H2O, 420 mg L-1 MgSO4•7H2O and 120 mg. L-1 MgCl2•6H2O to deionized water. Alkalinity of 250 and 80 mg CaCO3 L-1 adjusted with NaHCO3 allowed for different pH in the batch experiments (4.5 and 3.0, respectively), while different DOC additions, previously adjusted for pH with 1M HCl, allowed for different TOC concentrations in the experiments (0, 0.5, 2 and 10 mg C L-1). Fourteen different synthetic Caracarani waters were obtained, varying in alkalinity (2 levels, 250 and 80 mg as CaCO3 L-1), OM type (2 types, APDOM and PPHA) and concentration (4 levels, 0.56, 2.24 and 11.20 mg C L-1). All solutions were filtered with a 0.22 μm MCE filter to provide a particle-free baseline, at least in the LISST-100X measurement range..
(35) 23. 2.2.4. Azufre – Caracarani mixture experiments Natural Azufre and synthetic Caracarani were mixed at a volume ratio (VAzufre/VCaracarani) equal to 0.12, which is the ratio that results in pH 4.5 when natural Azufre and Caracarani waters are mixed (Abarca et al., 2017). The pH was adjusted to 3 at the same mixing ratio by reducing the alkalinity of the synthetic Caracarani water. Mixtures were kept in autoclaved glass bottles inside an orbital shaker (SI300-R, Lab Companion, Korea) at 110 rpm and 20 °C for the duration of the experiments. Chemical and physical parameters (pH, electric conductivity and temperature) were measured at the beginning and after 5, 10, 20, 40 min, and 1, 2, and 4 hours. Non-filtered samples for PSD and turbidity were collected at the same times. Filtered samples for DOC (using Merck Millipore 0.7 μm glass-fiber filters) and dissolved metals (0.45 μm MCE filters, Merck Millipore) were collected at 10 min, 1 h and 4 h. Samples for total metals and TOC were collected at the beginning of the experiments and after 4 h. All experiments were performed in duplicate.. Figure 2-4. Experimental setup for the batch experiments..
(36) 24. 2.2.5. Analytical methods a) Hydrochemical parameters Measurements of pH, electric conductivity, dissolved oxygen and temperature were done using a multi-parameter probe (HQ40d Portable meter, HACH, CO, USA). Turbidity was measured using a Total Suspended Solids probe (TSS Portable, HACH, CO, USA) during the field campaign, while a portable turbidity meter (HI98703, Hanna Instruments, RI, USA) was used for the laboratory experiments.. b) Metal measurements For total metal analyses, water samples were digested in a microwave (Mars Microwave System, MarsXpress, CEM, Matthews, USA) according to the EPA method 3015A (EPA, 2007). Digested and dissolved water samples were analyzed for metals through Inductively Coupled Plasma – Optimal Emission Spectroscopy (ICP-OES, Optima 7300V, Perkin Elmer, US). The limits of quantification were 0.01 mg L-1 for Fe and Al, and 0.1 mg L-1 for As. Each batch of samples included ~30% of control samples consisting of standard solutions (Merck, Germany), duplicate samples and spiked samples, for quality control.. c) Organic carbon measurements Total and dissolved organic carbon concentrations (in mg C L-1) were measured with a Total Organic Carbon Analyzer (TOC-LCPH, Shimadzu, Japan) using the non-purgeable organic carbon method (Bauer & Blodau, 2009). An analysis of the performance of this TOC Analyzer is presented in Appendix A. The limit of quantification was 0.2 mg C L-1. Each batch of samples included ~30% of control samples consisting of potassium hydrogen phthalate standards and blank solutions.. d) Particle Size Distributions Particle Size Distributions were measured using Laser In-Situ Scattering and Transmissometry (LISST-100X Type C, Sequoia Scientific Inc., WA, USA). The LISST-.
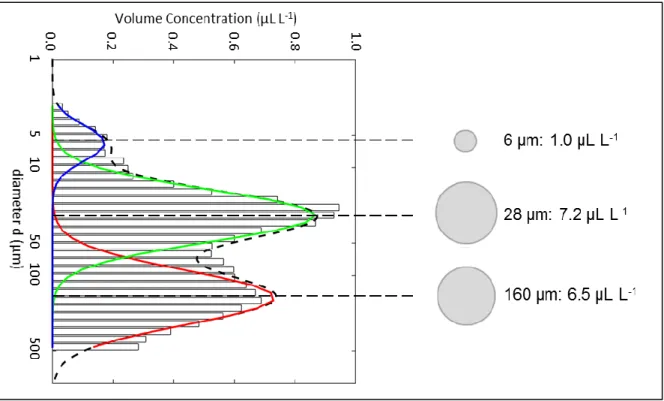
(37) 25. 100X uses a numerical inversion method to transform scattered light intensity measured at concentric ring detectors into volume concentrations for 32 log-spaced size classes (Agrawal & Pottsmith, 2000), ranging from 2.5 to 500 µm. Possible short-term variations in PSDs were cancelled out by calculating a median over 35 samples (around 90 seconds of measurement) (Mikkelsen & Pejrup, 2001). A MATLAB script was implemented to decompose the median distribution into one or more underlying lognormal distributions (Launay, 2014; B. J. Lee, Toorman, & Fettweis, 2014), as PSDs observed in field and experimental samples are often multimodal (Fettweis, Baeye, Lee, Chen, & Yu, 2012; B. J. Lee, Fettweis, Toorman, & Molz, 2012). The mean particle size, the standard deviation and the percent contribution to the total volume concentration was determined for each fitted unimodal distribution. To allow for a clearer and more concise comparison among multiple PSDs, they were converted to bubble charts (Figure 2-5) (Abarca et al., 2017).. Figure 2-5. Representation of a sample PSD as a bubble chart. Each mode is represented by a bubble whose area is proportional to the volume concentration of the mode and its position in the Y axis represents its mean diameter..
(38) 26. 3.. RESULTS AND DISCUSSION. 3.1. Field model 3.1.1. Characterization of the Azufre River and the Caracarani River The Azufre River presented conditions that are typical of AMD affected streams, such as low pH (1.8), high electric conductivity (13.85 mS cm-1) and a high concentration of metals ([Al] ~ 200 mg L-1, [Fe] ~ 90 mg L-1, [As] ~ 2.5 mg L-1, [Zn] ~ 12.8 mg L-1). Due to its low pH, chemical species are mostly in the dissolved phase, resulting in low turbidity values (3 NTU) and low particle volume concentrations (13 µL L-1, Figure 3-1).. Figure 3-1. Particle Size Distribution measurement in the Azufre River. Two means at ~30 µm and ~320 µm account for the major fraction (>95%) of the PSD..
(39) 27. The Caracarani River is characterized by a better water quality, with alkaline conditions (pH ~ 9.6), lower electric conductivity (1.45 mS cm-1) and lower concentration of metals ([Al] ~ 0.3 mg L-1, [Fe] ~ 0.6 mg L-1, [As] < 0.1 mg L-1, [Zn] ~ 0.3 mg L-1). Despite metals being mainly present in the particulate fraction, with the exception of As, the low concentration of metals also results in low turbidity values (3.2 NTU) and particle volume concentrations (4.53 µL L-1, Figure 3-2).. Figure 3-2. Particle Size Distribution measurement of the Caracarani River. The PSD can be decomposed in four modes (~10 µm, ~25 µm, ~80 µm, ~280 µm), with the ~25 µm accounting for the major (>50%) fraction of the PSD.. 3.1.2. Loss of OM due to the association of OM with suspended solids Concentrations of organic carbon upstream the confluence fluctuated between 1.3 and 3.2 mg C L-1 in the Azufre and Caracarani River respectively, with most of it as dissolved OM (>99%). Over 50% of organic carbon was in particulate form downstream the confluence. Measurements indicate a positive correlation between particulate OM and both particulate Fe and Al (R2 = 0.70 and 0.78, respectively, n = 8), which can be attributed to sorption of.
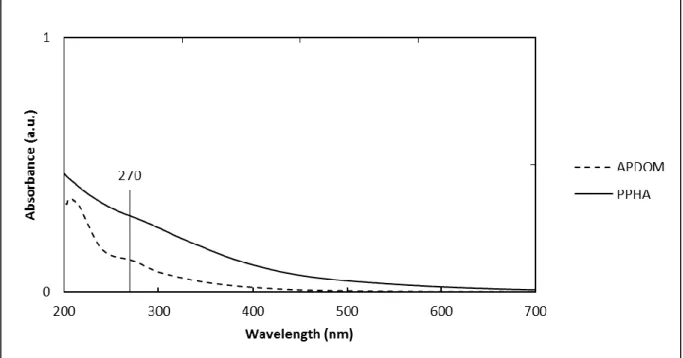
(40) 28. OM onto freshly precipitated oxyhydroxides (McKnight et al., 1992). A mass balance revealed an estimated 10%-15% loss of TOC downstream the confluence (Table 3-1), which is most likely due to settling of Fe and Al oxyhydroxides onto the river bed downstream the confluence. This is consistent with the presence of an oxide coating in the river bed reported by Guerra, Gonzalez et al. (2016). Loss of OM due to association with oxyhydroxides and subsequent settling has been previously reported during the neutralization of the AMD-affected Snake River (McKnight et al., 1992).. Table 3-1. Estimated total organic carbon (TOC) loss for the cross-sections downstream the confluence. Caracarani 50m downstream Caracarani 100 m downstream Caracarani 200 m downstream. Mixing Ratio. Predicted TOC (mg C L-1). Measured TOC (mg L-1). TOC Loss (mg L-1, % in parentheses). 0.101. 3.05 ± 0.2. 2.70 ± 0.2. 0.35 (12). 0.100. 3.05 ± 0.2. 2.67 ± 0.2. 0.38 (13). 0.156. 2.97 ± 0.2. 2.53 ± 0.2. 0.44 (15). 3.2. Characterization of organic matter stock solutions The concentration of dissolved organic carbon (DOC) was 495 mg C L-1 for the APDOM stock solution and 493 mg C L-1 for the PPHA stock solution. An aliquot of APDOM stock solution was acidified to pH 1 with 18 M HCl, incubated for 48 hours at room temperature and later centrifuged to remove the humic acids fraction (Sharma et al., 2011). The supernatant was analyzed for TOC, which yielded a concentration of 360 mg C L-1, meaning that nearly 73% of the APDOM stock was comprised of fulvic acids. 3.2.1. UV-Vis Spectroscopy of APDOM and PPHA The UV-Vis spectra for both OM fractions are characterized by decreasing absorbance with increasing wavelength and are mostly featureless (Figure 3-3); however, both spectra presented a slight shoulder at ~270 nm which is typical of humic substances derived from.
(41) 29. ponds or wetlands (Pouet, Theraulaz, Mesnage, & Thomas, 2007), although it is more noticeable in the APDOM fraction.. Figure 3-3. Normalized UV-Vis spectra of both OM stock solutions. Both spectra are characterized by decreasing absorbance and a slight shoulder at ~270 nm.. The color ratio, defined as the ratio of absorbance values at 400 and 600 nm was higher for the APDOM fraction (12.9) than for the PPHA fraction (7.4). These values are usually observed for fulvic acids (which comprise the majority of the APDOM fraction) and relatively low molecular weight humic acids (Tan, 2014). SUVA values of 6 L mg-1 m-1 for APDOM and 1.4 L mg-1 m-1 for PPHA indicate an approximate aromaticity of 40% and 13%, respectively (Weishaar et al., 2003). 3.2.2. Fourier Transform Infrared Spectroscopy The FTIR spectra of both OM fractions is presented in Figure 3-4. Interpretation of FTIR spectra is a complex task, as some vibrational modes of different functional groups may overlap (Chen, Gu, LeBoeuf, Pan, & Dai, 2002), thus only a preliminary assignment is presented..
(42) 30. Figure 3-4. FTIR spectra of both OM stock solutions. Spectra were scanned in the 4700 – 340 cm-1 range with a resolution of 8 cm -1. Band assignment. Both spectra presented a broad peak at ~3400 cm-1 which was assigned to OH vibrations, while the shoulder at ~2975 cm-1 can be attributed to aliphatic C-H stretching (Tan, 2014). A strong peak at ~1450 cm-1 was also observed in both OM fractions, which can be assigned to stretching of COO-, OH deformation and C-O stretching of phenolic groups (Chen et al., 2002), while the ~870 cm-1 peak can be assigned to aromatic C-H vibrations (Tan, 2014). Some other peaks were exclusive to one of the DOM fractions. The PPHA fraction presented a peak at ~2350 cm-1 which is often attributed to CO2 present in the optical path (Robinson, Skelly Frame, & Frame, 2014). The APDOM fraction showed peaks at 1650 cm-1 and 1150 cm-1 and a small shoulder at 1750 cm-1 which can be assigned to carboxylic functional groups (Chen et al., 2002; Gu et al., 1995). Another peak distinguishing the APDOM fraction from the PPHA one was the peak observed at ~1000 cm-1, which can be attributed to ethyl, aromatic aldehydes and amines, and is characteristic of fulvic acids (Tan, 2014)..
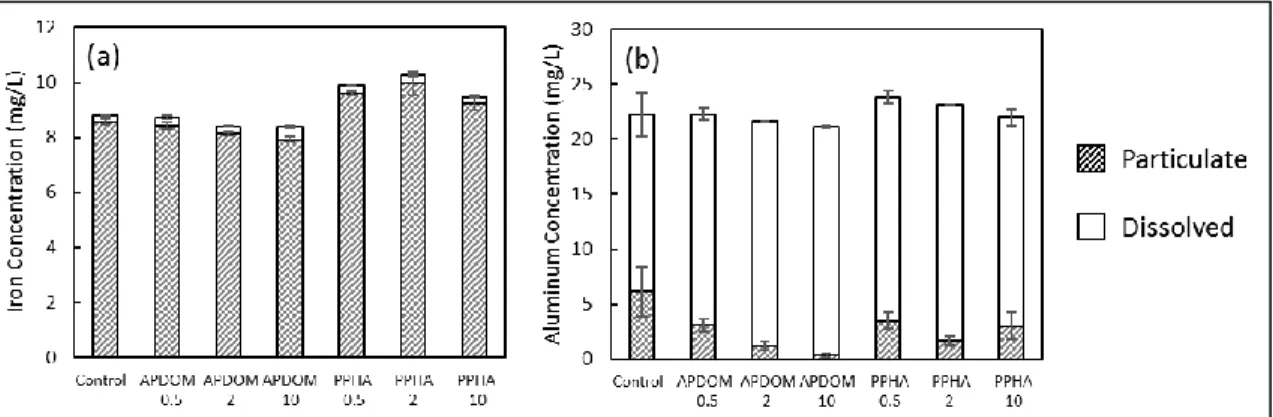
(43) 31. While the previous assignment is not final due to the difficulty of analyzing complex FTIR spectra, it is in agreement with the fact that carboxyl, phenol and alcohol are the main functional groups of humic and fulvic acids (Snoeyink & Jenkins, 1980). 3.3. Laboratory model 3.3.1. Dissolved/particulate partitioning of metals: Fe, Al and As The partition of metals was dependent on pH, the type and concentration of OM, and the metal analyzed. For all experiments performed at pH 4.5, Fe was predominantly present in the particulate fraction after 10 mins (>94%, Figure 3-5a) regardless of the type and concentration of OM. Particulate aluminum was only a minor fraction of total Al (<30%) for all experiments. Increases in the addition of APDOM reduced the concentration of particulate Al, while additions of PPHA did not have significant effects on the partition of Al (Figure 3-5b). Dissolved As concentrations were <0.1 mg L-1 (<40% of total arsenic) for all experiments, indicating negligible differences in arsenic partitioning within the analytical windows used in this work.. Figure 3-5. Concentrations of (a) Fe and (b) Al in the dissolved and particulate phases at 10 minutes, in the experiments at pH 4.5. Fe was mostly present in the particulate fraction regardless of the concentration and type of organic matter. Particulate aluminum decreased with increasing additions of APDOM, while PPHA did not have significant effects on its concentration.. The presence of particulate iron was attributable to the precipitation of HFO, which occurs above pH 3 (Duan & Gregory, 2003). Particulate Al could be attributed to the precipitation of HAO or coprecipitation of Al with freshly precipitated HFOs (Hofmann et al., 2013;.
(44) 32. Ruby et al., 2008), and the decreases in particulate Al upon additions of APDOM could be attributed to the formation of organic Al complexes that prevented the precipitation of HAO (Hagvall, Persson, & Karlsson, 2015) or inhibited Al sorption onto HFO. These results were in agreement with previous studies that showed that above a molar Fe/C ratio of 0.1, Fe and As were mostly present in aggregates larger than 0.2 µm (Bauer & Blodau, 2009) and that humic and fulvic acids did not affect arsenate sorption on ferrihydrite (Grafe et al., 2002), even though the molar Fe/C ratio used in their experiments (~10) was higher than those in our experiments (maximum 0.20). Particulate Fe and As were found at pH 3 in the presence of high concentrations of PPHA (Figure 3-6a and 3-6c), while metals were present mainly in dissolved form in the remaining experiments at pH 3 (Figure 3-6), as HAO and HFO precipitate at higher pH values (Nordstrom, 2011). This could be attributed to the formation of binary and ternary Fe-As-OM colloids that can aggregate (Ritter, Aiken, Ranville, Bauer, & Macalady, 2006; Sharma et al., 2010), especially in high salinity environments (Gunnars, Blomqvist, Johansson, & Andersson, 2002)..
(45) 33. Figure 3-6. Concentrations of (a) iron, (b) aluminum and (c) arsenic in the dissolved and particulate phases at 10 minutes, in the experiments at pH 3. Metals were mostly present in the dissolved phase, except for the 2 and 10 mg C L-1 additions of PPHA.. Arsenic showed an important increase in the particulate fraction throughout the duration of these experiments (Figure 3-7), particularly for additions of PPHA at all concentrations level and the addition of 10 mg C L-1 of APDOM, which can also be attributed to the aggregation of metal-loaded OM. Therefore, removal of trace metals during neutralization of AMD was not only driven by coprecipitation with HFO and HAO, but also by the presence of OM..
(46) 34. Figure 3-7. Concentration of particulate and dissolved arsenic throughout the experiments at pH 3 (measurements at 10 min, 1h and 4 h). An increase in the concentration of particulate As is observed for some experiments, suggesting an aggregation process.. 3.3.2. Dissolved/particulate partitioning of organic carbon Particulate organic carbon (POC) was observed after 10 min in experiments at pH 3 (Figure 3-8b), despite the absence of metals in the particulate fraction. Concentrations of POC were higher at pH 4.5 for all additions of APDOM and the 10 mg C L-1 addition of PPHA compared to the same additions at pH 3 (Figure 3-8a).. Figure 3-8. Concentration of organic carbon in the dissolved and particulate fractions at 10 min for the experiment at (a) pH 4.5 and (b) at pH 3. Particulate organic carbon was observed at both pH conditions. Nevertheless, POC concentration were higher at pH 4.5, particularly for the APDOM experiments and the 10 mg C L-1 addition of PPHA..
(47) 35. The presence of POC at pH 3 was attributable to the precipitation or aggregation of humic substances at low pH through cation bridges (Mouvenchery, Kučerík, Diehl, & Schaumann, 2012; Tipping, 2004). The higher concentrations of POC at pH 4.5 can be attributed to sorption of OM onto Fe oxyhydroxides. The difference between APDOM and PPHA when comparing POC concentrations at pH 3 and pH 4.5 could be attributed to the fact that APDOM is mainly composed of fulvic acids, as it has been observed that Fe oxyhydroxides like ferrihydrite and goethite sorb preferentially fulvic acids over humic acids (Grafe et al., 2001, 2002). These results indicate that organic carbon partitioning in a system affected by acid drainage is not only controlled by pH and the presence of metals, but also by the type of OM.. Total and dissolved organic carbon measurements remained relatively constant throughout the experiments, suggesting that microbial growth and OM consumption were negligible. A few samples presented a significant (up to 50%) decrease in TOC concentration, though additional replicate experiments also showed constant organic carbon values, suggesting that sampling or measurement variability could have taken place in those samples. 3.3.3. Changes of PSDs formed during acid drainage neutralization An increase in the volume concentration of particles occurred throughout the experiments regardless of pH conditions and the addition of OM (Figure 3-9). Constant EC values and relatively small changes in the concentration of particulate Fe, Al and OM during the experiments suggested that aggregation of already precipitated species occured, rather than additional precipitation. Larger volumetric concentration were observed at pH 4.5 (10 – 450 µL L-1, Figure 3-9a) compared to experiments at pH 3 (0.5 – 40 µL L-1, Figure 3-9b), which can be attributed to the precipitation and aggregation of Fe oxyhydroxides. The addition of OM led to higher volumetric concentrations of particles. At pH 4.5, in which oxyhydroxide precipitation occurs, sorption of OM onto the particles can neutralize their surface charge (Warren & Haack, 2001), which promotes particle aggregation (Duan.
(48) 36. & Gregory, 2003). At pH 3, in which precipitation of Fe and Al oxyhydroxides does not occur, the observed volumetric particle concentration could be attributed to OM aggregation (Tipping, 2004).. Figure 3-9. Total volumetric concentration of particles throughout the experiments at (a) pH 4.5 and (b) pH 3. The volumetric concentration increased throughout all experiments, suggesting an aggregation process. Volumetric concentrations were larger at pH 4.5, which was attributed to the precipitation of Fe oxyhydroxides, and at larger additions of organic matter.. Properties of PSDs (mean particle size and multimodality) were also affected by the type and concentration of OM. For experiments performed with APDOM (Figure 3-10),.
(49) 37. particles tended to aggregate around two modes, one within the 20-30 µm range and a larger one in a broad range between 80-250 µm. This second mode became smaller with larger additions of OM, but it also increased its proportion of the total concentration of particles, which resulted in a larger overall mean particle size. The addition of PPHA promoted an aggregation process around a single mode in the 20-30 µm range, which also became smaller and more prominent with increasing concentrations of OM (Figure 3-11). This difference in preferential mode size impacts the settling velocity of particles. In fact, assuming a density of 4300 kg m-3 (the density of goethite) (Tsukimura, Suzuki, Suzuki, & Murakami, 2010), 20 µm particles have an estimated settling velocity of 290 cm h-1, while 60 µm particles would settle at 2616 cm h-1. This difference would heavily impact the design of sedimentation tanks..
(50) 38. Figure 3-10. Time series of PSDs during the experiments for (a) 0.5 mg C L-1, (b) 2 mg C L-1 and (c) 10 mg C L-1 additions of APDOM, at pH 4.5. Black dots represent the mean particle size of each PSD. All experiments converged to bimodal distributions, with one mode around 20 µm and a larger one between 80 and 200 µm..
(51) 39. Figure 3-11. Time series of PSDs during the experiments for (a) 0.5 mg C L-1, (b) 2 mg C L-1 and (c) 10 mg C L-1 additions of PPHA, at pH 4.5. Black dots represent the mean particle size of each PSD. PSDs tended to converge to unimodal distributions with a mode at ~20 µm..
Figure


+7


Documento similar