Which could be the role of Hybrid Fibre Coax in Next
Generation Access Networks?
Angel Martín, Rafael Coomonte, Claudio Feijóo
Research Centre for Smart Buildings and Energy Efficiency (CeDInt)Technical University of Madrid (UPM) Pozuelo de Alarcón, Madrid, Spain Mail:{amartin, rcoomonte, cfeijoo}@cedint.upm.es
Abstract— Next generation access networks (NGAN) will support a renewed communication structure where opportunities lie in the provision of ubiquitous broadband connectivity, a wide variety of new applications, appealing contents and a general support to the sustainable growth of diverse sectors. From their deployment it is expected a wealth of innovations, jobs creation and a new wave of economic growth. In this paper we discuss which could be the role of Hybrid Fibre Coax (HFC) in the Next Generation Access Network (NGAN) roadmap. Thus, we propose a simplified model for making approximate cost calculations for HFC deployment based on the geographic and socio-demographic characteristics of Spain. Considering the latest evolution of HFC based on DOCSIS 3.0 from integrated (I- CMTS) towards modular (M-CMTS), the results from the model are compared with the most competitive NGAN for ultra-broadband speeds: Fibre to the Home (FTTH) based on Gigabit-capable Passive Optical Networks (GPON).
Keywords- Next generation access networks (NGAN), Hybrid Fibre Coax (HFC), Data Over Cable Service Interface Specification (DOCSIS), Cable Modem Termination System (CTMS), integrated (I- CMTS), modular (M-CMTS), Fibre to the Home (FTTH), Gigabit-capable Passive Optical Networks (GPON), CAPEX, OPEX.
I. INTRODUCTION
The rise of what has been called the knowledge economy has reinforced the role of telecommunications as a strategic investment. The consensus regarding the importance of telecommunications has changed the reasoning at play. It no longer includes the existence of an adequate infrastructure as a factor affecting regional development. Instead, its absence is considered a sign of underdevelopment. Almost all countries have launched their own proposals for adapting their economies to the new socioeconomic paradigm that is taking shape. Any document related to a plan to promote the information society tries to prove the “importance of broadband”. As an example, the Communication from the Commission entitled “Bridging the broadband gap” [7] offers a categorical argument: widespread broadband access is a key condition for the development of modern economies and is an important aspect of the Lisbon agenda. Along these lines the so-called Next Generation Networks (NGN)1 will be the
1
The NGN Working definition can be found at:
http://www.itu.int/ITU-T/studygroups/com13/ngn2004/working_definition.html
supporting infrastructure of ubiquitous broadband. The uncertainties on the deployment of NGN, together with their role as basic infrastructures of the knowledge economy have prompted a growing amount of studies, reports and papers from the industry, regulatory authorities and academia about the circumstances for their future deployment [2][5][9].
As a standard for high speed data transmission, hybrid fibre coax (HFC) is one of the main access technology in which NGAN are based. Since the 3.0 version of DOCSIS was developed, the Cable Modem Termination System (CMTS) architecture has evolved from the integrated (I-CMTS) towards the modular (M-CMTS) solution. The later brings some advantages over the former, such as the capacity to manage more channels per CMTS headend termination, so the modular architecture is now being adopted in some migration schemes from DOCSIS 1.1 to the 3.0 version.
As a technology with a significant evolution since its origins cable networks are widely deployed in Europe and USA, and particularly in Spain. The approach in this paper uses data from Spain as the demographic and geographic framework for what could be considered an average European scenario.
Therefore, this paper intends to provide a simplified CAPEX and OPEX model for the deployment costs calculation of HFC NGAN, separately for both Integrated and Modular CMTS versions. Once the results on the deployment costs are obtained some broad limits of market action are established – looking at the order of magnitude of the costs involved- as well as some comparisons with FTTH (Fiber To The Home) technologies and over time. Indeed, this estimate must be necessarily simple since a detailed cost calculation would demand the individualised study of every location and circumstance. Despite these limitations, this exercise will allow extracting some interesting conclusions on the main advantages and drawbacks of networks based on HFC and, specifically, shall allow discerning the feasibility and profitability of deployment of this specific type of NGAN.
II. DOCSIS NGAN: BASIC ARCHITECTURE CONCEPTS AND STATUS OF DEVELOPMENT
For the purposes of this paper, and as a summary concept, a NGN will be a single network which delivers multiple data applications –whether originally based on voice, data, video- to multiple devices -whether fixed or mobile. In addition, it will be considered that the provision of services is decoupled from networks. Therefore, services have to be supported by
infrastructures and have their own network infrastructure-independent evolution. Given this assumption, the infrastructure part of a NGN will be divided into two main sections: the backbone and the access. It will be in the access part where the main technology choices are available. This choice is simply a matter of costs (which in turn depend basically on demographic and geographic variables), possible re-use of existing infrastructures and the user’s requirements (and expectations). This access part of a NGN is what is called Next Generation Access Networks (NGAN)2.
In general, broadband access technologies are classified by the physical medium in two major groups: wired –or fixed line- technologies and wireless technologies. Fixed networks are based on fibre, coaxial and copper wire. In the following we will consider only the wired coaxial-based network, leaving aside the other solutions, and only using data relative to a FTTH deployment [9] to establish some cost comparisons. Of course the technology considered for the study has its advantages and drawbacks in terms of maximum bandwidth/transmission speed, reliability, cost of deployment and ease of coverage. Table 1 shows a summary of the main milestones and features of DOCSIS – and FTTH as the technology with which the cost comparison will be set - compiled from publicly available industry data and forecasts. TABLE I. SUMMARY OF MAIN MILESTONES IN THE EVOLUTION OF COAX
AND FIBRE NGAN.SOURCE: OWN COMPILATION FROM INDUSTRY DATA
Indicator DOCSIS 3.0 FTTH – GPON Theoretical maximum data rates 400 Mb/s (downstream) 108 Mb/s (upstream) 2,5 Gb/s (downstream) 1,25 Gb/s (upstream) Typical data rates
practically available per user 50 Mb/s (downstream) 10 Mb/s (upstream) 100 – 250 Mb/s (downstream) 50 – 100 Mb/s (upstream) Begin of massive deployment in EU 2009 – 2011 2009 – 2012 Enhanced version –
max data rate
DOCSIS 4.0 10 Gb/s
10G GPON 10 Gb/s
Critical technologies CPE WDMA
Main advantages Re-use of coax cable Guaranteed data rates Main barrier (as of
May 2011)
Sharing channels
among customers Deployment costs
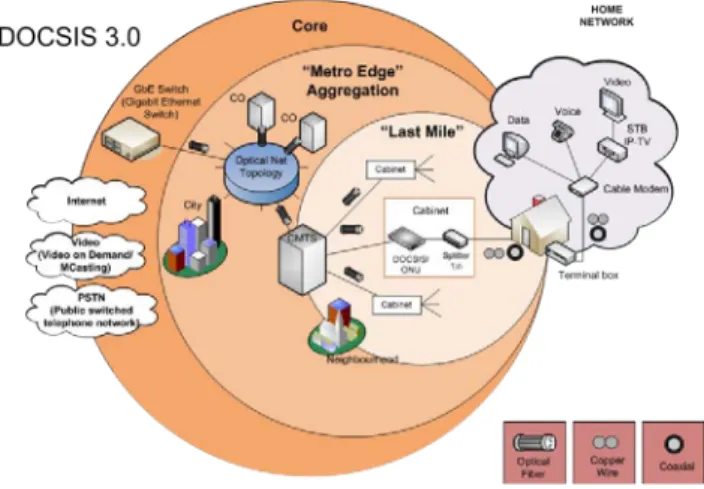
Typically cable networks use HFC (“hybrid fibre-coaxial”) technology. As the name suggests, these networks employ both fibre and coaxial as transmission media. Usually the last segment –about 500 m- is made of coaxial cable. Fibre is used for concentration of several accesses at a cabinet or terminal node. The so-called cable “headend” where the fibres depart from, acts as the interface between the transport network and the access part and hosts the equipment to manage data traffic from customers, the video servers and the telephony equipment. In practice, depending on the number of customer premises served by the shared fibre, there are several versions
2
To this regard, it must be pointed out that there is nothing like a strict definition of the minimum access speeds provided by a NGAN or any other quality parameter. A tacit agreement at the industry level seems to put this figure at 50 Mb/s as of May 2011.
of the technology. Apart from the obvious distinction of using coaxial cable instead of copper wire in the last part of the network, the other main difference among cable networks and FFTx architectures lies on the sharing of the downstream and upstream channels in the coaxial part among several customers.
Figure 1. DOCSIS networks architecture
The reasons for this “shared access” derive from the original purpose of cable networks as systems for television broadcasting. In such a system it was logical to share television “channels” among customers to optimise the usage of the available bandwidth. When the demand of broadband access to Internet appeared, the channel approach was maintained simply replacing television signals for data transmission in the appropriate number of channels. However, the channels were still shared among several customers. It was also required to find some space in the coaxial for the upstream data traffic as the original concept –broadcasting- of the cable television network was just unidirectional. As a consequence still today the broadband access through cable technologies is strongly asymmetric. The cable modem –the name of the customer premises equipment in this technology- is able to tune in the channel/s assigned to the particular customer for broadband access apart from the usual 200-300 digital television programmes distributed in other channels.
DOCSIS is precisely the name of the series of standards developed for high-speed data transmission over cable networks. The first version of the standard DOCSIS 1.0 was issued in 1997 and version 1.1, the most popular as of May 2011- in 1999. In 2006 it was unveiled DOCSIS 3.0 that currently supports typically up to 400 Mb/s downstream and 120 Mb/s upstream, with these figures doubling for its next evolution. Cable modem equipment DOCSIS 3.0-compliant manage group of channels to achieve these speeds, but the channels remain shared among a number of customers. For this reason the comparisons between different DOCSIS deployments are difficult if not exactly the same quality of service is considered. Evidently, the same applies for comparisons between DOCSIS and FTTx technologies.
As a final remark, it is interesting to note that some of the most recent deployments of cable networks (this is the case of
many areas in Spain, for instance) include copper wire “in parallel” with the coaxial drop. This strategy allowed for saving in network equipment using separately a mature telephony technology for voice, instead of complicating the coaxial management3.
III. NGAN SCENARIO IN SPAIN
The approach for the calculation of the deployment costs uses data from Spain as the demographic and geographic framework; nevertheless the model here used would be applicable without major modifications in most of the European countries4.
The assumptions on demographic conditions for network deployment consider a classification in zones based on population density5 as the basic parameter affecting the cost of rolling out a next-generation broadband access network, and therefore, in order for the differences in costs between different area types and technologies to be identified.
Then, a division in 10 zones6 (numbered I to X) has been chosen to depict the complete landscape of the Spanish country (Table VIII). The motivation lies in enjoying more precise estimations in the “grey” areas that the competitive market providers could reach in the medium term as a function of technology, demand and public policies. In fact in the case of Spain about one quarter of the population lives in the 500 – 100 inhabitants/Km2 area, where the population density typical of suburban zones finishes and the rural type-of-density begins. About 46% of the population lives in urban areas (above 1000 inhabitants/Km2), with an additional 10% in lower-density suburban areas. Remote rural areas (below 50 inh/Km2) made up 12 % of the population.
In any case, for the cost calculation model in this paper only the first five density groups were used, that is the municipalities with a density above 500 inh/Km2. This selection is based on the actual practice in Spain, which has been only deployed in highly populated areas. New deployments of DOCSIS 3.0 NGAN would require high levels of civil works and therefore would have a major impact on deployment costs in rural areas.
Despite these limitations, this exercise will allow extracting some conclusions on the evolutionary outlook of the coax networks and, specifically, shall allow discerning the feasibility and profitability of the deployment of a DOCSIS 3.0 network.
To achieve a more complete general overview of the Spanish framework some notes on the current broadband
3
At that time, i.e., early 1990s, VoIP was not mature enough for massive deployments to residential customers.
4
See Annex 1 for a detailed description of the main demographic parameters and geotypes used in the calculations. Apart from the direct relevance of the case of Spain as a main European instance for NGAN deployment, it is interesting to note that data for Spain are relatively similar to the Euroland scenario [10].
5
The other basic option would have been to choose the city/town size, which could give an indication of deployment priority but does not capture well enough the distinction between urban and rural areas, see Analysis Mason (2008, p. 35) for a discussion.
6
Previous studies usually considered 3 to 7 zones [2], [10].
network coverage in Spain must be made. It can be said that the situation is well over the 2009 OECD average in xDSL (96.1%), 3G (83%) and cable (60.2%). Therefore the percentage of households and business passed is higher than countries as Germany or United Kingdom, but on the other side, the number of subscribers is lower. In general terms it can be said that we are currently in a very early stage of NGAN deployment particularly out of main urban areas. In fact, as of July 2010 the interest of main telecom operators in Spain for investments in NGAN development is rather modest, with only some commitment from cable operators to deploy DOCSIS 3.0 in their existing plant and some FTTH initiatives as pilot deployments and from regional operators (for instance Telecable in Asturias region).
The data on DOCSIS 3.0 NGAN 2010 deployments in Spain are shown in Table II.
IV. METHODOLOGICAL ASSUMPTIONS
A. Cost calculations assumptions
As it has been described before, there are multiple possible broadband access solutions for both residence and businesses. Thus, this deployment costs model proposes two possible choices for DOCSIS network design over the same type of transport backbone: integrated and modular.
For a comparative base for all access networks analyzed, the model is built for a downstream bandwidth of 50Mbit/s per subscriber, and with traffic guaranteed of 80%.
The backbone network is not included in the calculations and, therefore, the paper does not consider whether each operator deploys its own transport network or shares the deployment expenses of this part of the network7 .
No assumptions are specifically made on the impact on costs of there being more than one operator in the access market.
The total cost (present value) for the deployment of a coax NGAN in Spain will consider reaching 100% of households and businesses in the area under consideration in a period of 10 years since the beginning of the deployment.
To calculate the present value of investments, a weighted average cost of capital (WACC) of 12% is considered, in accordance to previous studies8 and financial conditions for European broadband operators [2]. The rate of average yearly inflation is estimated at 2%, the objective of the European Central Bank.
B. Demographic and geotypes assumptions
The main drawback of the classification based on population density used in this paper is the lack of information of buildings clustering, mainly in suburban and rural areas.
7
For the interested reader the paper from [6] offers some estimation on the capex and opex for building such a backbone network from the scratch, using both a top-down analysis and a bottom-up approximation.
8
This value has been calculated adding the interest rates (around 2 to 3%) to a 7-9% representing investment-related financial costs and market risks.
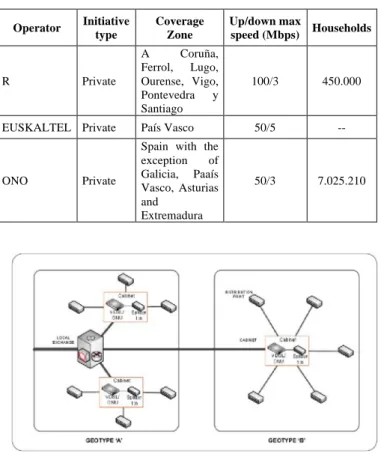
Therefore, to enhance the modelling of the deployment costs, each of the five density zones has been divided into two types, (a) and (b), resulting in a total of 10 geotypes for the calculations. The key element for this additional categorisation is the location of the local exchange or cable headend. For instance, exchanges tend to cover the central core of a settlement and, at the same time, some wider areas where the settlement is sparser (Analysis Mason, 2008), as shown in Fig. 2.
To divide the number of potential subscribers (inhabitants, households and businesses) among these two types, 5 prototypical municipalities for each of the density zones have been chosen9 . For each of these municipalities it has been possible to obtain the percentage of surface for dense urban10 and scattered urban and suburban areas11 using data from [14]. The resulting population-weighted average has been regarded as representative of the situation in each of the zones.
TABLE II. SUMMARY OF DATA ON DOCSISNGAN DEPLOYMENTS IN
SPAIN.SOURCE (FEDEA,2010),ONO
Operator Initiative type Coverage Zone Up/down max speed (Mbps) Households R Private A Coruña, Ferrol, Lugo, Ourense, Vigo, Pontevedra y Santiago 100/3 450.000
EUSKALTEL Private País Vasco 50/5 --
ONO Private
Spain with the exception of Galicia, Paaís Vasco, Asturias and Extremadura 50/3 7.025.210
Figure 2. Different geotypes within an access area. Source: Analysis Mason (2008)
9
Those municipalities closer to the average population and surface in each zone were selected.
10
Defined as more than 80% of the surface covered with buildings and roads [11]
11
Defined as the surface covered with buildings and roads associated with areas of vegetation or land occupying between 30-80% of the total surface [11].
At this point it is important to notice that this approach is valid for a gross estimation of the deployment costs of a NGAN. However, in a practical deployment case the optimal trenching topology should be calculated by some –typically heuristic- procedure that takes into account exact data on headends and central offices, location of existing ducts for potential re-use and customer location for each town and municipality.
C. Demand distribution
The model presented in this paper intends to be as agnostic as possible with regard to demand. However it is required to include some assumptions about it since some of the costs calculations are dependent on the actual number of customers in the network.
As regards deployment costs, it is considered that the network could potentially reach 100% both of individual and business users. The total number of potential users (residential customers and businesses) of fixed networks used in this model is 10.3 million. However, only up to 80% of them will subscribe to a given network, i.e., they will be customers of a particular broadband service.
Two other parameters are required to model the behaviour of demand for costs calculations: take-up and churn. To simplify the calculations take-up is assumed to represent net additions to the network (therefore including the effect of churn) and it is also assumed that it will happen at 10% constant rate with regard to the total of potential subscribers. This means that if, for instance, the network is deployed in 4 years, the level of 80% of the total potential subscribers would be reached in 9.5 years. Once the maximum level of subscribers is attained it will remain indefinitely at that number.
Obviously, this is an optimistic scenario for each technology in terms of adoption, but from the perspective of costs is a worst-case scenario. The churn rate will be 18% of existing customer base or, equivalently, on average each customer changes operator about every five years, a figure similar to the existing churn in mobile networks.
V. COST MODEL
In this section a cost model is described for two DOCSIS deployment solutions: I-CMTS and M-CMTS. All the data for costs are supplied by the industry at 2010 prices, either publically or through direct interviews with industry representatives.
A. Deployment cost model
Coax network deployments based on DOCSIS 3.0 have two main components: the update of existing cable networks and the type of deployment in new areas that are currently not covered.
Therefore, the first step is the calculation of the number of cable nodes to be upgraded and the amount of new network deployment. For this each geotype has been divided in two parts, as shown in Table XI of Annex 2, with the percentage of potential subscribers already covered by HFC networks that
must be upgraded and the remaining areas not yet covered where new network deployments are needed.
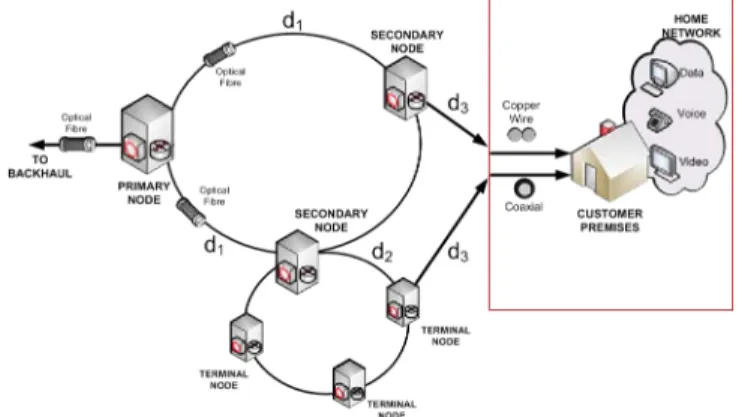
Each new HFC cable access area (CBANP) is divided in areas (NCAREA) of 50.000 potential users, also referred as Home Passed (HP). This is further divided in areas of 2000 HP that are composed of three terminal node (NT) and one secondary node (NS), each of them covering 500 HP . This typical cable distribution is shown in Fig. 3.
The topology architecture of a NCAREA is ring-based. From each primary node (NP) a ring links the NS in the area, and from each NS the NTs are also connected using a fibre ring. Both in the NS and NT outdoor cabinets the HFC optical to electrical (O/E) conversion is made. Note, therefore, that in the model depicted there are two different types of access nodes to reach the user, a fact that affects significantly the cost of network deploying (Fig. 4).
The evolution from integrated towards modular architectures have been achieved by some CMTS vendors and then it is been adopted by cable operators. This CMTS evolution increases the downstream capacity, and also brings a more cost effective solution from the perspective of both new deployments and existing customers upgrade. The change means moving from the simple upgrade of existing CMTS nodes with new DOCSIS 3.0 line cards (DS and US channels in the headend CMTS) towards a new M-CMTS architecture, as shown in Fig. 5, consisting of direct fibre connection from the CMTS to the EdgeQuam.
Figure 3. Sections of wired DOCSIS access networks for cost calculations
Figure 4. Possible types of access nodes to reach the user in DOCSIS networks, for cost calculations model
From the NP to the customer premises, the total deployment cost per area CBANP in the I-CMTS architecture is given by (1)12:
!"#!"! = !!!!"#$+ !"#$%&'!"#+ !"#$%&'!"#+
!!"#+ ! !! !"#$+ ! 7! !!"#$ + !!!! !!"#$%+
!!"#$%&'(+ !1! !!"#$%+ !!"#"$% !!!!!!"#$% +
!!"#$%&'( + !2!"!#$%&!!"! !!"#$+ !!"#$%&'+ !!"#"$% + !!!! !3!!! !coax QR540!!+ !coax RG6!! + !!"#"$% +
3 !!"#$%+ !!
! (!!"#!+ !!"#!+ !!"#!) (1)
The total deployment cost per area CBANP for M-CMTS, from the NP to the customer premises is given by:
!"#!"! = !!!!"#$+ !"#$%&'!"#$%$+ !"#$%&'!"#+ !"#$%&'!"#+ !!"#+ !!" !"#$+ ! 7! !!"#$ + !!"#$%+ !!"#$%&'(+ ! !!! !1! ! !"#$%+ !!"#"$% !!!!!!"#$% + !!"#$%&'( + !2!"!#$%&!!"! !!"#$+ !!"#$%&'+ !!"#"$% + !!!! !3!!! !coax QR540!!+ !coax RG6!! + !!"#!"# + 3 !!"#$%+ !!!(!!"#!+ !!"#!+ !!"#!) (2)
Where detail of costs (C´s) and costs of ducts (cduct) are extracted from [9], weighted by the relative percentage of distribution among geotypes (a) and (b) according to data supplied in Table IX in Annex 1.
I CMTS Architecture
M-CMTS Architecture
Figure 5. I-CMTS and M-CMTS architectures.
The present value of the total deployment cost per access area (NPVCAdp) requires the choice of the number of years for the network roll-out (ny). The network costs that do not depend on the number of potential users in the access area are assumed to
12
Details of all items and symbols represented in formulas (1) to (9) are explained in table VIII in the annex.
be incurred the first year. The costs incurred each year are discounted at the WACC ratio:
The present value of the total deployment cost per zone (NPVCZop) is, therefore: !"#$%!"! = !"!!"!!"#$ !+ !"!"!!"#$ !! !!!"##!!! !" !!! (3)
The present value of the total deployment cost per zone (NPVCZdp) is, therefore:
!"#$%!"! = !"#$%!"! !!"#$
!
!!"#!! (4)
where NAREA is the number of potential users (households and premises) in each zone as given in Table X. Finally the present value of the total deployment cost per zone and per user (NPVCZDP) is, obviously:
!"#$%!"! =!"#$%!"!
!!"#!! (5)
B. perating cost assumptions
Costs of installation of final vertical drop, customer activation, cable modems and phone terminal or MTA have been included among the operating costs13 . A summary of the operating costs of a wired coax based NGAN used for this model can be found in [9]. For the calculation of the operating costs each wired access area is composed of a potential number of users (NAREA) as summarized in Table X in Annex 2.
For the cable DOCSIS 3.0 network the operating cost for year n has two components: new cable network deployment and the existing cable customers migration to DOCIS 3.0. The yearly total operating costs per access area (CACbop) are given
by: !"!"#$! = min !!"#!! !"#$ !"#, ! !"#_!"#!! !" !!"# ! ! ! !!"#$+ !!!!"#!!!!"#+!!"#! + !!"#$%&'+ !!"#$+ !!"#$+ !!"#$+ !!"##+ !!"#+ !!"#$ + min !!"#!! !"#$!"#, !!"#$_!"#!! !" !!"# ! ! ! !!!!"#!!!!"#+ !!"# ! + !!"#$+ !!"#$+ !!"#$+ !!"##+ !!"#+ !!"#$ (6)
The present value at year i of the total operating costs per access area (NPVCAop) are discounted at the WACC ratio:
!"#$%!"! = !"!"!!"#$ !! +
!"!"!!"#$ !! (!!!"##)!!!
!"
!!! (7)
The present value of the total deployment cost per zone (NPVCZop) is, therefore:
13
The classification of this cost in the capex or opex category is subject to discussion. For example, as regards CPE/terminal subsidising for winning customers, it would be possible strictly speaking to differentiate between the cost of subsidising the first terminal for each user (capex) and the cost of subsequent user equipment which is subsidised to customers who have already been activated (opex).
!"#$%!"! = !"#$% !" ! !!"#$!
!!"#!! (8)
where nuser is the number of potential users (households and
premises) in each zone as given in Table VIII in Annex 1. Finally the present value at year i of the total operating costs per zone and per user are (npvcop):
!"#$%!"! =
!"#$%!!"
!!"#!! (9)
As a final consideration, it is important to highlight that depreciation periods and amortisation costs have not been considered in this paper. Following [6] some typical figures for fixed access networks are: passive and active equipment, 10 years; cables, 15 years; construction elements, 20 years; and other expenses, 5 years.
VI. SOME RESULTS
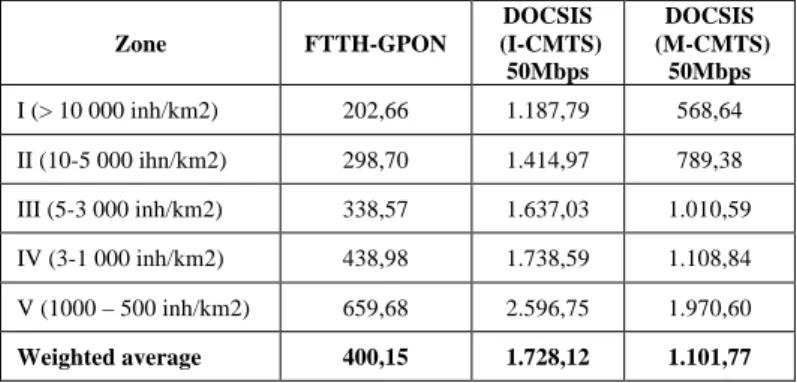
Table III displays the present value of the total CAPEX by zone, while the annualized14 (i.e., divided by the number of years for the roll-out) present value per user is shown in Table IV. It can be seen that, rather obviously, the costs increase with lower densities of population.
TABLE III. PRESENT VALUE OF TOTAL CAPEX (M€) BY ZONE (2011-2020).SOURCE: OWN CALCULATIONS
Zone FTTH-GPON DOCSIS (I-CMTS) 50Mbps DOCSIS (M-CMTS) 50Mbps I (> 10 000 inh/km2) 195,26 1.430,52 684,84 II (10-5 000 ihn/km2) 624,41 3.697,33 2.062,66 III (5-3 000 inh/km2) 401,41 2.426,12 1.497,72 IV (3-1 000 inh/km2) 1.130,63 5.597,32 3.569,87 V (1000 – 500 inh/km2) 954,09 4.694,5 3.562,5 Total 3.305,81 17.845,87 11.377,67
TABLE IV. ANNUALIZED PRESENT VALUE OF CAPEX PER USER (€) BY
ZONE (2011-2020).SOURCE: OWN CALCULATIONS
Zone FTTH-GPON DOCSIS (I-CMTS) 50Mbps DOCSIS (M-CMTS) 50Mbps I (> 10 000 inh/km2) 202,66 1.187,79 568,64 II (10-5 000 ihn/km2) 298,70 1.414,97 789,38 III (5-3 000 inh/km2) 338,57 1.637,03 1.010,59 IV (3-1 000 inh/km2) 438,98 1.738,59 1.108,84 V (1000 – 500 inh/km2) 659,68 2.596,75 1.970,60 Weighted average 400,15 1.728,12 1.101,77 14
This figure is provided to supply an easy comparison as a minimum floor with annual ARPU levels.
TABLE V. PRESENT VALUE OF TOTAL OPEX (M€) BY ZONE (2011-2020).
SOURCE: OWN CALCULATIONS
Zone FTTH-GPON DOCSIS
50Mbps I (> 10 000 inh/km2) 351,92 249,60 II (10-5 000 ihn/km2) 763,55 496,83 III (5-3 000 inh/km2) 433,06 279,17 IV (3-1 000 inh/km2) 940,76 577,30 V (1000 – 500 inh/km2) 528,28 340,72 Total 3.017,57 1.943,62
OPEX is dominated by maintenance, support, billing, etc, in any technology. The present value of the total OPEX by zone is presented in Table V. As the Modular and Integrated versions of DOCSIS have similar operational costs only one column with this value for coax NGAN is shown.
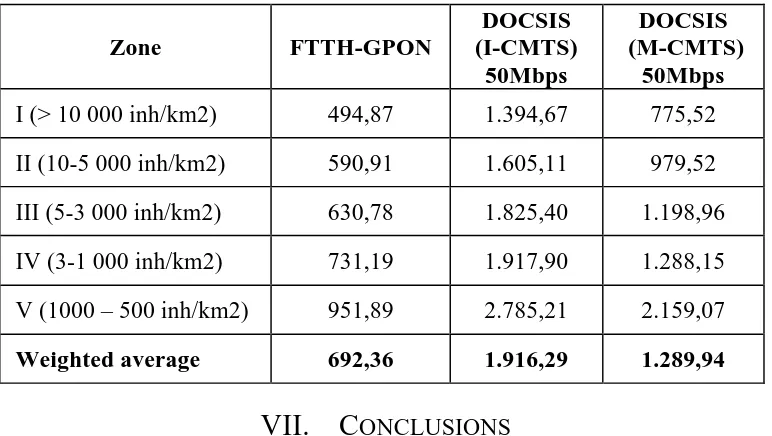
Finally, the present value of the total cost per subscriber by zone is presented in Table VI.
TABLE VI. PRESENT VALUE OF THE TOTAL COST PER SUBSCRIBER (€) BY
ZONE (2011-2020).SOURCE: OWN CALCULATIONS
Zone FTTH-GPON DOCSIS (I-CMTS) 50Mbps DOCSIS (M-CMTS) 50Mbps I (> 10 000 inh/km2) 494,87 1.394,67 775,52 II (10-5 000 inh/km2) 590,91 1.605,11 979,52 III (5-3 000 inh/km2) 630,78 1.825,40 1.198,96 IV (3-1 000 inh/km2) 731,19 1.917,90 1.288,15 V (1000 – 500 inh/km2) 951,89 2.785,21 2.159,07 Weighted average 692,36 1.916,29 1.289,94 VII. CONCLUSIONS
Undoubtedly, the deployment of NGAN is the technical and business element around which the future evolution of the information and technology sector revolves. However, numerous uncertainties remain regarding their development. The analysis that has been presented in this paper, allows extracting a few important consequences on the role of FTTH and coax networks as two of the main technologies for NGAN.
The results on the present value of the total cost per subscriber, presented in table VI, for all population density zones, show that FTTH-GPON requires less of 53 % of average of the investment than DOCSIS, even compared with the most competitive alternative, i.e. M-CMTS. Therefore FTTH-GPON is in general the most economic solution. Other conclusion is that the evolution of DOCSIS from I-CMTS to M-CMTS shows a strong investment reduction, 33% in average, in the analyzed zones. Therefore, the evolution of DOCSIS from integrated CMTS (I-CMTS) towards modular (M-CMTS) reveals a clear competitive path in the cable segment. Nevertheless the costs involved are still far from the ones needed for FTTH- GPON.
It is also worth to point out that DOCSIS is less competitive in areas with lower population density and where new
developments are predominant. That is because network engineering of DOCSIS primary nodes is optimized for the existing customers. In the other hand FTTH nodes due to less dependency from initial network engineering can be designed to attend a wider variety of density levels.
Data rates are another parameter for the comparison between cable and fibre networks. We have take an absolute value such as 50 Mb/s, the implementation of FTTH will ensure this speed for 100% of the users all of the time while cable solutions are still a shared media and for last mile users.
Therefore, the expected market share and the expected number of concurrent users impact the real data rate. The bottom line of this comparison is that setting figures of NGAN for whatever purpose (policy goals, commercial objectives, regulations, etc) requires an appropriate and clear-enough labelling: at least which speed (total, downstream/upstream) and what amount of concurrent users/which level of quality for data rates is guaranteed. This transparency at least could help to avoid confusion and/or disappointment in ultra-broadband users.
REFERENCES
[1] Analysis Mason. (2008). The costs of deploying fibre-based next-generation broadband infrastructure. London: Final report for the Broadband Stakeholder Group. Retrieved from http://www.broadbanduk.org/component/option,com_docman/task,doc_ view/gid,1036/Itemid,63/
[2] Analysis Mason. (2009). Competitive models in GPON. London:
Ofcom. Retrieved from
http://www.ofcom.org.uk/research/technology/research/emer_tech/sbt/A nalysys_Mason_GPON_Final_R1.pdf
[3] Casier, K., Verbrugge, S., Meersman, R., Colle, D., Pickavet, M., & Demeester, P. (2008). A clear and balanced view on FTTH deployment costs. Paper presented at the FITCE Congress 2008.
[4] CMT. (2009a). Informe anual 2008. Barcelona: Comisión del Mercado de las Telecomunicaciones. Retrieved from http://www.cmt.es/es/publicaciones/anexos/Informe_Anual_2008_.pdf [5] CMT. (2009b). Informe final sobre los resultados del modelo de
despliegue de redes FTTH/GPON en España. Barcelona: Comisión del Mercado de las Telecomunicaciones. Retrieved from http://www.cmt.es/es/documentacion_de_referencia/redes_nueva_gener acion/anexos/Informe_final_HE_1_2008_09_MDF.pdf
[6] De-Antonio, J., Feijóo, C., Gómez-Barroso, J., Rojo, D., & Marín, A. (2006). A European perspective on the deployment of next generation networks. fact that become a competitive advantage in these zones (April – June), 47-55.
[7] EC. (2006). Bridging the broadband gap 20.3.2006 COM(2006) 129 final. Brussels: European Commission. Retrieved from http://eur-lex.europa.eu/LexUriServ/LexUriServ.do?uri=COM:2006:0129:FIN:EN :PDF
[8] FEDEA. (2010). Informe junio 2010, ¿Vamos en la buena dirección?
Retrieved from
http://www.crisis09.es/redes/PDF/observatorio_fedea_redes_jun10.pdf [9] Feijoo, C., & Gómez-Barroso, J.-L. (2010). A prospective analysis of the
deployment of next generation access networks: looking for the limits of market action. The case of Spain. : NEREC 2010
[10] Forge, S., Blackman, C., & Bohlin, E. (2005). The demand for future mobile communications markets and services in Europe EUR 21673 EN: Institute for Prospective Technological Studies - JRC - EC. Retrieved from http://ftp.jrc.es/eur21673en.pdf
[11] IGN. (2000). Nomenclatura del Corine Land Cover al nivel 5º (CLC90) (Publication., from Instituto Geográfico Nacional. Centro Nacional de Información Geográfica. Ministerio de Fomento http://www.fomento.es/NR/rdonlyres/3b000ea0-4d79-47c9-9bb1-ad6e724396e3/3141/010416Nomenclatura90.doc
[12] INE. (2004). Censo nacional de población y viviendas 2001 (Publication., from Instituto Nacional de Estadística: http://www.ine.es/jaxi/menu.do?type=pcaxis&path=%2Ft20%2Fe242&f ile=inebase&L=
[13] INE. (2009). Directorio central de empresas 2009 (Publication., from
Instituto Nacional de Estadística:
http://www.ine.es/jaxi/menu.do?type=pcaxis&path=%2Ft37%2Fp201&f ile=inebase&L=0
[14] Ministerio de Vivienda. (2007). Atlas estadístico de las áreas urbanas 2006 (Publication., from Dirección General de Suelo y Políticas Urbanas, Secretaría de Vivienda, Ministerio de Vivienda de España: http://siu.vivienda.es/portal/index.php?view=article&catid=19%3Aatlas- digital-de-las-reas-urbanas&id=57%3Aatlas-estadistico-de-las-areas-urbanas-2006&option=com_content&Itemid=73&lang=es
[15] Siciliani, P. (2010). Access regulation on NGA - A financial, market-led solution to bridge the gap between US and European diverging regulatory approaches. Telecommunications Policy, 34(5-6), 287-298.
ANNEX 1 – DEMOGRAPHIC DATA
TABLE VII. SUMMARY OF DEMOGRAPHIC DATA FOR SPAIN (2001 FOR POPULATION AND HOUSEHOLDS,2009 FOR BUSINESSES).SOURCE:INE(2004,2009)
Zone I II III IV V VI VII VIII IX X
Total Population density >10 000 hab/km2 10- 5 000 hab/km2 5 - 3 000 hab/km2 3 - 1 000 hab/km2 1 000 - 500 hab/km2 500 - 100 hab/km2 100 - 50 hab/km2 50 - 10 hab/km2 10 - 5 hab/km2 < 5 hab/km2 Number of municipalities 17 28 46 175 209 946 745 2705 1444 1797 8112 Total population 2 707 360 6 300 119 3 832 203 8 596 709 5 016 333 11 326 891 3 574 008 4 406 394 668 735 317 055 46 745 807 Population per municipality 159 256 225 004 83 309 49 124 24 002 11 973 4 797 1 628 463 176 5 763 % of national population 5,79 % 13,48 % 8,20 % 18,39 % 10,73 % 24,23 % 7,65 % 9,43 % 1,43 % 0,67 % 100 % % of national population (accumulated) 5,79 % 19,27 % 27,47% 45,86 % 56,59 % 80,82 % 88,47 % 97,90 % 99,33 % 100 % 100 % Total surface (km2) 179,14 1 086,33 969,99 5 278,55 7 103,38 50 561,39 52 638,58 185 348,40 92 937,96 108 573,47 504 677,19
Surface per municipality 10,54 38,80 21,09 30,16 33,99 53,45 70,66 68,52 64,36 60,42 62,21
% of national surface 0,04 % 0,22 % 0,19 % 1,05 % 1,41 % 10,02 % 10,43 % 36,73 % 18,42 % 21,49% 100 % % of national surface (accumulated) 0,04 % 0,26 % 0,45 % 1,50 % 2,91 % 12,93 % 23,36 % 60,09 % 78,51 % 100 % 100 % Population density (inh/km2) 15 113 5 799 3 951 1 629 706 224 67,9 23,8 7,20 2,92 92,63 Number of buildings 150.991 349.457 292.268 1.001.308 768.534 2.546.655 1.195.033 2.088.085 517.713 374.469 9 284 513
Inhabitants per bulding 17,93 18,03 13,11 8,59 6,53 4,45 2,99 2,11 1,29 0,85 5,03
Buildings density
(b/km2) 842,87 321,69 301,31 189,69 108,19 50,37 22,70 11,27 5,57 3,45 18,40
Number of households 956.677 2.076.924 1.170.050 2.509.817 1.406.991 3.106.774 1.056.207 1.486.870 273.065 143.794 14.187.169 Persons per householda
2,63 2,74 2,95 2,88 2,91 2,96 2,93 2,78 2,55 2,37 2,85
Number of businessesb
247.676 536.081 311.978 709.653 400.875 880.898 270.780 330.552 50.376 24.361 3.763.229 Number of households
and businesses (nuser)
1.204.353 2.613.005 1.482.028 3.219.470 1.807.866 3.987.672 1.326.987 1.817.422 323.441 168.155 17.950.398 Households and
businesses per building 7,82 7,34 4,96 3,14 2,29 1,53 1,08 0,85 0,61 0,44 1,89
Multi-dwelling units 110.542 236.055 146.786 395.617 254.702 678.233 274.232 383.016 72.718 49.757 2.601.658
% of total buildings 73% 68% 50% 39% 32% 27% 23% 18% 14% 13% 28%
Single-unit buildings 40.449 113.402 145.482 614.181 542.133 1.833.646 921.000 1.706.285 442.955 323.816 6.683.349
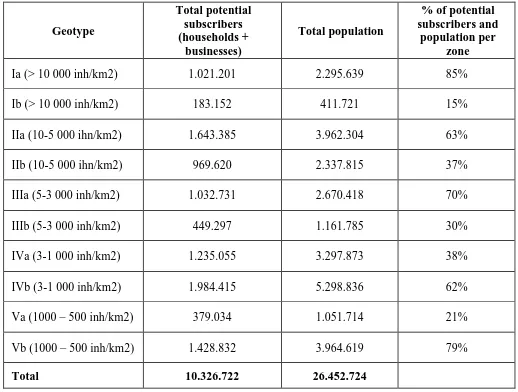
TABLE VIII. NUMBER OF POTENTIAL SUBSCRIBERS TO NGAN AS A FUNCTION OF GEOTYPE.SOURCE: OWN ESTIMATIONS FROM INE(2004,2009) AND MINISTERIO DE VIVIENDA (2007) Geotype Total potential subscribers (households + businesses) Total population % of potential subscribers and population per zone Ia (> 10 000 inh/km2) 1.021.201 2.295.639 85% Ib (> 10 000 inh/km2) 183.152 411.721 15% IIa (10-5 000 ihn/km2) 1.643.385 3.962.304 63% IIb (10-5 000 ihn/km2) 969.620 2.337.815 37% IIIa (5-3 000 inh/km2) 1.032.731 2.670.418 70% IIIb (5-3 000 inh/km2) 449.297 1.161.785 30% IVa (3-1 000 inh/km2) 1.235.055 3.297.873 38% IVb (3-1 000 inh/km2) 1.984.415 5.298.836 62% Va (1000 – 500 inh/km2) 379.034 1.051.714 21% Vb (1000 – 500 inh/km2) 1.428.832 3.964.619 79% Total 10.326.722 26.452.724
ANNEX 2 – COST CALCULATION ASSUMPTIONS
TABLE IX. NUMBER OF POTENTIAL USERS (PREMISES) PER ACCESS AREA, SPLITTER RATIO AND NUMBER OF FIBRES, DIVISION POINT, CABINETS AND DISTRIBUTION BOXES PER TYPE OF ZONE.SOURCE:
OWN ESTIMATIONS Zone Number of users per access area (narea) Minimum number of fibres at the exchange (nfibre) Total splitter ratio (rsplit =rsplit1 x rsplit2 ) Number of fibres at each A segment (nfibreA) Number of division points at A-B (ndivAB) Number of fibres at each B segment (nfibreB) Number of cabinets (ncab) Number of fibres at each C segment (nfibreC) Number of division points at C-D (ndivCD) Number of fibres at each D segment (nfibreD) Number of distribution boxes (nbox) I (> 10 000
inh/km2) 16384 256 8x8 96 (min 64) 4 16 (min 8) 32 96 (min 64) 32 16 (min 6) 342
II (10-5 000
ihn/km2) 16384 256 8x8 96 (min 64) 4 16 (min 8) 32 96 (min 64) 32 16 (min 6) 342
III (5-3 000
inh/km2) 16384 256 8x8 96 (min 64) 4 16 (min 8) 32 96 (min 64) 32 16 (min 6) 342
IV (3-1 000
inh/km2) 16384 256 8x8 96 (min 64) 4 16 (min 8) 32 96 (min 64) 32 16 (min 6) 342
V (1000 – 500
inh/km2) 16384 256 8x8 96 (min 64) 4 16 (min 8) 32 96 (min 64) 32 16 (min 6) 342
TABLE X. NUMBER OF POTENTIAL SUBSCRIBERS FOR NEW CABLE NETWORK BUILT IN
COMPARISON WITH TOTAL POTENTIAL POPULATION.
Geotype Total potential subscribers (households + businesses) %of potential subscribers covered with cable network Potential subscribers for new cable network built Ia (> 10 000 inh/km2) 1.021.201 37% 643.35 Ib (> 10 000 inh/km2) 183.152 41% 108.060 IIa (10-5 000 ihn/km2) 1.643.385 53% 772.391 IIb (10-5 000 ihn/km2) 969.620 41% 575.794 IIIa (5-3 000 inh/km2) 1.032.731 55% 464.729 IIIb (5-3 000 inh/km2) 449.297 37% 283.057 IVa (3-1 000 inh/km2) 1.235.055 56% 543.424 IVb (3-1 000 inh/km2) 1.984.415 55% 892.987 Va (1000 – 500
TABLE XI. FRACTION OF PREMISES IN MULTI-DWELLING UNITS AND AVERAGE NUMBER OF
PREMISES PER BUILDING AS A FUNCTION OF THE GEOTYPE.SOURCE: OWN ESTIMATIONS
Geotypes Fraction of premises in multi-dwelling units (frmdw) Average premises per building Ia (> 10 000 inh/km2) 90 8,58 Ib (> 10 000 inh/km2) 80 9,52 IIa (10-5 000 ihn/km2) 80 8,92 IIb (10-5 000 ihn/km2) 70 10,05 IIIa (5-3 000 inh/km2) 70 6,66 IIIb (5-3 000 inh/km2) 60 7,60 IVa (3-1 000 inh/km2) 60 4,56 IVb (3-1 000 inh/km2) 50 5,28 Va (1000 – 500 inh/km2) 50 3,59 Vb (1000 – 500 inh/km2) 40 4,24
TABLE XII. .LIST OF ACRONYMS AND SYMBOLS REPRESENTED IN FORMULAS (1) TO (9) Acronyms Definition & Comments
EQUIPMENT AND OUTSIDE PLANT COST CM-CMTS M-CMTS Modular DOCSIS 3.0
headend architecture in primary node CEdquam DOCSIS Edge QUAM modulator for DOCSIS
DS Channels in Modular CMTS architecture
CEdquam VOD & BTV
Edge QUAM modulator for VOD or BTV, up to 144 Channels for Video on demand and Broadcast TV services, capacity is excepted to be increased significantly in coming years CODF Optical Distribution Frame (ODF) at
Primary Node in HFC networks C RF comb RF combiner/splitter .- HFC
Combination
CNPOT Power distribution node supply & installation, main power source for outdoor cabinets
CcabNS Cabinet in Secondary node (NS), the primary coax distribution point integrating HFC O/E BONT, ODF, and power node
CCPower NS Power node integrated in secondary node Cabinet
CFibre 256 Fibre cable in NS rings, and 16 Fibers in NS to NT connection D1 Distance between Primary node and
SN
D2 Distance between NS and NT D3 Final Cable from NT / NS to end users,
average distance < 500 mts Ccivilwork- Civil work from duct deployment,
average of conventional trenching and microtrenching. For any technology CcabNT Cabinet in terminal node (NT) the
primary coax distribution point that support HFC O/E BONT, ODF, and power node for NT
CCPower NT Power node integrated terminal node (NT) Cabinet
Ccinst Cable installation, of any type of cable and any type of duct and aerial installations. For any technology Cfibre NT Fibre cable of 16 FO
CCivilW Civil Work previous of cable and duct and aerial installations
Acronyms Definition & Comments
C_coax QR540 Coax Cable QR540 in mts, last mille coax cable first segment
C_coax Cable RG6 Coax Cable RG6 in mts, distribution last segment of last mille
C_AMPLI Number of HFC Coax Amplification in last mile
C_TAP2 Number of outdoor CATV sub-trunk 2-way taps , are used in last mille Drop, so highly needed in cable networks C_TAP4 Number of outdoor CATV sub-trunk
4-way taps
C_TAP8 Number of outdoor CATV sub-trunk 8-way taps
OPERATIONAL COST
Cdrop Installation of final drop Per user. Incurred only when a customer takes a service. Includes the faceplate at subscriber premises. For any technology
Cchurn Migration due to churn Average value per churned user. It could vary as a function of the access point /
unbundling possibilities (at exchange, at cabinet or at distribution box). Includes internal and external migration costs. For any technology
CMTS_pow Power consumption at exchange. Considers the average of a fixed and a variable per KWh charge
Cnets Network support. Per user
Cgens General support. Per user
Cgenm General management.Per user
Ccbill Finance and billing. Per user
Cbad Bad debts and other costs. Per user
Cprov Provision / maintenance costs. Per user
CCPE Customer Premises Equipment (CPE). Per user. Including modem, routing and wireless hub. Cost per 5 years.