TítuloFoci of orientation plasticity in visual cortex
9
0
0
Texto completo
(2) Figure 1. Adaptation-induced plasticity of orientation tuning and the orientation architecture of V1. a, Composite orientation map obtained by intrinsic signal imaging. The angle of preferred orientation of each pixel is shown according to the colour key (top). The map was smoothed using a low-pass filter (5 5 pixels). Circles indicate the location of seven representative neurons (out of 40 recorded) to illustrate the range of orientation and gradient distributions. b, Vascular pattern of the cortical surface for the region shown in a. c, Orientation gradient map in which gradient was distinguished into the following ranges: red (0.66–1), green (0.33–0.66) and blue (<0.33). A, anterior; L, lateral; M, medial; R, posterior. d–f, Orientation tuning curves of three representative cells during control, adaptation and recovery conditions. The control optimal orientation is represented as 0°, and all subsequent tuning curves (during adaptation and recovery) are represented relative to the control condition. The adapting orientation is indicated by the green arrow. Each point in panels d, e and f represents mean value s.e.m.. It has been shown14, 17, 18 that even brief periods of adaptation (lasting for a fraction of a second to a few seconds) can induce consistent changes in orientation selectivity and response magnitude of V1 neurons. For this study, we chose adaptation of 2-min duration to induce large shifts in orientation and response. Figure 1d–f demonstrates the relationship between location within the orientation map and adaptation-induced plasticity of orientation tuning for representative neurons. Adaptation to a given orientation induces a repulsive shift in orientation preference away from the adapting stimulus. Notably, the higher the value of the orientation gradient at the recording site, the larger is the magnitude of the shift in preferred orientation. Figure 2 characterizes the plasticity of orientation tuning for a population of 118 V1 neurons (26, 52 and 40 cells in 3 animals). The proportion of cells showing significant shifts in preferred orientation increases as the orientation gradient increases. Figure 2a shows that 88% of the cells located at regions of the highest orientation gradient (>0.75) exhibit significant repulsive shifts after adaptation (P < 0.05, Student's t-test; on the basis of a trial-by-trial comparison between control and adaptation conditions). In contrast, 12% of the cells located in the lowest gradient areas show a significant shift in orientation preference. Figure 2b shows that the magnitude of the shift in optimal orientation is a monotonic function of the orientation gradient at each recording location (correlation coefficient r = 0.6, P < 0.00005, Pearson test; positive shifts are shown as repulsive with respect to the adapting orientation)..
(3) Figure 2. Population analysis of adaptation-induced orientation plasticity. a, Fraction of cells in discrete orientation gradient ranges showing significant shifts in orientation preference after adaptation. b, Scatter plot (n = 118 cells) showing magnitude of the postadaptation shift in preferred orientation (positive and negative numbers indicate repulsive and attractive shifts, respectively) as a function of the orientation gradient at the recording site. Cells that show significant shifts in preferred orientation on the basis of a trial-by-trial comparison during adaptation and control conditions are indicated in black (P < 0.05); those that do not show significant shifts are indicated in grey (P > 0.05). The line represents the linear regression fit for the black data points. Of these cells, 86% (43 of 50 cells) recovered their control orientation preference (P > 0.05, Student's t-test; comparing preferred orientations during control and after recovery). c, Scatter plot of the absolute difference ( ) between the adapting orientation and the control preferred orientation as a function of orientation gradient at the recording site. d, Mean shift magnitude in orientation gradient bins for low and high ( < 45° and > 45°). Error bars indicate s.e.m.. As neurons in pinwheel centres are located in close proximity to neurons of all orientations, we reasoned that, close to these centres, pronounced changes in orientation tuning could be induced after adaptation to a broad range of orientations. We studied cells in all gradient regions with a wide range of orientation differences between the cell's optimal orientation and that of the adapting stimulus ( )—the values were statistically independent of the orientation gradient values (r = 0.049, P > 0.1). Cells located at high gradient regions exhibited significant shifts in preferred orientation for a broader range of compared with cells in low-gradient domains (Fig. 2c). The magnitude of the shift in preferred (>45°), the orientation shift is orientation is smaller as increases14; here we show that for large smaller in all the gradient regions (Fig. 2d). It is possible that the larger changes in orientation tuning observed at the high-gradient recording sites are due to inhomogeneities in the response properties of neurons across the cortical surface. For instance, higher firing rates or larger tuning bandwidths of neurons in regions of high orientation gradient could possibly cause larger shifts in orientation tuning. We therefore examined the relationship between the orientation gradient at each recording site and both the pre-adaptation peak firing rate and the orientation tuning width. We found that the peak response at the optimal orientation and the orientation tuning width (estimated by calculating the orientation selectivity index (OSI); see Methods) of the neurons in our population are not correlated with the orientation gradient (peak response correlation coefficient r = 0.09; OSI correlation coefficient r = -0.05; P > 0.1 for each comparison); thus these properties are homogeneously represented across the cortical surface (see also ref. 9)..
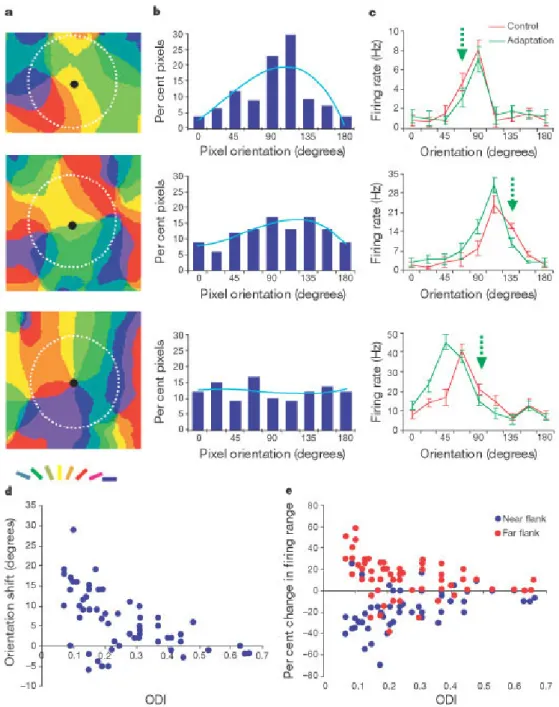
(4) To understand the differences in adaptation-induced orientation plasticity between pinwheel centres and iso-orientation domains, we examined quantitatively the relationship between the local orientation distribution at the recording site and the degree of plasticity. On the basis of anatomical and physiological data in V1 (refs 8, 19, 20, 21), we postulated that local excitatory and inhibitory inputs to cortical cells originate from within a radius of about 500 m around the cell body, and that adaptation is the result of integration of local inputs from a pool of neurons within this region. When the recording site is in the middle of an iso-orientation domain (Fig. 3a, top), neurons within a 500- m radius have a preponderance of orientation preferences similar to the recorded neuron (Fig. 3b, top), whereas when the recording site is near a pinwheel centre (Fig. 3a, bottom), local inputs arise from domains of all orientations (Fig. 3b, bottom). Neurons at intermediate locations have intermediate orientation distribution profiles (Fig. 3a–b, middle). The orientation distribution of inputs to a neuron is a qualitative predictor of the degree of change in its orientation preference. When it has a peaked profile, adaptation induces only small changes in orientation selectivity (Fig. 3c, top), whereas the orientation tuning curve undergoes a large change when the orientation distribution is flat (Fig. 3c, bottom). We quantified the orientation spread of inputs at different locations in the map by calculating an orientation distribution index (ODI), which is a measure of the orientation tuning strength of local inputs to the recorded cell (see Methods). We divided our population of neurons into different ranges, and show here the data from 59 neurons that were located at least 500 m from the imaged area borders and were studied with small (between 0–45°, for which orientation shifts are maximal (Fig. 2d); results from neurons with large are similar). We calculated the shift in preferred orientation and the change in firing rate on both flanks of the tuning curve as a function of the ODI at the recording site. Figure 3d shows an inverse relationship between the orientation shift magnitude and the ODI (r = -0.56, P < 0.001). Furthermore, as the orientation shifts are characterized by suppression14, 18 of responses on the flank of the tuning curve towards the adapting stimulus (near flank) and by facilitation14 of responses on the flank of the tuning curve away from the adapting stimulus (far flank), we examined how the structure of the orientation tuning curve changes depending on cortical location. Figure 3e shows that the magnitude of the changes in response on both flanks of the tuning curve is related to the ODI (near flank: r = 0.33; far flank: r = -0.34; P < 0.01 for each comparison). Thus, broader orientation distributions of intracortical inputs to V1 cells result in larger changes in orientation tuning and firing rate. Because low ODIs characterize mainly the neurons in high-gradient regions (correlation between orientation gradient and ODI, r = -0.5, P < 0.001), the foci of adaptation-induced orientation plasticity are closely related to the functional map of orientation preference in V1. As pinwheel centres are related to peaks of ocular dominance22, 23, our results may reflect a relationship between adaptation effects and monocular regions. We therefore recorded neurons of different eye preference located in targeted regions of the orientation map (Fig. 4a). A further 38 cells were first stimulated monocularly to determine their ocular dominance, followed by a full adaptation protocol using binocular stimulation. For each cell, we calculated an eye preference index as the absolute difference between responses to the preferred orientation measured independently for each eye, divided by the sum of optimal responses to each eye. Figure 4b shows that there is no significant correlation between the adaptation-induced change in preferred orientation and the eye preference index (r = 0.18, P > 0.1). Although the shift in orientation preference is correlated with the orientation gradient at the recording site (r = 0.41, P < 0.01), dividing the population of cells into two groups depending on the gradient magnitude also fails to yield a significant correlation with the eye preference index. However, as shown earlier (Fig. 2), the shift magnitude is larger for neurons located at higher gradient regions regardless of eye preference (P < 0.002, Student's t-test). Finally, of the population of 38 cells, 24 were studied with small (<45°). For these cells, we found a significant correlation between the shift magnitude and the orientation gradient (r = 0.52, P < 0.01), but no correlation between the shift magnitude and the eye preference index (r = 0.11, P > 0.1). Thus, the anisotropy in adaptation-induced plasticity of orientation tuning is unrelated to the ocular dominance of neurons..
(5) Figure 3. Relationship between local orientation distribution at the recording site and the degree of orientation plasticity. a, Three recording sites (filled circles) placed within an iso-orientation domain (top; gradient 0.06), between two pinwheel centres with input from neighbouring domains (middle; gradient 0.32), and in a pinwheel centre (bottom; gradient 0.64). The basin of local intracortical inputs is indicated by the white dotted circle (radius 500 m). b, The percentage of pixels at each orientation within 500 m of the recording site, after pooling the pixels into eight orientation bins between 0° and 180°. The light blue curve represents the best third-order polynomial fit to each histogram. c, Orientation tuning curves during control (blue) and adaptation (green) for the cells recorded at the locations shown in a. The adapting orientation is marked by the green arrow. Orientation shifts for the three cells after adaptation are: top (6.8°), middle (11.4°) and bottom (19°). Each graph represents mean values s.e.m. d, Scatter plot (n = 59 cells) showing magnitude of the post-adaptation shift in preferred orientation as a function of the orientation distribution index (ODI) at the recording site. e, Scatter plot (n = 59 cells) showing the change in firing rate of responses on the near and far flanks of the orientation tuning curve as a function of the ODI at the recording site..
(6) Figure 4. Relationship between eye preference and the degree of orientation plasticity. a, Orientation preference map; filled circles indicate the locations of representative targeted recording sites in one animal. b, Scatter plot (n = 38 cells) showing the magnitude of the post-adaptation shift in preferred orientation as a function of the eye preference index and orientation gradient at the recording site. Grey, gradient < 0.5; black, gradient > 0.5. Cells with an eye preference index of 0 are driven equally well by either eye, whereas those with an index of 1 are driven solely by one eye..
(7) The changes in orientation selectivity after adaptation reported here indicate a network mechanism that reorganizes responses across a broad range of orientations. At the level of single cells, hyperpolarization of neurons at or close to the adapting orientation (due to slow hyperpolarizing Ca2+and Na+-activated potassium channels25 or to synaptic depression26) can cause suppression of responses on the near flank of the tuning curve. Facilitation of responses on the far flank, however, requires d nhibition27 and possibly amplification by means of local excitatory interactions28 in the cortex. The strength of these effects, which determines the magnitude of the change in preferred orientation, depends on the location of neurons in the orientation map. Neurons in an iso-orientation domain would be only weakly activated by intracortical inputs with orientations that differ from the domain's preferred orientation, whereas neurons located at or near pinwheel centres would receive strong local inputs from neurons of all orientations. Therefore, altering the efficacy of these inputs through adaptation is likely to induce more profound changes in the orientation preference of neurons at or near pinwheel centres. This suggests that adaptation-induced orientation plasticity in V1 is an emergent property of a local cortical network overlaid on a non-uniform orientation map. These data indicate the existence of a map of orientation plasticity, closely related to the map of orientation preference, in which pinwheel centres constitute foci of plasticity and the orientation gradient is a measure of the degree of plasticity across V1. One question ar ng from this is whether there are similar plasticity maps related to other functional maps, such as those for eye preference, spatial frequency, or direction22, 23, 24. There are several functional roles of a map of orientation plasticity. The map would allow dynamic short-term influences on neuronal responses at some locations while retaining invariant responses at other locations that would maintain a stable frame of reference. Specifically, preferential locations for adaptive changes may be a strategy that the visual cortex uses in the face of adaptation to the statistics of natural images29 to prevent a global change in the orientation preference of visual cortical neurons. Methods Animals Adult cats were prepared for acute experiments according to protocols that were approved by MIT's Animal Care and Use Committee and conformed to NIH guidelines. Cranitomy followed by durotomy was performed to expose V1. Contact lenses were used to focus the eyes on a computer monitor. Optical imaging Techniques for intrinsic signal imaging were similar to those described6, 14. The orientation gradient map was obtained by applying a two-dimensional gradient operator to the orientation preference map. For each pixel, the spatial gradient was given by (dx2 + dy2), where dx = | x+1,y - x,y| and dy = | x,y+1 - x,y| ( x,y is the preferred orientation of pixel (x,y) in the composite map). Values of dx and dy greater than 90° were subtracted from 180°, such that the maximum difference in preferred orientation was 90°. We related the gradient value at the recording site to changes in the orientation tuning of neurons by calculating the local orientation gradient as the mean of gradient values in a 3 3 pixel array centred at the recording location. The gradient values were normalized for analysis. Electrophysiology Stimuli consisted of 16 drifting square-wave gratings at high contrast, presented at orientations 22.5° apart at two directions of movement (opposite directions orthogonal to stimulus orientation). Typical stimulus parameters for V1 were: spatial frequency 0.5 cycle per degree, temporal frequency 1 Hz. All stimuli were randomly interleaved. Stimuli were presented binocularly (except for determination of eye preference) and were shown to the animal on a 17-inch monitor positioned 30 cm in front of it. We recorded responses during three conditions: (1) before adaptation (control), when 16 drifting gratings were presented for 10 trials each for a total of 160 trials; (2) after 2 min of continuous adaptation to one grating of fixed orientation, when the 16 gratings presented for 7 trials each for a total of 112 trials were preceded by a 5-s 'topping-up' presentation of the adapting orientation to maintain the effects of previous adaptation; (3) after 10 min of recovery using a full-field uniform stimulus, when 16 gratings were presented in identical conditions as in the control condition. In all three conditions, the 16 gratings were presented for 2.5 s each. The full protocol, including control, adaptation and recovery periods, lasted about 2 h. To ensure stable recordings, individual cells were isolated using a spike-sort module (DataWave Technologies, v 5.0) that allowed the identification and discrimination of waveforms on the basis of their individual characteristics. We recorded at cortical depths between 300 and 800 m from cells with initial orientation preferences covering the entire orientation range (between 0 and 180°)..
(8) The preferred orientation of neurons was calculated as described30. The Fourier components were extracted for the orientation tuning curve and then normalized by dividing by the mean firing rate of the cell during stimulus presentation: a = n-1i=0R( i)cos(2 i); b = n-1i=0R( i)sin(2 i), where responses, R( i), are obtained for a set of n test orientations i, i = 0, 1 ... n - 1, which are uniformly distributed over 0 to 180°. Preferred orientation, , was calculated as = 0.5 arctan(b/a) if a > 0, or = 90 + 0.5 arctan(b/a) if a < 0. If a > 0 and b < 0, = 180 + 0.5 arctan (b/a). The OSI, which measures the strength of orientation tuning, was given by c(M-1), where c = (a2 + b2), and M is the mean response magnitude averaged over all orientations. The ODI used in Fig. 3d–e was identical to the OSI, except that the 'orientation responses' consisted of the percentage of pixels of orientation i around a recording site, pooled into eight orientation bins uniformly distributed over 0 to 180°. The Pearson test was used for all correlation comparisons. References 1. Gilbert, C. D. & Wiesel, T. N. Receptive field dynamics in adult primary visual cortex. Nature 356, 150-152 (1992). 2. Wang, X., Merzenich, M. M., Sameshima, K. & Jenkins, W. M. Remodelling of hand representation in adult cortex determined by timing of tactile stimulation. Nature 378, 71-75 (1995). 3. Fregnac, Y. & Shulz, D. E. Activity-dependent regulation of receptive field properties of cat area 17 by supervised Hebbian learning. J. Neurobiol. 41, 69-82 (1999). 4. Eysel, U. T. & Schweigart, G. Increased receptive field size in the surround of chronic lesions in the adult cat visual cortex. Cereb. Cortex 9, 101-109 (1999). 5. Hubel, D. H. & Wiesel, T. N. Sequence regularity and geometry of orientation columns in the monkey striate cortex. J. Comp. Neurol. 158, 267-293 (1974). 6. Bonhoeffer, T. & Grinvald, A. Iso-orientation domains in cat visual cortex are arranged in pinwheellike patterns. Nature 353, 429-431 (1991). 7. Blasdel, G. G. Differential imaging of ocular dominance and orientation selectivity in monkey striate cortex. J. Neurosci. 12, 3115-3138 (1992). 8. Das, A. & Gilbert, C. D. Topography of contextual modulations mediated by short-range interactions in primary visual cortex. Nature 399, 655-661 (1999). 9. Maldonado, P. E., Godecke, I., Gray, C. M. & Bonhoeffer, T. Orientation selectivity in pinwheel centers in cat striate cortex. Science 276, 1551-1555 (1997). 10. Hubel, D. H. & Wiesel, T. N. Receptive fields, binocular interaction and functional architecture in the cat's visual cortex. J. Physiol. 160, 106-154 (1962). 11. Reid, R. C. & Alonso, J. M. Specificity of monosynaptic connections from thalamus to visual cortex. Nature 378, 281-284 (1995). 12. Ferster, D., Chung, S. & Wheat, H. Orientation selectivity of thalamic input to simple cells of cat visual cortex. Nature 21, 249-252 (1996). 13. Somers, D. C., Nelson, S. B. & Sur, M. An emergent model of orientation selectivity in cat visual cortical simple cells. J. Neurosci. 15, 5448-5465 (1995). 14. Dragoi, V., Sharma, J. & Sur, M. Adaptation-induced plasticity of orientation tuning in adult visual cortex. Neuron 28, 287-298 (2000). 15. Hammond, P., Pomfrett, C. J. & Ahmed, B. Neural motion after-effects in the cat's striate cortex: orientation selectivity. V on Res. 29, 1671-1683 (1989). 16. Saul, A. B. & Cynader, M. S. Adaptation in single units in visual cortex: the tuning of aftereffects in the spatial domain. Vis. Neurosci. 2, 593-607 (1989). 17. Dragoi, V., Sharma, J., Miller, E. K. M. & Sur, M. Dynamics of orientation adaptation in awake monkey V1 revealed by reverse correlation. Soc. Neurosci. Abstr. 25, 1548 (1999). 18. Muller, J. R., Metha, A. B., Krauskopf, J. & Lennie, P. Rapid adaptation in visual cortex to the structure of images. Science 285, 1405-1408 (1999). 19. Hata, Y., Tsumoto, T., Sato, H. & Tamura, H. Horizontal interactions between visual cortical neurones studied by cross-correlation analysis in the cat. J. Physiol. 441, 593-614 (1991). 20. Weliky, M., Kandler, K., Fitzpatrick, D. & Katz, L. C. Patterns of excitation and inhibition evoked by horizontal connections in visual cortex share a common relationship to orientation columns. Neuron 15, 541-552 (1995)..
(9) 21. Kisvarday, Z. F., Toth, E., Rausch, M. & Eysel, U. T. Orientation-specific relationship between populations of excitatory and inhibitory lateral connections in the visual cortex of the cat. Cereb. Cortex 7, 605-618 (1997). 22. Crair, M. C., Ruthazer, E. S., Gillespie, D. C. & Stryker, M. P. Ocular dominance peaks at pinwheel center singularities of the orientation map in cat visual cortex. J. Neurophysiol. 77, 3381-3385 (1997). 23. Hubener, M., Shoham, D., Grinvald, A. & Bonhoeffer, T. Spatial relationships among three columnar systems in cat area 17. J. Neurosci. 17, 9270-9284 (1997). 24. Isa, N. P., Trepel, C. & Stryker, M. P. Spatial frequency maps in cat visual cortex. J. Neurosci. 20, 8504-8514 (2000). 25. Sanchez-Vives, M. V., Nowak, L. G. & McCormick, D. A. Membrane mechanisms underlying contrast adaptation in cat area 17 in vivo. J. Neurosci. 20, 4267-4285 (2000). 26. Abbott, L. F., Varela, J. A., Sen, K. & Nelson, S. B. Synaptic depression and cortical gain control. Science 275, 220-224 (1997). 27. Dragoi, V. & Sur, M. Dynamic properties of recurrent inhibition in primary visual cortex: contrast and orientation dependence of contextual effects. J. Neurophysiol. 83, 1019-1030 (2000). 28. Somers, D. C., Dragoi, V. & Sur, M. in Cerebral Cortex: The Cat Primary Visual Cortex. (eds Peters, A. & Payne, B.)(Academic, San Diego, in the press). 29. Coppola, D. M., Purves, H. R., McCoy, A. N. & Purves, D. The distribution of oriented contours in the real world. Proc. Natl Acad. Sci. USA 95, 4002-4006 (1998). 30. Wörgötter, F. & Eysel, U. T. Correlations between directional and orientational tuning of cells in cat striate cortex. Exp. Brain Res. 83, 665-669 (1991).. Acknowledgements We thank J. Schummers for discussions. This work was supported by a Merck Fellowship (V.D.) and by grants from the NIH (M.S.)..
(10)
Figure


Documento similar
As extensively reviewed elsewhere, phenotypic plasticity is being recognized in several tumour types, including breast and lung cancer, involving the acquisition of
GARCIA de JALON (1980) has studied the changes in stream benthic communities caused by the Pinilla reservoir in the Lozoya river (Central Spain), which is used for water
The assessment of the value of the filtration process was assayed for the nanoformulation and, although the results showed no significant changes in the particle size when using
17,18 Contrary to graphene, the band gap in ML-MDS separating the valence and conduction bands is naturally large and due to the absence of inversion symmetry in ML-MDS the
This very preliminary result, along with our results pointing to the fact that dynein functions dependent on dynactin were not needed either for basal transmission
This structure has led to the representation of the functional architecture of primary visual cortex in terms of maps from the cortical plane to the space of a given feature,
In this thesis, I have made an effort to improve our understanding of the behaviour of the vortex lattice in different materials, with different pinning landscapes and in a large
Figure 4B,C are images of the topography and profile, respectively, of the grating taken in shear force mode with an AFM tip mounted on a QTF fiber probe in buffer solution using
