This article was downloaded by: [151.47.31.239] On: 13 August 2014, At: 22:17
Publisher: Taylor & Francis
Informa Ltd Registered in England and Wales Registered Number: 1072954 Registered office: Mortimer House, 37-41 Mortimer Street, London W1T 3JH, UK
International Journal of Sustainable Transportation
Publication details, including instructions for authors and subscription information:
http://www.tandfonline.com/loi/ujst20
Modelling the Service Quality of Public Bicycle Schemes
Considering User Heterogeneity
Maria Bordagaray a , Luigi dell'Olio a , Ángel Ibeas a , Rosa Barreda a & Borja Alonso a
a
University of Cantabria , Santander , Cantabria , Spain Accepted author version posted online: 25 Jul 2014.
To cite this article: Maria Bordagaray , Luigi dell'Olio , Ángel Ibeas , Rosa Barreda & Borja Alonso (2014): Modelling the Service Quality of Public Bicycle Schemes Considering User Heterogeneity, International Journal of Sustainable Transportation, DOI: 10.1080/15568318.2013.838722
To link to this article: http://dx.doi.org/10.1080/15568318.2013.838722
Disclaimer: This is a version of an unedited manuscript that has been accepted for publication. As a service to authors and researchers we are providing this version of the accepted manuscript (AM). Copyediting, typesetting, and review of the resulting proof will be undertaken on this manuscript before final publication of the Version of Record (VoR). During production and pre-press, errors may be discovered which could affect the content, and all legal disclaimers that apply to the journal relate to this version also.
PLEASE SCROLL DOWN FOR ARTICLE
Taylor & Francis makes every effort to ensure the accuracy of all the information (the “Content”) contained in the publications on our platform. However, Taylor & Francis, our agents, and our licensors make no
representations or warranties whatsoever as to the accuracy, completeness, or suitability for any purpose of the Content. Any opinions and views expressed in this publication are the opinions and views of the authors, and are not the views of or endorsed by Taylor & Francis. The accuracy of the Content should not be relied upon and should be independently verified with primary sources of information. Taylor and Francis shall not be liable for any losses, actions, claims, proceedings, demands, costs, expenses, damages, and other liabilities whatsoever or howsoever caused arising directly or indirectly in connection with, in relation to or arising out of the use of the Content.
This article may be used for research, teaching, and private study purposes. Any substantial or systematic reproduction, redistribution, reselling, loan, sub-licensing, systematic supply, or distribution in any
form to anyone is expressly forbidden. Terms & Conditions of access and use can be found at http:// www.tandfonline.com/page/terms-and-conditions
ACCEPTED MANUSCRIPT
Modelling the Service Quality of Public Bicycle Schemes Considering User Heterogeneity
Maria Bordagaray1, Luigi dell’Olio1, Ángel Ibeas1, Rosa Barreda1, Borja Alonso1
1University of Cantabria,Santander, Cantabria, Spain
Corresponding author. E-mail address: delloliol@unican.es ,Telephone: +34942202262 Fax: +34942201703
Abstract
This article proposes a methodology for studying the quality of service perceived by users of a public bicycle scheme. The public are involved from the first phases of the research through their presence in focus groups to identify the relevant variables asked about in the survey. Ordered probit models have been calibrated which consider systematic variations in preference and random parameters. The results highlight the importance of safety and available information above other service variables, as well as the adjustment in perception of overall quality after considering each of the
characteristics of the service, as it is proposed in this methodology.
KEYWORDS: Quality, Focus Group, Public bicycles, Ordered probit, Heterogeneity
1. PROMOTING SUSTAINABLE MOBILITY PATTERNS: PUBLIC BICYCLE SCHEMES
ACCEPTED MANUSCRIPT
The excessive use of private cars is causing many urban areas to suffer from problems such as congestion, and noise and air pollution, which are not only unsustainable and harmful to the environment, but they also have a direct negative effect on the
population’s health. Further progress must be made towards new and more
environmentally friendly urban mobility practices which will avoid the damage and inconvenience generated by existing traffic rates. In order to achieve this goal, a multimodal framework comprised of a wider range of alternative modes of transport is agreed to help promote sustainable mobility: “Sustainable mobility has a central role to
play in the future of sustainable cities, but it is only through the understanding and acceptance by the people that it will succeed” (Banister, 2008).
The bicycle’s specific competitive characteristics under certain journey conditions, coupled with its guarantee of sustainability, makes it the leading transport mode in the change towards new mobility patterns. One of the most widespread strategies for
promoting this mode of transport in urban areas is the setting up of public bicycle sharing schemes. The demand for this alternative form of public transport has shown growth in many cities, and it becomes essential to efficiently adapt these systems to the
requirements of their users.
This research provides further knowledge on traveller behaviour and it is specifically aimed at understanding how users perceive the quality of bicycle sharing systems. The ordered scale defined to mark the quality of the overall service and its attributes suitably
ACCEPTED MANUSCRIPT
The results of the model show the aspects that should be prioritised to generate the highest impact on user satisfaction and, thus, encourage use of the public bicycle service. Furthermore, the existence of heterogeneity has been addressed by allowing the
parameters to distribute randomly across the population and by including the systematic variations in the perception of quality caused by different socioeconomic and trip circumstances. The trustworthiness of the models resides in the important role given to the users and potential users of the system, who have taken part from the initial
experimental design and data collection phases.
Section 2 reviews the international scientific literature addressing the bicycle as a mode of transport and the modelling of quality provided by public transport services. Section 3 describes the methodology, which is comprised of several consecutive phases: the first steps focus on determining the situation and concerns around this particular transit system to ensure the suitability and quality of the data that is used in the last stages to calibrate the discrete choice models. Section 4 presents the results of the practical application, including the relevant variables, the management of the survey data and the calibrated models. A discussion about the results of the modelling is presented in section 5, and finally, section 6 contains the most important conclusions drawn from this research.
2. PREVIOUS CONTRIBUTIONS TO THE INTERNATIONAL LITERATURE
The scientific community has been working on defining the conditions that more efficiently lead to citizens’ shift to more sustainable mobility patterns. The bicycle is a mode of transport that has been extensively analysed from many diverse angles over
ACCEPTED MANUSCRIPT
recent decades. The promotion of this alternative requires knowledge about user behaviour in relation to the factors that traveller’s consider when deciding to travel by bicycle (Pucher and Buehler, 2008; Xing et al., 2010; Ngoduy et al., 2013).
There are specific profiles of people whose behaviour with respect to the bicycle has been addressed in detail: commuters and women. On the one hand, the commuters represent an interesting study group due to the high number of journeys they make going to and from their work places and the particular requirements of this type of journey. This explains why certain research has specifically focused on determining the influential variables on mobility patterns related to trips to work (Wardman et al., 2007; Gatersleben, and
Appleton, 2007; Heinen and Handy, 2012). On the other hand, the preferences of women with respect to the bicycle have been researched by Bernhoft and Carstensen (2008), and Garrard et al. (2008). The double viewpoint of Bonham and Wilson (2012) is interesting; they studied the factors that influence women to both start and stop cycling. Akar et al. (2013) discovered the different demands of men and women with reference to safety and feasibility. Safety is a factor which is generally perceived to have a close relationship with the availability of specific bicycle infrastructure. This aspect has shown to have an important effect on women’s behaviour (Garrard et al., 2008; Akar et al., 2013), but also in general among the population. In fact, the literature has highlighted infrastructure as one of the decisive factors in the promotion of the bicycle as a mode of transport (Dill and Carr, 2003; Akar and Clifton, 2009; Dill, 2009). However, the installation of such infrastructure requires the use of economic resources meaning that their design needs to
ACCEPTED MANUSCRIPT
The suitability of the bicycle as a complementary mode to the railway was highlighted by Reploge (1993) and Rietveld (2000) and it is being considered when determining the optimum location of facilities, along with other aspects (Larsen et al., 2013).
In terms of bicycle rental systems, various authors have analysed journey patterns and flows depending on time of day and day of the week in particular towns or regions such as Lyon (Borgnat et al., 2011), Barcelona (Froehlich et al., 2008) and Paris (Nair et al., 2012). This information is interesting given that such systems respond to public demand and count on a limited number of bicycles and docking stations. The literature also
analyses aspects relative to the introduction of new for rent systems (Monzon et al., 2010; dell’Olio et al., 2011b). Several methodologies have also been proposed for calculating the number and location of these stations (Romero et al., 2012) as well as the routes between origin and destination pairs (Lin and Yang, 2011).
An analysis of the state of the art in the research of quality in transport leads to the conclusion that a large amount has already been done in this field. One line of work opts for the creation of quality indexes. Some authors have set up satisfaction and quality indexes from indicators associated with aspects related to diverse transport systems (Eboli and Mazzula, 2009; Del Castillo and Benitez, 2012), while others have introduced satisfaction data from surveys into regression models (Givoni and Rietveld, 2007). Debrezion et al. (2009) introduced a quality index based on data with specific transport characteristics such as time and distance into a hierarchical discrete choice model. In the
ACCEPTED MANUSCRIPT
latter two references the bicycle participates as an alternative mode of transport in the modal split models but it has scarcely been addressed from the quality point of view.
Another line of work is based on discrete choice models which have been shown to be suitable for research into transit system quality. Two approaches have therefore been proposed: Mixed Logit (ML) models based on Stated Preference (SP) surveys and Ordered Probit (OP) and Logit (OL) models calibrated with data collected by the Revealed Preferences (RP) technique. The first approach was used by Hensher (2001), Eboli and Mazzulla (2008, 2009), dell’Olio et al. (2011a), Cirillo et al. (2011). SP surveys test hypothetical conditions using previously defined quality standards in quantitative measures that vary across the scenarios presented to the individuals making their choice. However, data gathered from RP surveys provide the travellers’ behaviour based on the actual status of a transit system since the individuals are asked about their experience on their last trip. Since the dependent variable in Ordered models is specified on a discrete and ordered scale where the responses are correlated, representing different grades, this methodology can be rigorously adapted to the study of user perception of quality based on the actual performance of the service. Ordered models are applied by Hensher et al. (2010) and dell’Olio et al. (2010), for instance, but no applications have been found dealing with public bicycle systems.
Many of the previously mentioned studies have also taken into account the heterogeneity in the perception of quality. Discrete choice models, both Mixed Logit and Ordered,
ACCEPTED MANUSCRIPT
of unobserved heterogeneity. The former is achieved by introducing specific factors that may affect the perceptions (Hensher, 2001; dell’Olio et al., 2011a) and the latter by unrestricting the parameters allowing them to be randomly distributed across the
population (Hensher, 2001; Eboli and Mazzulla, 2008, 2009; Hensher et al., 2010; Cirillo et al., 2011). In this respect, the comparison of the effect of various distributions has been discussed in Hensher (2001) and Cirillo et al. (2011).
3. PHASES OF THE PROPOSED METHODOLOGY
The aim of this research is to characterise the quality perceived by users of a public bicycle hiring service, recently introduced in numerous Spanish towns and cities and generally of a similar nature to that found in the particular town being studied (Santander). Three points can be highlighted in the methodology followed in this research: the important role of the citizens involved in the first stages through their participation in focus groups and in the data collection procedure, the consideration of different causes of heterogeneity in preferences, and the application of the modelling to a recently installed public bicycle system. The different phases assure the reliability of the results and their inference to the overall population. This information is of great value for the efficient design of improvements to public bicycle systems which will result in a positive impact on the public’s perception of service quality.
Figure 1 shows the proposed methodology. Details about citizen involvement can be found in phases 2 and 3, following the bibliographic review (phase 1). The results from this process are used to address the sampling phases (phases 4, 5 and 6) and later proceed
ACCEPTED MANUSCRIPT
to the mathematical modelling of the perception of quality in the public bicycle service, thereby endowing a scientific nature on this research and contributing to our knowledge about public perceptions, sensitivity and willingness to use public bicycle services.
3.1 Literature And Citizen Involvement
The first step in the process of characterising cycling mobility consists of establishing the current state of scientific knowledge and the aspects that still need to be addressed. Therefore, phase 1 (Figure 1) includes a thorough bibliographic review of the most relevant work with the aim of finding the variables with the potential for influencing cycling mobility as well as analysing potential methodologies for application and/or innovation, in accordance with the objectives of this research.
The bibliographic review carried out in the first phase was used as the basis for the design of a series of guidelines which “led” the meetings (focus groups) held with the public bicycle users. Focus groups (FG) represent one of the main qualitative tools used in social research. Their usefulness has been widely demonstrated in evaluating new initiatives and developing questionnaires (Fern, 2001; Krueger and Casey, 2000; Newman, 2002; Patton, 2002). Research on a new service, such as the recently
introduced bicycle for rent systems, must not only evaluate previous work on the subject but Focus Group (FG) sessions should also be held to take into account user opinion from the very beginning of the process for the efficient design of survey questionnaires and to understand the political implications. “A focus group is a research method designed to
ACCEPTED MANUSCRIPT
populations” (Ward and Atkins, 2002). Krueger (1991) also defines a FG as a carefully
designed discussion to obtain perceptions about a particular field of interest (Ibeas et al., 2011). In order to conceptually determine a theoretical framework for defining a FG as accurately as possible an overview will be made of the various theories established by specialist authors in this field.
Focus groups are meetings made up of people with certain characteristics and interests in common; they provide qualitative data and information by participating in a discussion focused around a determined subject, in this case the demand of the cycling community for a public bicycle hiring service. These sessions correspond to Phase 3 (Figure 1) and represent the initial exploratory research of a qualitative nature aimed at determining the most relevant variables to be included in the pilot survey.
Two FG were held, one was made up of 8 frequent bicycle users and the other had 9 members who were not frequent users. The members of the first group were recruited randomly in the street, and the others were recruited through Santander neighbourhood associations.
All the participants were contacted by telephone and instructed to meet at the Transport Department of the University of Cantabria Civil Engineering School. They were
explained the reasons for the meeting followed by a brief presentation to explain the current state of affairs in Santander and the individual and collective benefits coming from bicycle use. All the discussions were recorded both on video and in sound.
ACCEPTED MANUSCRIPT
The guidelines established in phase two were put into practice in the focus groups. The sessions started by giving the members an exercise about how they perceived the public bicycle system in Santander in terms of its “quality”. At the end of this exercise the participants took part in a debate lasting about 45-60 minutes. Finally, an explanatory video was shown about bicycle use in other European or American cities: “Cycling Friendly Cities”. The exercise was closed with the observation of how the FG members reacted when they saw that there were other cities with similar geographical
characteristics to Santander where the citizens used the bicycle frequently (Ibeas et. al, 2011). The FG were also used to stimulate debate amongst the participants about sustainable modes of transport and, in particular, public bicycle for rent systems.
The knowledge acquired from the literature and the results of the focus groups provided the background for phase 4 (Figure 1) in which the pilot survey was designed. The design of the survey was defined by the goal of characterising the quality of service perceived by users of public bicycle systems. With this goal in mind a Revealed Preferences (RP) survey was proposed to study the current standards provided by the system. The interviews were held at the docking stations and asked to the cyclists returning the bicycle. The user is encouraged to score the standards of diverse aspects of the service they received on their most recent journey, in other words they were asked about real past experiences. After the pilot data was collected it needed to be analysed in the models so that any necessary changes could be made to assure the accuracy of the definitive survey (phase 6).
ACCEPTED MANUSCRIPT
The survey was divided into two parts in order to characterise both the users and their journey patterns as well as understand their behaviour. The first part of the survey provided the individual’s socioeconomic characteristics (Ortúzar and Willumsen, 2011) as well as data on origin and destination, journey purpose, frequency of journey and other data. The analysis of this data (phase 8) provides useful information about different types of service users and their characteristics which help explain the different perceptions or behaviour of the users. The second and last section of the survey provide the data
required in the following stages of the methodology to determine the influential variables on user perception of quality. The first and the last of these questions are actually the same one and refer to the overall quality perceived by the user. Each of these responses will be the dependent variable in two separate models. In between both responses, the interviewees are asked to evaluate the quality of the characteristics of the service, one by one. These ratings (the quality given to each attribute of the service) will be introduced as explanatory variables of the dependent one (the overall quality) in each model. This sampling experiment was studied by dell’Olio et al. (2010) in the city’s bus service, concluding that the overall quality of service is perceived differently by the user after having evaluated certain specific aspects than it was at the beginning of the survey. The potential for explaining the choice mechanisms occurring in these different moments during the survey is the reason why the perception of the system as a whole is asked twice: when the user rates the overall quality for the first time, several aspects influence their perception, whereas after the interviewer verbally names the characteristics making up the system and the user scores them individually, their perception changes. The
ACCEPTED MANUSCRIPT
following stages of the methodology determine this change and provide in-depth knowledge about user behaviour.
3.2 Theoretical Framework
Phase 9 deals with modelling the data collected in the definitive survey. This data is introduced into the mathematical structure which studies user behaviour and their perceptions. The disaggregate modelling (Ortúzar and Willumsen, 2011) and, specifically, the discrete choice models have proved their ability to explain choice
processes between alternatives; processes where each registered answer corresponds to an individual faced with a choice from a limited number of possibilities subjected to specific conditions and constraints.
These models are based on random utility theory, where the individual q chooses the alternative i which provides the most benefits or utility U , following the expression: iq
iq iq iq
U =V +ε (1)
Where the utility is made up of the terms: Viq, or systematic utility, and εq, random component represents the likes and dislikes of each person which are not explained in the group of attributes, as well as any possible mistakes made in measuring or during data collection, thereby endowing the model with realism. This leads to the conclusion that it is not possible to know user behaviour with absolute certainty and, therefore, we turn to calculating the probability that a specific individual will choose one of the available alternatives.
ACCEPTED MANUSCRIPT
The systematic utility Viq is explained by a set of variables which are affected by their corresponding coefficients in the following way:
·
iq ki kiq
k
V =
∑
θ X (2)Where X represents the value of the variable k of the alternative i for an individual q, kiq
and each parameter θki represents the weight placed on the variable k of the alternative i. In turn, these parameters rank the variables by importance within the utility, which in this case is the overall perception of quality.
The perceptions collected about the service quality and their attributes are qualitative by nature, with five possibilities ranging from “very bad” to “very good”. The model in this research is based on the specification proposed by McKelvey and Zavoina (1975), who defined the Ordered model as a latent regression adapted to ordinal outcomes. In this case study, the semantic and qualitative responses of the scale defining the overall service are converted into discrete but ordinal numeric values and introduced as the dependent variable following the expressions 3 and 4 below (Greene and Hensher, 2010):
[ ]
[ ]
(
)
[ ]
[ ]
* i i i i · ~ E ε | Var ε , E ε 0, Var ε 1 i ki i i i y =θ x +ε ε F = = , (3) * 1 yi = j if µj− <yi ≤µj (4)Where j represents each of the responses comprising the numeric scale. The expressions 3 and 4 imply that the unobservable, dependent and continuous variable, y* is transformed to an ordinal and discrete variable y that contains the observed responses. In the Ordered Probit model, the error term ε in (3) is assumed to be normally distributed. i
ACCEPTED MANUSCRIPT
The maximum likelihood method (ML) is applied to estimate the parameters θki and µ in discrete choice models. This method produces the most probable answer for each individual according to the responses given to the explanatory variables, the
socioeconomic characteristics and their mobility constraints.
The series of probability functions associated with each outcome j is given by the following expression:
[
i | i]
(
j ki· i) (
j 1 ki· i)
0, 0,1 , ,Prob y = j x =F µ θ− x −F µ − −θ x > j= … (5) J
The log likelihood is the logarithm of the probability expression in (5):
(
) (
1)
1 0 log n J ijlog j ki· i j ki· i i j L m F µ θ x F µ − θ x = = =∑∑
− − − (6)Where mij=1 if yi=j, and 0 in other cases.
In the case of the ordered model, µ is directly related to the probability, within the population, of choosing each specific choice score j on the ordered scale as the perceived quality.
The generalisation of the ordered models means that the parameters θki are not constants that have been estimated from the average of the collected data but rather they are random variables. This means that the coefficients of the different explanatory variables of the model are different from one individual to another, assuming variability in
preferences and possible correlation between variables.
ACCEPTED MANUSCRIPT
The random coefficients respond to the following definition:
* Γ
ki ki zi vki
θ =θ +∆ + (7) Where *
ki
θ is the average value of the parameter in the population and the systematic heterogeneity in the mean is induced by the variables zi which are normally
socioeconomic in nature or journey restrictions. The variability across the population in the perception of each explanatory variable k of the alternative i is taken into account through the unobservable random component vki, which will present the distribution
which best fits the existing heterogeneity.
The mean of the parameters for a specific individual characterised by zi is:
[
| ,]
*ki i i ki i
E θ x z =θ +∆z (8) The variance of the parameters is:
[
ki| ,i i]
ΓIΓ´ ΩVar θ x z = = (9)
Where Γ is the lower triangular matrix which introduces the correlation between the random parameters.
Similarly, in the Ordered model, the variability in the parameter thresholds µ may be studied taking different values for each individual.
In the Ordered model, the final conclusions about the choice mechanism are derived from the partial effects (Greene and Hensher, 2010), which report on the impact of a variable’s variation on the choice probability of a specific result of y (5). The values of these effects
ACCEPTED MANUSCRIPT
The estimated parameters do not report on the final result; they provide an overall vision about how users feel. The parameters are interpreted by using partial effects which are based on the probabilities of the choice model:
( )
(
)
(
) (
)
* 1 | · · i j i j ki i j ki i ki i Prob y j x x f x f x x δ =∂ = = µ − −θ − µ θ− θ ∂ (10)The partial effects report on the effect a variation in a variable has on the probability of a specific result of y. The values of these effects may be both positive and negative in accordance with an increase or a decrease in the probability of choosing each alternative
y.
The accumulated value of the partial effects of all the variables is also of interest:
(
)
(
)
*(
)
* 1 0 ( | ) · · · j i m ki i m ki i ki m ki i ki m i P y j x f x f x f x x = µ − θ µ θ θ µ θ θ ∂ ≤ = − − − = − − ∂∑
(11)4. PUBLIC BIKES IN SANTANDER: APPLICATION OF THE METHODOLOGY
The methodology conducted in this research has been put into practice in Santander (Spain), capital of the Autonomous Community of Cantabria, one of 17 in Spain and located on the north coast. Santander is a medium sized city, covering 36 km2 with a
population of about 200,000.
North-south mobility is restricted because the steep slopes (greater than 15o) of parallel hills and valleys running northeast to southwest meant few of the important city routes
ACCEPTED MANUSCRIPT
Public transport in Santander has historically been provided by a network of bus lines serving 97% of the municipal territory with bus stops located at less than 300 metres apart. Santander currently counts on a public bicycle service provided by a fleet of 200 bicycles distributed between 14 recently installed docking stations and with further plans for expansion. This service was conceived to work in tandem with the bus service but in competition with the private car with the aim of increasing the supply of public transport and extending its coverage.
The results of the focus group (FG) session, which is phase 3 of the methodology shown in Figure 1, are presented first. The participants agree that the service is, in general, known about by bicycle users, it counts on overall acceptance and is seen as a good initiative to encourage the use of the bicycle by the public. Nevertheless, the start of the service was limited in opening times and number of docking stations, meaning it wasn’t used as a mode of transport; rather it just encouraged bicycle use for leisure purposes.
The results show that, before the modifications were made to the service, users saw this hiring system as a pastime for the following reasons: the times it was available limited its use as a mode of transport, the “pick up and drop off points” were few and not suitable for using the bicycle as a mode of transport and there was too little cycling infrastructure. It was thought that the initial distribution of the docking stations favoured tourists rather than residents:
ACCEPTED MANUSCRIPT
“…the three “pick up and drop off points” are at tourist locations, they are no use to us, they are for tourists … who goes to work at the Piquío Gardens or the Magdalena Park? They are beach areas” “What’s more, there aren’t enough of them, there are only three…”
Users’ willingness to pay was viewed positively, at start-up the service was free although some members disagreed and thought that there should have been a minimum cost involved.
“…because it is free people don’t value it as they should …”, “…the service should have a cost, at least something symbolic which gives it a tangible value, that would make people use it in a more continuous way…”
The analysis of the FG session found out what the public thought about the improvements being made to the service (when they were just starting). Regarding the characteristics of the service, action needed to be taken such as setting up more docking stations and longer opening hours for using the service as well as solutions for topographical barriers (“…in Scandinavian countries there are special systems whereby you arrive with your bike, you hook it on and it takes the bike up the hill leaving you at the top”).
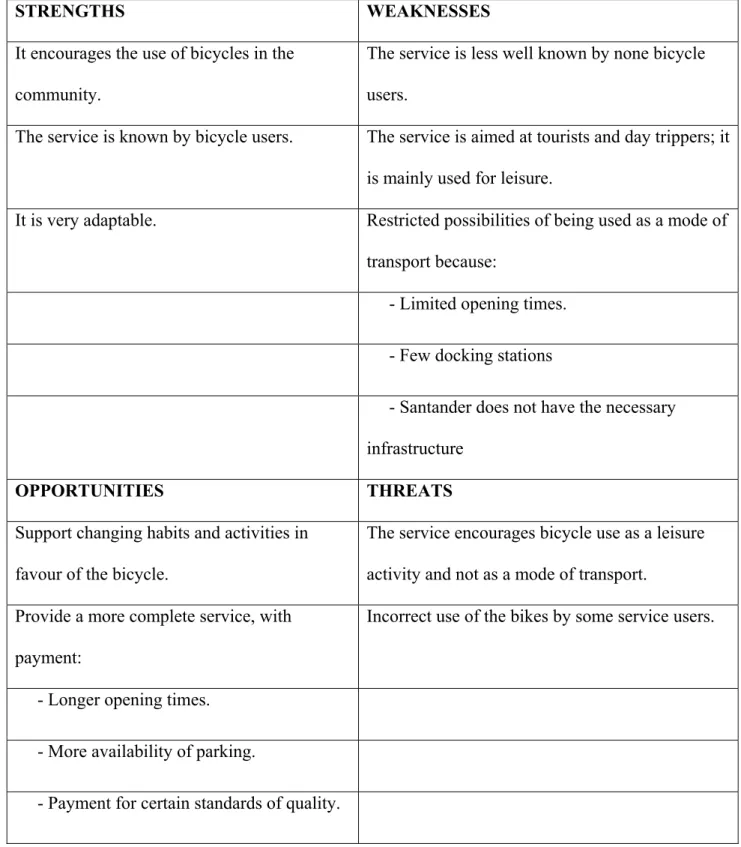
To summarise, this initiative at setting up a public bicycle hiring system has a whole series of pros and contras that have been arranged in the following SWOT matrix
ACCEPTED MANUSCRIPT
The participants in the FG considered that more docking stations should be installed at the entrances to the city, both for private car users and public transport users (park and ride installations at bus and train stations). In this respect, it is essential that more places to park bicycles are installed throughout the city at: shopping centres, financial and business districts, public services, education establishments, etc. Businesses should be encouraged and have incentives to provide their workers with good installations related to bicycle use (showers, secure parking areas, etc.). Suitable bike lanes also need to be built for accessing the city which are well signposted and exclusively for bicycle use. The members of the focus group affirmed that these changes would encourage modal change in favour of the bicycle with a corresponding reduction in private car use for making everyday trips.
As explained in the methodology, the ideas that arose in the focus groups were introduced into a pilot survey and the results were evaluated, modelled and corrected leading to the design of the final survey on perceived quality in a public bicycle hiring service. Taking into account the continued little use of the bicycle in Santander and the conclusion drawn for this city in Monzon et al. (2010) that the climate is one of the most important aspects influencing this mode of transport, the final survey was administered in July-August 2011 to users returning the bicycles to the docking stations. The sampling method used consists of surveying a ratio of users proportional to the demand at each station at different intervals of peak and off peak times. The questionnaire provided the following information: socioeconomic characteristics, origin, destination, journey purpose, frequency of journey, access, journey, and egress time, and ratings to evaluate
ACCEPTED MANUSCRIPT
the quality of the various attributes and the whole service. 195 interviews were used, with around 500 daily rentals in that period (considering all the uses, where many of them are made by the same users, on a trip chain basis).
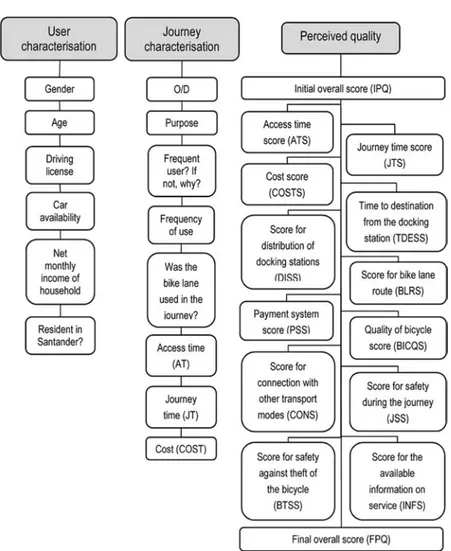
The results of the user and journey characterisations (Figure 2) are presented below and provide some very interesting information about the main uses of the service.
Improvement measures can, therefore, target attracting new types of customers or these insights may simply assist in deciding where to make improvements to increase the usage of current users.
The analysis of the collected data reveals that 51% of users are women and 49% are men. It is noteworthy that more than half of those surveyed (56%) are under 25 years old, 15% are between 35 and 44, 13% are aged 45 to 54, 12% from 55 to 64 and 4% are over 64 years old. While 85% confirmed that they had a driving license, only 67% had access to a private car. In terms of household income, 3% stated under 900€ per month, 17%
between 900 and 1,500€, 30% between 1,500 and 2,500€ and 23% replied their income was over 2,500€. However, 28% did not know or did not answer that question. 74% of the interviewees were residents in Santander. The journeys were mainly made for leisure (44%), 37% were travelling home, 1% for education, 3% for work, 2% for health
purposes, 3% for shopping and 11% were travelling for other reasons. The service is used on a daily basis by 42%, weekly by 31%, monthly by 2% and sometimes by 25% of the interviewees. Finally, regarding the use of the bike lane during the journey, 58% said
ACCEPTED MANUSCRIPT
they had used it, 9% said they had not used it and 33% said they had used it in certain sections (because it didn’t exist or they had taken an alternative route).
The data collected in the second part of the survey deal with the perceived quality of the public bicycle service and are used to calibrate the models. Users were asked to mark the overall quality of the service twice: at the beginning and at the end of the survey. Each of these scores are the data used in the dependent variable of one of the two separate models that will provide insights into the users’ perception in those two moments: the initial and the final perceived quality (IPQ and FPQ). The explanatory variables in both models are the ratings regarding the quality of the specific features of the public bike system. The outcomes of the modelling phases are therefore the consequence of the consecutive phases in the presented methodology.
The scale to mark the quality is semantically defined: Very bad; Bad; Not good, not bad; Good; Very good. An ordered and numeric scale has been used to analyse the data, going from 1 to 5. The average score turned out to be over 4, meaning that the quality of the service is perceived to be in between good and very good. The highest scores were given to the cost and the travel time and, on the contrary, the bike lane design and the quality of the bicycle itself received the poorest ratings.
After analysing the data, the next step in this research is the calibration of models (Figure 1). The variables that have been tested to explain the overall perception of quality are those collected in the survey (Figure 2): the scores given to the different attributes of the
ACCEPTED MANUSCRIPT
system have been introduced either on their own or as new variables regarding the interaction between them and the socioeconomic or journey characteristics.
A key consideration that has been taken into account in the discrete choice models presented in this research is the presence of heterogeneity in the perceptions. The causes of heterogeneity have been studied through both the variability in the perception across the population and the systematic variations in preference existing among users
characterised by a particular socioeconomic or trip circumstance. The former is achieved by unrestricting the parameters of the model by allowing them to distribute randomly across the population. Different distributions have been tested (normal, logarithmic, uniform, triangular) to represent the variation around the mean of the parameters affecting the explanatory variables. To consider the latter type of heterogeneity, the systematic variations in preference are introduced by the interaction between the score given to an attribute and a “dummy variable” representing whether or not each individual is characterised by the various socioeconomic aspects and trip conditions stated in the survey (Figure 2). The resulting interaction term is a new variable containing the
evaluation of the selected attribute, responded only by the group of users categorised by the socioeconomic feature. Very diverse causes of interaction have been tested
accounting for the profile features of each individual collected in the survey: gender, age, net monthly household income, residence in Santander, frequency of use of the service, trip purpose, use of the bike lane during the journey and whether a desire for more infrastructure has been stated, or for the improvement of the existing facilities.
ACCEPTED MANUSCRIPT
During the interview, users were also asked about quantitative aspects of their trip: the access time to the docking station, the travel time and the cost. As with any mode of transport making up an urban mobility system, it is helpful, even necessary, to know what influence these variables have on the travellers’ behaviour. They were not only
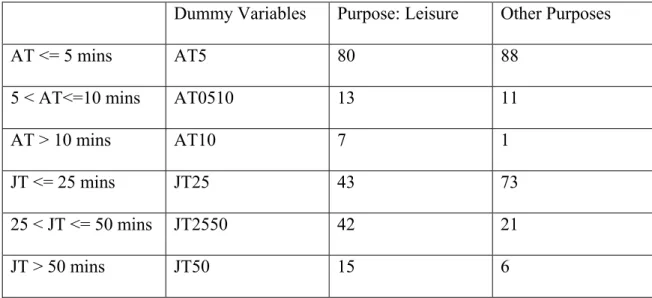
introduced into the models just as they were collected in the survey (AT, JT and COST), but also through the use of dummy variables characterising different time and cost ranges. In the latter case, each of these variables (access time, journey time and cost) was subdivided into three different categories so that the journey was characterised more specifically according to the purpose of the journey (given that 44% travelled for leisure purposes) in accordance with the classification presented in Table 2.
Table 2 shows the percentages dividing cyclists who make their journeys either for reasons of leisure or for any other purpose (home, education, work, health, shopping and other purposes) with respect to the categories in which access time (AT) and journey time (JT) have been defined. The cost of the service is defined by the type of ticket acquired by the user: day-ticket, week-ticket or annual ticket.
Each of the two different evaluations of the overall quality has been introduced in different models as the dependent variable. As a result, the first model (Table 3) shows the variables influencing the perception of the quality at the beginning of the interview (IPQ) and the second model (Table 4) presents the attributes explaining the overall score at the end of the interview (FPQ), after each user was asked to score the individual attributes making up the system.
ACCEPTED MANUSCRIPT
The variables that have resulted explanatory of the perceived quality are the following:
ATQ: Quality perceived regarding the access time
COSTQ: Quality perceived regarding the cost of the service BICQQ: Quality perceived regarding the quality of the bicycle PSQ: Quality perceived regarding the payment system
DISQ: Quality perceived regarding the distribution of the docking stations INFQ: Quality perceived regarding the available information
JSQ: Quality perceived regarding the journey safety
The dummy variables that lead to systematic variations in preference: AT5: Access time less or equal to 5 minutes
JT25: Journey time less or equal to 25 minutes G: Gender (female=1; male=0)
ESPP: Specific trip purpose (work, study, health care, shopping or other reasons) JT2550: Journey time from 25 to 50 minutes
AT10: Access time longer than 10 minutes Y: Young people (younger than 34 years old) M: Middle-aged users (34 to 54 years old)
For the models to be estimated, every alternative or available response of the ordinal
ACCEPTED MANUSCRIPT
similar share of responses for all the scores and, thereby, reproduce the reality. Given the small representation of the two lowest scores of the dependent variables (initial and final overall perceived quality), the models were calibrated by aggregating the “Very Bad” and “Bad” responses from the survey into a single category regarding negative perceptions.
5. DISCUSSION OF THE RESULTS
The parameters of the models explaining the initial (IPQ) and the final (FPQ) perceived quality of the public bike system are set out in Tables 3 and 4. The calibrated models inform about different sources of heterogeneity in the perception of the quality across the population of users.
To begin with, Table 3 shows that the initial overall evaluation is heterogeneously explained by the perception of the distribution of the docking stations (DISQ). However, the model determining the users’ perception of quality at the end of the survey (Table 4) reports on the presence of three attributes that heterogeneously explain the final valuation of the service: the distribution of the docking stations (DISQ), the perception of the access time (ATQ) and journey safety (JSQ). In all cases, the Normal distribution was found to yield the best fit of the parameter. The positive sign of the parameters needs to be assured so that the higher the system attributes are marked, the higher the value of the coefficients are. In the present research it also has to be noted that since all the
independent variables are defined on the same scale, a higher weight or value of a coefficient directly affecting a variable leads to a higher partial effect. The most important findings based on the obtained parameters are exhibited, followed by a
ACCEPTED MANUSCRIPT
presentation of the partial effects which quantify the impact that improvements made to diverse individual attributes have on the overall perception of quality.
The comparison of the two models reveals the adjustment in the perception before and after the characteristics of the service have been explicitly listed and rated: the quality mark given to the cost of the public bicycle service (COSTQ) only influences the overall quality perceived at the beginning of the interview (IPQ) (Table 3). On the other hand, there are two variables influencing the perception of service quality at the end of the interview which didn’t do so in the initial model: the satisfaction on the safety during the journey (JSQ) and the evaluation of the available information (INFQ) (Table 4).
Therefore, although initially the cost of the service is considered in the overall perception of the quality, once the individual service attributes have been thought about, the cost ceases to have any influence and other factors show to be of importance in the final evaluation of the overall service, factors which had not even been considered at the start of the interview.
The model also reveals the existence of systematic variations in preference, which are studied through the interaction variables created by multiplying different factors. The categories of users showing this systematic variation in variable perception are affected by both parameters: that of the variable itself and that of the interaction term. Therefore, when evaluating the overall service at the beginning of the interview (Table 3), the perception of those users that have experienced journey times of less than 25 minutes is
ACCEPTED MANUSCRIPT
Similarly, in the first model, those users whose journeys have been made for specific purposes (ESPP: work, education, health, shopping or other purposes) perceive the access time (ATQ) differently than the other users, who travel for leisure or to get home.
Considering the systematic variations in preference that have been found significant in the second model (Table 4), it is worth pointing out that, the access time is again not homogeneously perceived across the population: those users who perceive an access time of over 10 minutes (AT10) are not only affected by the parameter ATQ but also by AT10·
ATQ. Other systematic variations found in the model regarding the final valuation of the quality (Table 4) indicate the specific perception of the time accessing the station in the case that the trip lasts between 25 and 50 minutes (JT2550) and, the quality of the safety during the journey perceived by users younger than 34 years old (Y).
The same explanatory variables have been introduced into both the initial and final models, yielding the significant parameters in tables 3 and 4, in each case. The dependant variable of the IPQ model is the overall service quality scored at the start of the
interview, whereas in the FPQ model it is the quality score provided at the end of the interview. In the FPQ model, the parameters show a confidence level of greater than 99%. However, on the contrary, the coefficients of the IPQ model have a lower
significance and the loglikelihood value also indicates a poorer fit. The significance of the parameters indicates the possibility of transferring these results onto the overall population. As the quality perceived at the end of the interview (FPQ) is explained by more significant parameters, it is possible to state that the individual’s behaviour is known with greater precision in this case. For this reason, the partial effects of the FPQ
ACCEPTED MANUSCRIPT
model are analysed and discussed (Table 5). This uncovering of the difference between the overall service quality scores provided at the start and at the end of the interviews is interpreted as the effect of having previously considered the quality of each individual attribute before providing a final score for the overall service quality (dell’Olio et al., 2010).
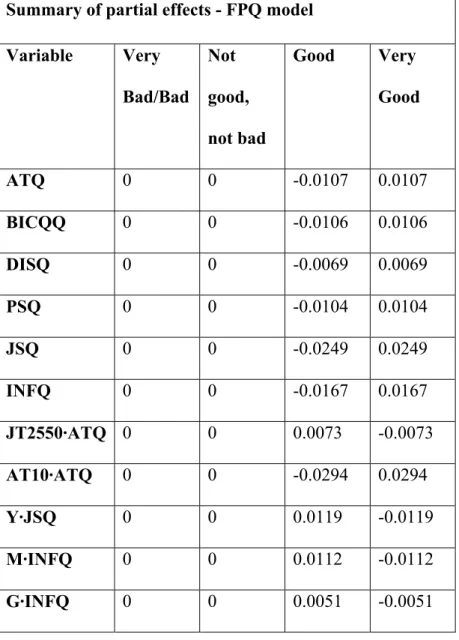
Therefore, the partial effects of the model explaining the final perceived quality (FPQ) are shown in Table 5. The partial effects quantify the unit increase or decrease (positive or negative sign) in the probability of choosing each response available in the scale (Very Bad/Bad; Not good, not bad; Good; Very Good) to score the overall quality as a result of a unit improvement on the satisfaction mark given to each influential variable. The scale defined to score quality, as well as the amplitude of the intervals determined by the parameters µ of the model (Table 4), affect the probability of choosing from Very bad or Bad, Not good, not bad, Good or Very good to score the overall service quality.
It is important to point out that the improvement of the performance of any of the attributes and, thus, the increase in satisfaction regarding that service characteristic will result in an increase in the maximum valuation (“Very Good”), as the partial effects shown in Table 5 reveal. Since the average score of the overall valuation turned out to be in between “Good” and “Very good”, any improvement accomplished in the system would result in an increased probability of a “Very good” response to rate the overall quality and, therefore, a similar reduction in the probability of perceiving the quality as
ACCEPTED MANUSCRIPT
As the coefficients suggest, the greatest impact results from a successful unit increase in the satisfaction regarding firstly, the safety during the journey (JSQ) and, secondly, the available information about the service (INFQ). Measures designed to achieve these improvements would cause an increased probability of 2.49% and 1.67% respectively, representing an accumulated increased probability of 4.16% of rating the service quality with the maximum score. After these two attributes, the greatest positive impacts on the perception of quality would come from actions directed at service improvements
regarding access time (1.07%), bicycle quality (1.06%), payment system (1.04%) and the distribution of docking stations across the city (0.69%).
Likewise, the partial effects accounting for the interactions should be added to the effect of the variable alone (in a similar way to the interpretation of the parameters). In this respect, it is worth pointing out that users with access times over 10 minutes (AT10) place much more importance on this aspect than the general population of users do, as can be confirmed by adding 2.94% (AT10·ATQ) to the 1.07% (ATQ) that for the general population increases the probability of responding with the highest score to rate the overall quality when that particular aspect (ATQ) is improved. Table 5 also shows that the user categories involved in the remaining interaction terms will experience a lower
positive impact compared to the expected effect on the general population’s perception. Such is the case of perceived quality in relation to access time for those users whose journeys last between 25 and 50 minutes (-0.73%), in the case of the valuation of the safety perceived during the journey by consumers aged under 35 (-1.19%), and among
ACCEPTED MANUSCRIPT
females (-0.51%) and users aged between 35 and 54 (-1.12%) regarding the quality relative to the available information about the service. The direction of these effects was previously revealed by the negative signs of their corresponding parameters (Table 4), which remove weight from the importance placed on the corresponding variables by the general population. In summary, the interactions indicate several circumstances under which the impact of the quality of some attributes on the overall quality systematically variates. The quality perceived regarding the access time has been found to be less important when the trip lasts between 25 and 50 minutes, whereas it has a higher impact on the overall quality when more than 10 minutes are required to access the nearest station. On the other hand, safety is less important among users younger than 35, and women and users aged between 35 and 54 tend to reduce the importance of the quality of the information provided about the service.
6. CONCLUSIONS
The bicycle clearly has to play an active part in the current search into more sustainable mobility systems. Numerous urban areas have introduced public bicycle systems as complementary to their existing supply of public transport. Aimed at improving the efficiency of managing this kind of service, this article proposes a process for evaluating the quality of service that users perceive they are experiencing from the actual
performance of the system. This research emphasises the importance of citizen involvement and the need to consider variability in perceptions in order to assure the realism of the results reported by the models on public bicycle user preferences. The
ACCEPTED MANUSCRIPT
Firstly, the proposed methodology involves the citizens from the very first phases to guarantee a reliable representation of reality during the modelling process. The collected data is the result of successive phases involved with identifying variables and survey design which have later been loaded into Ordered Probit models to understand the perception of quality of service as a function of the characteristics which define it.
Secondly, the modal split model of any town should include the corresponding explanatory perceived quality variable in the utility function of each alternative for a given mode, as the modelling developed in this research does for the “bicycle” alternative.
The scientific process described in this research can be applied to any town or city in a similar way to its application to Santander. The modelling provides interesting results on various aspects. Firstly, the research once again shows the difference in the perception of service quality before and after the interviewee has had time to reflect about and score different aspects of it. Variables such as safety during the journey and the available information go unmentioned in the initial evaluation of overall quality while they turn out to be of greatest weight at the end of the interview. The opposite occurs with the cost, with the highest a priori score, but which ceased to be of importance for the users after considering each and every characteristic of the service. This and the scarce presence of the level-of-service variables lead to the conclusion that this type of attribute has a certain influence on the perception of service quality, but they are not decisive. This could also
ACCEPTED MANUSCRIPT
be a result of the still low modal share of the bicycle within urban mobility as a whole and that its use is still mainly for recreational purposes.
The proposed models represent a tool which has great potential as an aid in the
management of public bicycle services because not only does it report on the different service variables and their degree of importance on quality, but it also provides
information on population variability and the systematic differences in perceptions resulting from different socioeconomic and journey characteristics. Heterogeneity in the population appears in the scores given for the distribution of bicycle docking stations while among the causes of systematic variation in the perceptions of different attributes are gender, age, purpose of journey, type of ticket purchased and the access and journey times. Specifically, access time presents the greatest weight for those users who feel it takes longer than 10 minutes to access the system. As a result, reflected in the
accumulated value of the corresponding partial effects, the improvement of this attribute is the one which generates the most noteworthy impact on the overall perception of quality among this group of users.
Finally, this article concludes by stressing the need to encourage users to evaluate each of the characteristics of a service to make their overall perception of quality more complete as, in this way the model is loaded with more realism. It is recommended that
improvements made to the service are disseminated to guarantee their maximum impact on the overall quality of service that users feel they are receiving.
ACCEPTED MANUSCRIPT
ACKNOWLEDGEMENTS
The authors would like to acknowledge the financial support provided by the Spanish Ministry of Economía y Competitividad in project TRA2010-18068.
REFERENCES
Akar G, Clifton KJ, 2009. Influence of individual perceptions and bicycle infrastructure on decision to bike. Transportation Research Record 2140, 165-172.
Akar G,Fischer N, Namgung M. 2013. Bicycling choice and gender case study: The ohio state university. International Journal of Sustainable Transportation 7(5)347-365.
Banister D. 2008. The sustainable mobility paradigm. Transport Policy 15(2)73-80. Bernhoft I M, Carstensen G. 2008. Preferences and behaviour of pedestrians and cyclists by age and gender. Transportation Research Part F: Traffic Psychology and Behaviour 11(2)83-95.
Bonham J, Wilson A. 2012. Bicycling and the life course: The start-stop-start experiences of women cycling. International Journal of Sustainable Transportation 6(4)195-213.
Borgnat P, Abry P, Flandrind P, RObardet C, Rouquier JB, Fleury E. 2011. Shared bicycles in a city: A signal processing and data analysis perspective. Advances in Complex Systems 14(3)415-438.
Cirillo C, Eboli L, Mazzulla G. 2011. On the Asymmetric User Perception of Transit Service Quality. International Journal of Sustainable Transportation 5(4)216-232.
ACCEPTED MANUSCRIPT
Debrezion G, Pels E, Rietveld P. 2009. Modelling the joint access mode and railway station choice. Transportation Research Part E: Logistics and Transportation
Review 45(1)270-283.
Del Castillo JM, Benitez FG, 2012. Determining a public transport satisfaction index from user surveys. Transportmetrica DOI:10.1080/18128602.2011.654139.
dell'Olio L, Ibeas A, Cecín P. 2010. Modelling user perception of bus transit quality. Transport Policy 17(6)388-397.
dell'Olio L, Ibeas A, Cecin P. 2011a. The quality of service desired by public transport users. Transport Policy 18(1)217-227.
dell'Olio L, Ibeas A, Moura J L. 2011b. Implementing bike-sharing systems. Proceedings of the Institution of Civil Engineers: Municipal Engineer 164(2)89-101.
Dill J, Carr T. 2003. Bicycle commuting and facilities in major U.S. cities: If you build them, commuters will use them. Transportation Research Record, 116-123.
Dill J. 2009. Bicycling for transportation and health: The role of infrastructure. Journal of Public Health Policy 30(SUPPL. 1), S95-S110.
Eboli L, Mazzulla G. 2008. Willingness -To-Pay of Public Transport Users for Improvement in Service Quality. European Transport 38,107-118.
Eboli L, Mazzulla G. 2009. A new customer satisfaction index for evaluating transit service quality. Journal of Public Transportation 12(3).
Fern E. F. 2001. Advanced focus group research. Thousand Oaks, CA: Sage Publications. Froehlich J, Neumann J, Oliver N. 2008. Measuring the Pulse of the City through Shared Bicycle Programs. UrbanSense08, Raleigh, NC, USA.
ACCEPTED MANUSCRIPT
Garrard J, Rose G, Lo S. K. 2008. Promoting transportation cycling for women: The role of bicycle infrastructure. Preventive Medicine 46(1)55-59.
Gatersleben B, Appleton K. M. 2007. Contemplating cycling to work: Attitudes and perceptions in different stages of change. Transportation Research Part A: Policy and Practice 41(4)302-312.
Givoni M, Rietveld P. 2007. The access journey to the railway station and its role in passengers' satisfaction with rail travel. Transport Policy 14(5)357-365.
Greene WH, Hensher D A. 2010. Modeling ordered choices: a primer. Nueva York:
Cambridge University Press.
Heinen E, Handy S. 2012. Similarities in attitudes and norms and the effect on bicycle commuting: Evidence from the bicycle cities davis and delft. International Journal of Sustainable Transportation 6(5)257-281.
Hensher DA. 2001. Service quality as a package: what does it mean to heterogeneous consumers. Proceedings of the 9th World Conference on Transport Research. Seoul,
Korea, 22-27 July.
Hensher DA, Mulley C, Yahya N. 2010. Passenger experience with quality-enhanced bus service: The tyne and wear 'superoute' services. Transportation 37(2)239-256.
Ibeas A, Dell'Olio L, Montequín R B. 2011. Citizen involvement in promoting sustainable mobility. Journal of Transport Geography 19(4)475-487.
Krueger RA. 1991. Focus groups: a practical guide for applied research. Beverly Hills,
California: Sage Publications.
Krueger R A, Casey MA. 2000. Focus groups, a practical guide for applied research (Third edition). Thousand Oaks, CA: Sage Publications.
ACCEPTED MANUSCRIPT
Larsen J, Patterson Z, El-Geneidy A. 2013. Build it. but where? the use of geographic information systems in identifying locations for new cycling infrastructure. International Journal of Sustainable Transportation 7(4)299-317.
Lin J.–R, Yang Ta-Hui T.-H. 2011. Strategic design of public bicycle sharing systems with service level constraints. Transportation Research Part E: Logistics and
Transportation Review 47(2)284-294.
McKelvey R, Zavoina W. 1975. A statistical model for the analysis of ordinal level dependent variables. Journal of Mathematical Sociology 4, 103-120.
Monzon A, Rondinella G. 2010. PROBiCI - Guia de la movilidad ciclista - Métodos y técnicas para el fomento de la bicicleta en áreas urbanas. Instituto para la diversificación y ahorro de la energía (IDAE) - Colegio ICCyP – Transyt. Madrid.
Nair R, Miller-Hooks E, Hampshire RC, Bušic A. 2012. Large-scale vehicle sharing systems: Analysis of vélib'. International Journal of Sustainable Transportation 7(1) 85-106.
Newman L C. 2002. Macroergonomic methods: interviews and focus groups.
Proceedings of the Human Factors and Ergonomics Society 46th Annual Meeting, 1355– 1359. Santa Monica, CA: Human Factors and Ergonomics Society.
Ngoduy D,Watling D,Timms P, Tight M. 2013. Dynamic bayesian belief network to model the development of walking and cycling schemes. International Journal of Sustainable Transportation 7(5)366-388.
Ortúzar JD, Willumsen LG. 2011. Modelling Transport, 4th edition. John Wiley and
Sons.
ACCEPTED MANUSCRIPT
Oaks, CA: Sage Publications.Pucher J, Buehler R. 2008. Making cycling irresistible: Lessons from the netherlands, denmark and germany. Transport Reviews 28(4)495-528.
Replogle M. 1993. Bicycle access to public transportation. learning from abroad. Transportation Research Record 75-80.
Rietveld P. 2000. Non-motorised modes in transport systems: A multimodal chain perspective for The Netherlands. Transportation Research Part D: Transport and Environment 5(1)31-36.
Romero JP, Ibeas A, Moura JL, Benavente J, Alonso B. 2012. A simulation-optimization approach to design efficient systems of bike-sharing. Procedia - Social and Behavioral Sciences 54(0)646-655.
Xing Y, Handy SL, Mokhtarian P L. 2010. Factors associated with proportions and miles of bicycling for transportation and recreation in six small US cities. Transportation
Research Part D: Transport and Environment 15(2)73-81.
Ward H, Atkins J. 2002. From their lives: a manual on how to conduct focus groups of low-income parents. University of Southern Maine.
Wardman M, Tight M, Page M. 2007. Factors influencing the propensity to cycle to work. Transportation Research Part A: Policy and Practice 41(4)339-350.
ACCEPTED MANUSCRIPT
Table 1. SWOT matrix on the use of public bicycles in Santander (Ibeas et al., 2011)
STRENGTHS WEAKNESSES
It encourages the use of bicycles in the community.
The service is less well known by none bicycle users.
The service is known by bicycle users. The service is aimed at tourists and day trippers; it is mainly used for leisure.
It is very adaptable. Restricted possibilities of being used as a mode of transport because:
- Limited opening times. - Few docking stations
- Santander does not have the necessary infrastructure
OPPORTUNITIES THREATS
Support changing habits and activities in favour of the bicycle.
The service encourages bicycle use as a leisure activity and not as a mode of transport.
Provide a more complete service, with payment:
Incorrect use of the bikes by some service users.
- Longer opening times. - More availability of parking. - Payment for certain standards of quality.
ACCEPTED MANUSCRIPT
Table 2. Percentage of users from each journey purpose as a function of access time (AT) and journey time (JT)
Dummy Variables Purpose: Leisure Other Purposes AT <= 5 mins AT5 80 88
5 < AT<=10 mins AT0510 13 11
AT > 10 mins AT10 7 1
JT <= 25 mins JT25 43 73 25 < JT <= 50 mins JT2550 42 21 JT > 50 mins JT50 15 6
ACCEPTED MANUSCRIPT
Table 3. Initial perceived quality estimation model
INITIAL PERCEIVED QUALITY (IPQ)
Variables Coefficient b/St.Er Non-random parameters Constant -1.19 -1.83 ATQ 0.04 0.23 COSTQ 1.25 4.93 BICQQ 0.32 2.24 PSQ 0.45 3.55 AT5·COSTQ -0.41 -2.68 JT25·BICQQ 0.56 3.92 G·COSTQ -0.19 -2.07 ESPP·ATQ 0.39 2.50
Means for random parameters
DISQ 0.71 5.17
Scale parameters for random parameters
DISQ 0.29 4.57
Threshold parameters for probabilities
MU(1) 1.56 3.38
ACCEPTED MANUSCRIPT
Number of observations 195 Log likelihood function -111.09
ACCEPTED MANUSCRIPT
Table 4. Final perceived quality estimation model
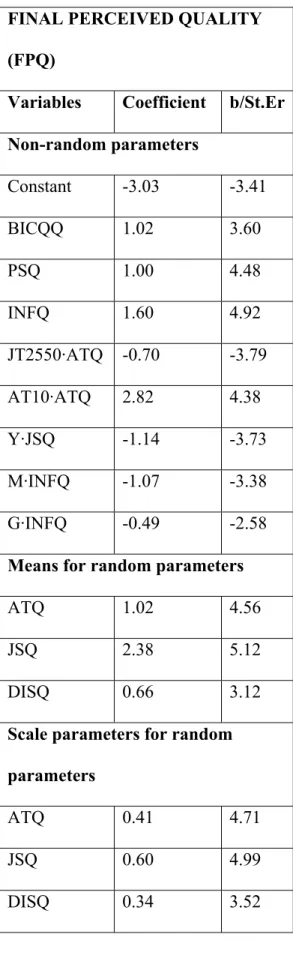
FINAL PERCEIVED QUALITY (FPQ)
Variables Coefficient b/St.Er Non-random parameters Constant -3.03 -3.41 BICQQ 1.02 3.60 PSQ 1.00 4.48 INFQ 1.60 4.92 JT2550·ATQ -0.70 -3.79 AT10·ATQ 2.82 4.38 Y·JSQ -1.14 -3.73 M·INFQ -1.07 -3.38 G·INFQ -0.49 -2.58
Means for random parameters
ATQ 1.02 4.56 JSQ 2.38 5.12 DISQ 0.66 3.12
Scale parameters for random parameters
ATQ 0.41 4.71 JSQ 0.60 4.99
ACCEPTED MANUSCRIPT
Threshold parameters for probabilities
MU(1) 350 4.22 MU(2) 11.41 6.77 Number of observations 195 Log likelihood function -77.63
ACCEPTED MANUSCRIPT
Table 5. Partial effects of the final perceived quality model
Summary of partial effects - FPQ model Variable Very Bad/Bad Not good, not bad Good Very Good ATQ 0 0 -0.0107 0.0107 BICQQ 0 0 -0.0106 0.0106 DISQ 0 0 -0.0069 0.0069 PSQ 0 0 -0.0104 0.0104 JSQ 0 0 -0.0249 0.0249 INFQ 0 0 -0.0167 0.0167 JT2550·ATQ 0 0 0.0073 -0.0073 AT10·ATQ 0 0 -0.0294 0.0294 Y·JSQ 0 0 0.0119 -0.0119 M·INFQ 0 0 0.0112 -0.0112 G·INFQ 0 0 0.0051 -0.0051 Downloaded by [151.47.31.239] at 22:17 13 August 2014
ACCEPTED MANUSCRIPT
Figure 1. Methodology for public involvement and the proposed modelling
ACCEPTED MANUSCRIPT
Figure 2. Variables collected in the survey